Correction of Scan Speed at CT Angiography due to Abdominal Aortic Aneurysm: An In Vitro Study Using Computed Fluid Dynamics
- 1. Department of Radiology, Tomshin Cardiovascular Imaging, Japan
Abstract
Objectives: To estimate the flow reduction of the aorta when abdominal aortic aneurysm (AAA) is present and to provide an appropriate scan time for CT angiography of the aorta using a small amount of contrast medium when AAA is present.
Methods: We performed an in vitro study by calculating the aortic flow using commercially available computed fluid dynamics software. We evaluated the following AAA models: aneurysm diameter, 30 to 60 mm; aneurysm length, 30 to 80 mm; inlet flow velocity, 30 to 60 mm/s. We defined Δtransit time as the difference in transit time of the aorta with and without AAA.
Results: Mean aortic flow decreased with increasing aneurysm size and length. The increase in Δtransit time was longer in patients with slow aortic flow than fast aortic flow. Quadratic relationship was present between aneurysm diameter and Δtransit time and the relationship was very good with R2 values ranging between 0.9972 to 0.9991. The relationship was also good between Δtransit time and aneurysm length with R2 values ranging between 0.9986 to 1. ΔTransit time was over 2 s especially when the aneurysm length was longer than 70 mm even when the inlet flow velocity was fast.
Conclusion: Aortic flow would decrease in patients with AAA. The delay in contrast medium arrival increases with aneurysm size and length. Scan time for CT angiography of the aorta should be tailored by AAA size when the contrast medium injection time is short.
Keywords
Abdominal aortic aneurysm; Computed fluid dynamics; CT angiography
Citation
Tomizawa N (2020) Correction of Scan Speed at CT Angiography due to Abdominal Aortic Aneurysm: An In Vitro Study Using Computed Fluid Dynamics. Ann Vasc Med Res 7(1): 1101.
ABBREVIATIONS
AAA: Abdominal Aortic Aneurysm; CFD: Computed Fluid Dynamics; CT: Computed Tomography; ROI: Region of Interest
INTRODUCTION
Computed tomography (CT) angiography of the aorta is a frequently used modality to assess aortic diseases such as aneurysm and dissection. As patients with aortic diseases occasionally have impaired renal function, the amount of contrast medium should be kept as small as possible during CT angiography [1]. Recent advances in CT technology allowed to scan the entire aorta within a few seconds using a very high-pitch scan [2]. In addition to reduction of scan time, low tube voltage with iterative reconstruction would allow CT angiography of the aorta using a small amount of contrast medium with preserved image quality [3]. However, inappropriately high scan pitch would occasionally surpass the contrast medium and results in suboptimal image quality in abdominal aorta [4].
Recently, double region of interest (ROI) timing bolus technique has been introduced to perform CT angiography of the aorta with a very short contrast injection time of 9 s [5,6]. Test bolus scan is performed at the level of the aortic root and flow of the aorta is estimated by acquiring time-density curves of ascending and descending aorta. The helical pitch during CT angiography of the aorta is determined to synchronize to the aortic flow. Previous studies showed that CT angiography of the aorta could be performed using 30 to 40 ml of contrast medium using this method [6]. One shortcoming of this method is that because the flow is calculated using data of thoracic aorta, correction of aortic flow is necessary when abdominal aortic aneurysm (AAA) is present [5,6]. AAA may cause turbulence of blood flow and result in energy loss [7]. Reduction of aortic flow in various AAA size could be estimated using computed flow dynamics (CFD) software. Therefore, the purpose of the present study was to calculate the reduction of aortic flow when AAA is present using a commercially available CFD software and to provide an appropriate scan time to follow the peak enhancement of the aorta.
MATERIALS AND METHODS
AAA Model
Seven idealized models with 30, 35, 40, 45, 50, 55, and 60 mm aneurysm size were investigated (Figure 1).
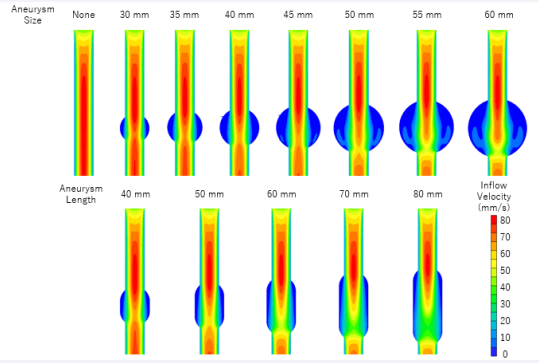
Figure 1: Velocity distribution of different size of aneurysms. Simulation of blood flow in aneurysm models was performed in various diameters from 30 to 60 mm. Long aneurysms were also assessed. The inflow speed was 45 mm/s in all cases shown in this figure
We assumed that each aneurysm to be a spherical shape. Furthermore, we also analyzed long aneurysm models as follows: 40, 50, 60, 70, and 80 mm length when diameter was 30 mm; 50, 60, 70, and 80 mm length when diameter was 40 mm; 60, 70, 80 mm length when diameter was 50 mm (Figure 1). The top and bottom was hemisphere and connected with a cylinder. Diameter and length of native aorta was 20 and 150 mm, respectively. The center of each aneurysm was placed at 100 mm from the top of the aorta. We placed the aneurysm at distal side rather than at the center (Figure 1 top left). This is based on a prior study to using a cylindrical model to test the appropriate length for the laminar flow to stabilize. Approximately 50 mm was necessary for the flow to stabilize.
In vitro Flow Calculation
We calculated the aortic flow using commercially available CFD software (CFD Works Ver 5.0; Concentration and Heat and Momentum Limited, London, UK). The calculation was performed in each cubical mesh and the mesh size was <1 mm. We made the following assumptions in the calculation: the flow was considered to be constant laminar; aortic wall was solid and the blood was incompressible, homogenous, and Newtonian; inflow was uniform and stationary at the inlet; no flow resistance at the outlet. The blood density was assumed as 998 kg/m3 with a viscosity of 0.005 Pa s [8]. Analysis was performed using the following seven inflow velocities: 30, 35, 40, 45, 50, 55, 60 mm/s. These velocities were selected based on in vivo data shown in previous studies [5,6]. The calculation time for each model was about 20 to 30 minutes.
Calculation of Excessive Scan Time
The mean velocity of axial slice of each aorta model was recorded in 1 mm interval. Because the flow stabilized at 50 mm from the entry of the aorta, we recorded the mean velocity between 50 and 150 mm of each model. Mean velocity and transit time of the 100 mm length was calculated based on the velocity data. ΔTransit time was determined as the difference in transit time of the aorta with and without aneurysm.
Statistical Analysis
Regression analysis was used to fit a quadratic relationship in aneurysm size and Δtransit time as shown in Figures 2 and 3.
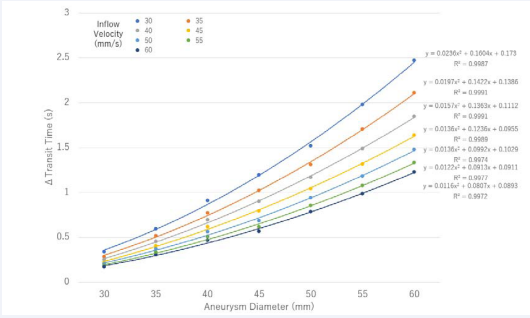
Figure 2: ΔTransit time vs aneurysm diameter at inflow velocity ranging from 30 to 60 mm/s.
We used a quadratic analysis because theoretically, blood flow correlates with vessel area. R2 values were used to summarize the percentage of variance explained by the regression fit.
RESULTS
Aneurysm Diameter and Velocity
Mean velocity decreased with increasing aneurysm size (Table 1).
|
Table 1: Aneurysm Size and Mean Velocity of Aorta. |
|||||||
|
Aneurysm diameter (mm) |
Inflow speed (mm/s) |
||||||
|
30 |
35 |
40 |
45 |
50 |
55 |
60 |
|
|
None |
30.2 |
35.2 |
40.3 |
45.3 |
50.4 |
55.4 |
60.5 |
|
30 |
27.4 |
32 |
36.6 |
41.2 |
45.8 |
50.3 |
54.9 |
|
35 |
25.6 |
29.8 |
34.1 |
38.3 |
42.5 |
46.8 |
51.0 |
|
40 |
23.7 |
27.7 |
31.5 |
35.4 |
39.3 |
43.3 |
47.2 |
|
45 |
22.2 |
25.9 |
29.6 |
33.3 |
37.5 |
41.3 |
45.1 |
|
50 |
20.7 |
24.1 |
27.4 |
30.8 |
34.2 |
37.6 |
41.0 |
|
55 |
18.9 |
22 |
25.2 |
28.4 |
31.6 |
34.7 |
37.9 |
|
60 |
17.3 |
20.2 |
23.1 |
26.0 |
28.9 |
31.9 |
34.7 |
The mean velocity dropped by 10, 20, 30, and 40% when the aneurysm diameter was 30, 40, 50, and 60 mm, respectively. Dramatic changes in velocity were observed within 10 mm from the beginning and end of the aneurysm and the lowest velocity was observed at the center (Figure 1). The velocity at each axial plane was solely dependent on the area of the plane, but the distribution of flow differed in the first and the latter half of an aneurysm. The peak downward flow at the center was higher in the first half than the latter half and regurgitant flow was present in the latter half especially when the aneurysm diameter was ≥ 45 mm (Figure 1).
Aneurysm Diameter and ΔTransit Time
Quadratic relationship was present between aneurysm diameter and Δtransit time (Figure 2). The relationship was very good with R2 values ranging between 0.9972 to 0.9991. The difference of Δtransit time between inflow velocity of 30 and 60 mm/s was 0.17 s in aneurysm with 30 mm diameter. The difference in Δtransit time increased to 0.44, 0.73, and 1.24 s when the aneurysm size increased to 40, 50, and 60 mm, respectively. ΔTransit time exceeded 1 s under the following conditions: aneurysm size 45 mm at inflow velocity of 30 and 35 mm/s, aneurysm size 50 mm at inflow velocity of 40 and 45 mm/s, aneurysm size 55 mm at inflow velocity of 50 and 55 mm/s, aneurysm size 60 mm at inflow velocity of 60 mm/s. ΔTransit time exceeded 2 s when aneurysm size was 60 mm at inflow velocity of 30 and 35 mm/s.
Aneurysm Length and Velocity
Aneurysm length inversely correlated with mean velocity (Table 2).
|
Table 2: Long Aneurysm and Mean Velocity of Aorta. |
||||
|
Aneurysm size (mm) |
Inflow speed (mm/s) |
|||
|
Diameter |
Length |
30 |
45 |
60 |
|
None |
None |
30.2 |
45.3 |
60.5 |
|
30 |
30 |
27.5 |
41.3 |
55.1 |
|
|
40 |
25.6 |
38.4 |
51.1 |
|
|
50 |
24.2 |
36.2 |
48.3 |
|
|
60 |
22.5 |
33.7 |
44.9 |
|
|
70 |
21.2 |
31.5 |
42.0 |
|
|
80 |
19.6 |
29.3 |
38.7 |
|
40 |
40 |
24.0 |
35.9 |
48.0 |
|
|
50 |
21.7 |
32.6 |
43.5 |
|
|
60 |
19.6 |
29.5 |
39.4 |
|
|
70 |
17.3 |
26.1 |
34.8 |
|
|
80 |
15.2 |
22.8 |
30.4 |
|
50 |
50 |
20.7 |
30.8 |
41.0 |
|
|
60 |
18.2 |
27.3 |
36.4 |
|
|
70 |
15.7 |
23.6 |
31.5 |
|
|
80 |
13.3 |
20.0 |
26.7 |
An additional 10 mm in aneurysm length was related with 7–8%, 9–13%, and 11–15% decrease in mean velocity when aneurysm diameter was 30, 45, and 50 mm, respectively (Table 2). Dramatic changes in velocity were observed within 10 mm from the beginning and end of aneurysm. Although the mean velocity in an axial plane reached plateau around the center, the maximum downward velocity decreased in the latter half of the aneurysm (Figure 1).
Aneurysm Length and ΔTransit Time
Quadratic relationship was present between Δtransit time and aneurysm length (Figure 3).
Figure 3: ΔTransit time vs aneurysm length for aneurysm diameter of (A) 30 mm, (B) 40 mm, and (C) 50 mm at inflow velocity of 30, 45, and 60 mm/s
The relationship was very good with R2 values ranging between 0.9986 to 1. When aneurysm diameter was 30 mm, Δtransit time exceeded 1 s only when the length was above 60 mm at inflow velocity of 30 mm/s and 80 mm at inflow velocity of 45 mm/s (Figure 3A). ΔTransit time was within 1 s when inflow velocity was 60 mm/s. When aneurysm diameter was 40 mm, Δtransit time exceeded 1 s at the length of 50, 60, and 70 mm with inflow velocity of 30, 45, and 60 mm/s, respectively (Figure 3B). ΔTransit time was over 2 s when the length was 70 and 80 mm with inflow velocity of 30 and 45 mm/s, respectively, and Δtransit time was even over 3 s when the length was 80 mm with inflow velocity of 30 mm/s. A model with aneurysm size of 50 mm showed that Δtransit time was over 2, 3, and 4 s when the aneurysm length was 60, 70, and 80 mm, respectively, at inflow velocity of 30 mm/s (Figure 3C). When inflow velocity was 45 mm/s, Δtransit time was over 2 s when the aneurysm length was 70 and 80 mm. Finally, when inflow velocity was 60 mm/s, Δtransit time was over 2 s when the aneurysm length was 80 mm.
DISCUSSION
Our experimental study showed that aortic flow would decrease when AAA is present. Decrease in velocity depends on aneurysm diameter and length. Furthermore, inflow velocity directly influences Δtransit time, whereas lower inflow velocity is related with longer Δtransit time. It is important to be aware of these three parameters when estimating the flow of abdominal aorta.
Reducing the amount of contrast medium during CT angiography of the aorta is important because patients with aortic disease occasionally have impaired renal function [1]. Using low tube voltage would increase the enhancement of contrast medium and could help to reduce the amount of contrast medium while maintaining the image quality [9]. A recent advance in CT technology allows acquiring the entire aorta within 1 second when a high-pitch spiral scan is applied [10]. Amount of contrast medium would reduce when these two techniques are combined, but enhancement of iliac arteries would be suboptimal when the contrast medium injection time is too short. Transit time from ascending to abdominal aorta is approximately 10 to 15 s, but it differs with patient condition such as cardiac output and presence of aneurysms [4,11]. A model to appropriately estimate the aortic flow is necessary to reduce the amount of contrast medium with preserved image quality.
Theoretically, performing a test injection scan at the top and bottom of the scan range would enable to estimate the transit time of the aorta [12]. A previous study used this method in run-off CT angiograph. However, the flow of aorta is too fast to track a single bolus at two different levels. Therefore, test injection needs to be performed twice with an increase in total amount of contrast medium. Recently, two methods have been proposed to estimate the aortic flow using a single test injection. First is femoral artery test injection method which estimates the aortic flow using peak enhancement time at the femoral artery during a single test bolus injection [4]. Aortic enhancement during main bolus significantly increased using this method than bolus tracking method, while 14% of patients resulted in inadequate enhancement. Another method is double ROI timing bolus method, which calculates the aortic flow by placing two ROIs at the ascending and descending aorta during a single test bolus scan at the aortic root level [5,6]. The strength of this method is that thoracic aortic flow could be calculated by performing a single injection of test bolus. However, because the flow of abdominal aorta is only an estimate, the enhancement of iliac arteries was 20% lower than the mean enhancement of the aorta [6]. The results of this study would help to accurately estimate the aortic flow of abdominal aorta especially when an aneurysm is present but needs in vivo validation.
Our study has several limitations. First, this was an experimental study and an in vivo study is necessary to confirm the results. Second, we used the same value of blood viscosity to calculate the aortic flow, but it would differ in patients with anemia. Third, we assumed that aneurysms to be a spherical shape, but the actual shape would be different in each patient. Furthermore, most AAAs extends to the bifurcation of iliac artery, so a model with bifurcated shape at the distal end of AAA model would further enhance the results of the study.
CONCLUSION
Aortic flow would decrease in patients with abdominal aneurysm. The delay in contrast medium arrival increases with aneurysm size and length. Scan time for CT angiography of the aorta should be tailored by AAA size when the contrast medium injection time is short.
REFERENCES
- Vasconcelos R, Vrtiska TJ, Foley TA, Macedo TA, Cardona JC, Williamson EE, et al. Reducing Iodine Contrast Volume in CT Angiography of the Abdominal Aorta Using Integrated Tube Potential Selection and Weight-Based Method Without Compromising Image Quality. Am J Roentgenol. 2017; 208: 552–563.
- Manna C, Silva M, Cobelli R, Poggesi S, Rossi C, Sverzellati N. High-pitch dual-source CT angiography without ECG-gating for imaging the whole aorta: intraindividual comparison with standard pitch single-source technique without ECG-gating. Diagnostic Interv Radiol. 2017; 23: 293-299.
- Annoni AD, Mancini ME, Andreini D, Formenti A, Mushtaq S, Nobili E, et al. Overall evaluability of low dose protocol for computed tomography angiography of thoracic aorta using 80 kV and iterative reconstruction algorithm using different concentration contrast media. J Med Imaging Radiat Oncol. 2017; 61: 614–621.
- Hoshino T, Ichikawa K, Hara T, Terakawa S, Hosomi K, Nishimura K, et al. Optimization of scan timing for aortic computed tomographic angiography using the test bolus injection technique. Acta radiol. 2016; 57: 829–836.
- Tomizawa N, Ito S, Nakao T, Arakawa H, Yamamoto K, Inoh S, et al. Double ROI Timing Bolus Technique to Perform Aortic CT Angiography With a 9-Second Contrast Injection Duration. AJR Am J Roentgenol. 2019; 213: 1–8.
- Tomizawa N, Ito S, Nakao T, Arakawa H, Yamamoto K, Inoh S, et al. Aortic CT angiography using the double region of interest timing bolus technique: feasibility of 80 kVp scanning in lean patients. Int J Cardiovasc Imaging. 2019; 35: 2113–2121.
- Sughimoto K, Takahara Y, Mogi K, Yamazaki K, Tsubota K, Liang F, et al. Blood flow dynamic improvement with aneurysm repair detected by a patient-specific model of multiple aortic aneurysms. Heart Vessels. 2014; 29: 404–412.
- Maeda N. [Hemorheology and physiological function--hemodynamics and blood viscosity]. Nihon Seirigaku Zasshi. 2004; 66: 234–244.
- Seehofnerová A, Kok M, Mihl C, Douwes D, Sailer A, Nijssen E, et al. Feasibility of low contrast media volume in CT angiography of the aorta. Eur J Radiol Open. 2015; 2: 58-65.
- Chen HL, Chen TW, Qiu LH, Diao XM, Zhang C, Chen L. Application of flash dual-source CT at low radiation dose and low contrast medium dose in triple-rule-out (tro) examination. Int J Clin Exp Med. 2015; 8: 21898–21905.
- Yuasa Y, Tanimoto A, Shinmoto H, et al. Multiple Transit Time Detection by 3D Test-Bolus Scan with lml Gd-Injection. 2000; 8: 2000.
- Baxa J, Vendiš T, Molá?ek J, St?pánková L, Flohr T, Schmidt B, et al. Low contrast volume run-off CT angiography with optimized scan time based on double-level test bolus technique - Feasibility study. Eur J Radiol. 2014; 83: 147-155.


