Clinical Application of the Ratio of Acceleration Time to Ejection Time in the Diagnosis of Native Valve Low-Flow, Low-Gradient Severe Aortic Stenosis
- 1. Department of Cardiovascular medicine, University of Illinois College of Medicine at Peoria, USA
Abstract
Severe aortic stenosis is defined based on the echocardiographic parameters including peak velocity, mean pressure gradient across the aortic valve and aortic valve area. Grading of AS solely based on these parameters may give discordant results and raise uncertainty about the true AS severity particularly in scenarios like less severe AS, low flow across the aortic valve due to reduced LVEF and presence of small aortic root. Low dose DSE has been validated to differentiate true versus pseudo severe AS. AVAproj can be utilized when low dose DSE is non-conclusive. The aim of this study is to evaluate the relationship between AT/ET and calculated AVAproj in patients with LFLG severe AS with reduced EF to determine a cutoff for this ratio to identify true severe AS in these patients.
Keywords
Acceleration time, Ejection time, Low-flow low gradient severe aortic stenosis, Ratio of acceleration time to ejection time
Citation
Avula S, Ghadiam HR, Mattumpuram J, Mungee S, Kizhakekuttu T, et al. Clinical Application of the Ratio of Acceleration Time to Ejection Time in the Diagnosis of Native Valve Low-Flow, Low-Gradient Severe Aortic Stenosis. J Cardiol Clin Res. 2021; 9(2): 1170.
ABBREVIATIONS
AS: Aortic stenosis; LVEF: Left ventricular ejection fraction; LFLG: Low flow low gradient; ET: Ejection time; AT: Acceleration time; AVA: Aortic valve area; AVAproj: Projected aortic valve area; DSE: Dobutamine stress echo; AT/ET: Ratio of acceleration time and ejection time
INTRODUCTION
Aortic stenosis is a progressive degenerative disease that may cause symptoms of heart failure, angina, syncope and higher risk of cardiovascular mortality. Severe AS is categorized into different patterns according to the flow across the stenotic valve, gradient, LV function and symptoms. Aortic stenosis is considered severe with echocardiographic parameters including peak aortic valve velocity of ≥ 4 m/s, mean pressure gradient of ≥ 40 mmHg and AVA of ≤ 1 cm2 . All asymptomatic severe AS patients are categorized under class C and all symptomatic severe AS patients are categorized under class D. Normal-flow severe AS patients are further classified into D1. LFLG severe AS with reduced LVEF are categorized as D2 and LFLG severe AS with normal LVEF / paradoxical LFLG severe AS patients as D3 subtypes.
Stress echocardiography is one of the validated tools for the evaluation of cardiac ischemia. Dobutamine increases heart rate and contractility. Dobutamine infusion of up to 40 mcg/kg/min is used to perform pharmacologic stress echocardiographic test in patients who cannot exercise. Whereas, low dose dobutamine stress echocardiography with peak infusion of up to 20 mcg/ kg/min can help differentiating true versus pseudo severe AS in patients with suspected LFLG AS. This may be challenging in the presence of discordance in the AVA and gradient at the end of DSE. In this situation, calculation of the AVAproj provides an estimate of what would be the AVA at a normal transvalvular flow rate. The AVAproj has been shown to be superior to the traditional DSE parameters proposed in the guidelines to assess the actual AS severity as well as to predict outcomes in LFLG AS [1,2]. However, a minimum of 20% increase in flow is required to obtain a reliable estimate of this parameter. In patients with no or minimal increase in stroke volume and flow rate DSE generally remains non-conclusive and other imaging modality like cardiac computed tomography calcium score of aortic valve is required to assess the severity of AS.
Other echocardiographic parameters like ET and AT measured on Doppler flow curve across the aortic valve have shown correlation with severity of AS in native valve [1], and prosthetic valve stenosis [3]. However, this has not been validated in LFLG severe AS. Our study looked into a correlation of AT and AT/ET ratio to AVAproj to determine a cut off in LFLG AS patient population.
MATERIALS AND METHODS
Retrospective, manual chart review of 2,887 patients who were evaluated with dobutamine stress test at OSF hospitals from January 2012 to December 2018 was performed. Major portion of the patients had DSE as part of ischemic evaluation. Only a small portion of patients had low dose DSE for suspected LFLG AS. Of them, 58 patients with LFLG severe AS with reduced LVEF were identified.
LFLG severe AS with reduced LVEF patients were identified based on echocardiographic parameters including AVA < 1 cm2 , mean aortic valve gradient < 40 mm Hg, LVEF < 50%. Further, AT/ET ratio and AVAproj were manually calculated, based on the ACC/AHA practice guidelines for valvular heart disease. AT/ET ratio was calculated using the velocity curve from the continuous wave Doppler recording across the aortic valve. ET was measured as the time from onset to end of systolic flow across the aortic valve. AT was measured as time interval from the beginning of systolic flow to its peak velocity. Later, the ratio of AT/ET and AVAProj was calculated.
AVAProj was manually calculated using the formula, AVAProj = AVARest + (ΔAVA/ ΔQ) × (250 – Qrest), where AVARest and Qrest are the AVA and Q (stroke volume / LV ejection time) at rest and ΔAVA and ΔQ are the absolute increases in AVA and Q during DSE. Recent 2D echocardiogram prior to dobutamine stress test was used to calculate the AT and ET values at rest. All the calculations were cross checked by another team member for confirmation. If any discrepancies noted, calculations were rechecked. The cutoff value of AVAProj ≤ 1.0 cm2 was used to identify true severe AS. A regression analysis was performed to establish correlation between AVAproj with AT/ET ratio and AVAproj with AT.
RESULTS
Of the total 2,887 patients who underwent dobutamine stress test, 58 patients were identified to have LFLG severe AS with reduced LVEF. Baseline characteristics of this small size patient population included mean age of 77 years with 74% males and 26% of females. Prevalence rate of hypertension was 72% and congestive heart failure was 72% as shown in Table 1.
Table 1: Baseline characteristics of patients with LFLG severe AS with reduced LVEF.
| Total number of LFLG severe AS patients with reduced LVEF |
58 |
| Mean age | 77 |
| Number (Percentage) of males | 43 (74%) |
| Number (Percentage) of females | 15 (26%) |
| Prevalence of hypertension | 72% |
| Prevalence of heart failure | 72% |
| Prevalence of diabetes mellitus | 36% |
| Prevalence of coronary artery disease | 59% |
Correlation of AT and AVAproj demonstrated modest positive relationship with R2 value of 0.27 and p value of 0.048 as shown in Figure 1.
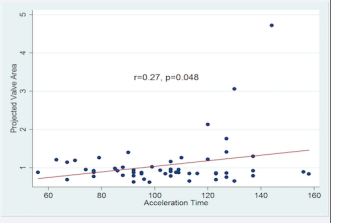
Figure 1: Correlation of acceleration time to projected aortic valve area
Correlation of AT/ET ratio and AVAproj showed modest inverse relationship with R2 value of 0.22 and p value of 0.11 as shown in Figure 2.
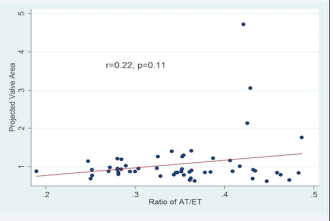
Figure 2: Correlation of ratio of AT/ET to projected aortic valve area
DISCUSSION
In our study, a statistically significant positive correlation between AT and AVAproj and statistically insignificant inverse relationship between AT/ET ratio and AVAproj values was noted. Though the relationship between AT and AVAproj was statistically significant, it showed positive correlation that is not valid.
There have been studies that looked into AT/ET ratio to diagnose severe native aortic valve stenosis with normal LVEF and prosthetic aortic valve stenosis. AT/ET ratio cut off of 0.35 has been reported to diagnose severe native aortic valve stenosis with sensitivity of 59% and specificity of 86% [1]. AT/ET ratio cut off of 0.37 was reported to identify severe prosthetic aortic valve stenosis with sensitivity of 96% and specificity of 82% [3]. Another study looked into ratio of AT/ET cut off to differentiate moderate and severe AS in trileaflet and bicuspid AS. They performed a receiver operating characteristic (ROC), analysis of AT/ET in trileaflet AS and gave an outstanding area under ROC curve of 0.93. Using a cut off of 0.35 AT/ET had a sensitivity of 90% and specificity of 88% for distinguishing between moderate and severe disease [4]. There have been studies in the past where AT/ET ratio has been assessed as a predictor for cardiovascular mortality and morbidity in LFLG severe AS patients but not as a surrogate marker in the diagnosis. A cut off value AT/ET ratio > 0.32 in patients with low-gradient severe AS was associated with a 2-fold higher risk of cardiovascular death and heart failure hospitalization [5].
There has not been any validated cut off range for AT/ET ratio in differentiating true versus pseudo severe AS in LFLG AS patients. As the severity of aortic stenosis progresses the acceleration time is increased which is well validated. For a successful correlation, one would expect strong negative correlation between AT and AT/ET ratio with AVAproj. Overall no successful correlation was being able to establish between the two variables of AT/ET ratio and AT with AVAproj in order to calculate a cut off value for the diagnosis of LFLG severe AS with reduced EF.
Factors that may have accounted for the negative findings include small sample size as most of the DSE where performed for evaluation of ischemia and only a fraction of studies where performed for suspected LFLG AS, technical challenges due to operator dependent parameters and inherent measurement errors.
CONCLUSION
In LFLG AS, low dose dobutamine stress echo remains the standard of testing to differentiate true versus pseudo severe aortic stenosis. Relationship of AT/ET ratio in this patient population may be re-evaluated in a larger size population.


