A Normative Study in MandarinSpeaking Children with Speech Intelligibility Rating
- 1. Beijing Tongren Hospital, Capital Medical University, China
- 2. Beijing Institute of Otolaryngology, Key Laboratory of Otolaryngology Head and Neck Surgery (Capital Medical University), Ministry of Education, China
- 3. Department of Otolaryngology, Peking University Third Hospital, China
ABSTRACT
Objective: The objective of this study is to use Speech Intelligibility Rating (SIR) to investigate the development of speech skills of Mandarin children with normal hearing, explore its reliability and validity, establish baseline data for evaluating the hearing performance of children with hearing loss, explore the relationship between children’s speech ability and hearing ability development, and design an appropriate hearing rehabilitation plan.
Methods: A total of 223 children were contacted, and 200 children with normal hearing were finally included. Children were divided into 10 groups according to age, with 20 children in each group. Their speech skill development was evaluated by SIR scale. Results: The speech ability score of normal hearing children improved with age. SIR scale has good reliability and validity.
Conclusions: The speech skills of children with normal hearing improve with age. At the age of 52 months, the SIR scale of children with normal hearing reached full score. The conversion table between age and score obtained from the data of this study can be used as a reference for evaluating children’s clinical speech ability.
CITATION
Zhong Y, Xu T, Chen X, Pan T (2022) A Normative Study in Mandarin-Speaking Children with Speech Intelligibility Rating. Ann Otolaryngol Rhinol 9(4): 1295.
INTRODUCTION
With the wide popularization of neonatal hearing screening and the wide application of hearing devices, such as hearing aids and cochlear implants, more and more hearing-impaired children are found and intervened with early. Their hearing ability developed by quickly, as did their language ability. In the rehabilitation of hearing-impaired children, it is very important to effectively evaluate their language ability. Through the evaluation, clinicians and rehabilitation teachers can accurately understand the development status of their language ability and provide support for formulating language rehabilitation countermeasures and training modes in the next step [1]. The evaluation of language ability of hearing-impaired children needs to be based on normal-hearing language development. Many studies have shown that the language ability of simple hearingimpaired children receiving early intervention can reach a very good level, and some children even have little gaps with healthy hearing children of the same age. This development trend poses a challenge to how to evaluate the language ability of hearingimpaired children [2-3].In order to meet the needs of evaluation, researchers have developed a large number of materials and tools for different evaluation purposes.
At present, the tools commonly used in the evaluation of language ability of hearing-impaired children in China can be divided into two categories: questionnaire evaluation and structured test. Structured test is to use well-designed and highly structured test items. Professionals directly test children and score their abilities according to their reactions. This method is suitable for hearing-impaired children with older age, higher cooperation and certain language ability. The questionnaire evaluation is generally completed by parents or rehabilitation teachers who are familiar with hearing-impaired children, focusing on the children’s response in real life situations. It is suitable for hearing-impaired children who are young and unable to cooperate with the test [4].
Speech intelligibility rating (SIR). The assessment tool is a questionnaire. It was developed by the pediatric cochlear implant project team of the University of Nottingham in 1998. It is used to assess children’s ability to use speech [5,6].The questionnaire can track and evaluate the development and change of children’s speech intelligibility for a long time. SIR is easy to understand and repeatable, so it is easy for professionals and parents to master and use.
The questionnaire has been widely used internationally. There are 5 items in total, and each item corresponds to a speech level. Level 1 is the lowest, indicating that coherent speech cannot be understood, words in oral English cannot be recognized, and the main way of daily communication of patients is gestures; Level 5 is the highest, indicating that coherent speech can be understood by all listeners, and the patient’s language can be easily understood in the daily environment.
The questionnaire has the advantages of simplicity, comprehensibility and high repeatability. It can be used by professionals, ordinary personnel and parents without children’s speech intelligibility evaluation experience. The disadvantage is that the grading is coarse, which is difficult to reflect the speech changes of hearing-impaired children in the short term.
At present, SIR is widely used in clinics as one of the common tools to evaluate the results of cochlear implantation [7]. SIR is designed as a real-time and effective global speech output measurement tool to measure speech output in real life [8]. Although most research teams pay attention to the speech development of hearing-impaired children after auditory compensation, the normal value data of SIR have not been obtained. The purpose of this study is to investigate the speech development of Mandarin children with normal hearing in order to establish the normal value data of sir. After the standardized scale is translated into Chinese, it is necessary to verify the reliability and validity of SIR scale.
METHODS
Questionnaire translation
Cross-cultural translation method was adopted [9]. The Chinese version of SIR is translated from the original English version by two English proficient audiologists. Four bilingual experts made necessary adjustments and modifications in semantic accuracy, cultural relevance and comprehensibility, and formed the first draft. In order to ensure the translation quality and reduce the errors introduced in the conversion process, the “back translation” method is adopted[10].
Participants
A total of 223 children participated in the study, eventually including 200 children aged between 1 and 60 months. Their normal hearing was confirmed by examination of hearing history, high-risk registration of hearing loss and hearing screening. There were 94 boys and 106 girls. They were collected from pediatric and child health clinics during routine health examinations. All children were divided into 10 groups with 20 children in each group. They are 1 month group, 2-3 months group, 4-6 months group, 7-9 months group, 10-12 months group, 13-18 months group, 19-24 months group, 25-36 months group, 37-48 months group and 49-60 months group respectively. Informed consent was obtained from the child’s parents / guardians and the study was approved by the medical ethics committee.
Procedures
Audiologists used face-to-face testing to evaluate SIR. Ask the child’s parents and score according to the parents’ description. The test selected structured interviews with parents at the children’s health clinic. The process follows three steps. The first is to confirm the basic information of children. The basic information and high risk registration form (HRR) defined by the infant hearing committee need to be completed by parents. If any of the ten risk factors exist, the child will not be considered for this test. The second step is to check through hearing screening. The rapid screening mode of distortion product otoacoustic emission (DPOAE quick screen) is selected for the screening project, as DPOAE is widely used as a screening tool in clinic. The screening criteria of this study are: (1) signal to noise ratio (SNR) ≥ 6dB. (2) It shall pass through at least three of the four frequencies. If the hearing screening results do not meet the standard, the results of the questionnaire are invalid. Finally, the SIR scale was used to evaluate the development of children’s auditory skills.
Measurements
The first evaluation of SIR 200 children were evaluated and the scores were calculated.
The evaluation of Categories of Auditory Performance II (CAPII) the same 200 children were evaluated by same evaluators and the scores were calculated
The re-evaluation of SIR: after 2 weeks, 60 children were randomly selected and evaluated again and the scores were calculated.
Evaluation of different personnel: 60 children were randomly selected and evaluated by other audiology professional that was familiar with the SIR scale and the scores were obtained. The coefficient between the two evaluators was calculated.
Outcome measures
Get the normal values of SIR scores at different months of age: According to the scores of SIR scale at different ages, the scatter diagram is made and the curve is fitted to obtain the formula of the fitting curve. The normal value range of different month age scores was obtained. The age mean and median of different scores were calculated.
Compare the scores of CAP-II and SIR: Record the scores of CAP-II and SIR, get the scatter diagram of CAP-II and SIR scores, fit the curve, and find the relationship between CAP-II and SIR.
Reliability:
(1) Test retest reliability: using the intraclass correlation coefficient (ICC) test, values greater than 0.750 are considered acceptable [11].
(2) Reliability between evaluators: ICC was used in the test. Greater than 0.750 is considered acceptable.
Validity
(1) Content validity
Using the expert judgment method, the content validity is evaluated by logical analysis, and four experts conduct logical analysis to delete the inappropriate content.
(2) Distinguishing validity
Distinguishing validity means that the scale can distinguish the characteristics of different groups. In order to verify the effectiveness of discrimination, we tested whether the scale can distinguish between high and low groups. In this study, we ranked the total scores of all subjects in ascending order. It is stipulated that the first 25% is the low group and the last 25% is the high group, including 25 low groups and 25 high groups.
Data analysis
SPSS 16.0 software was used for data analysis. A P-value<0.05 was considered statistically significant.
RESULTS
Percentage and cumulative percentage of children’s scores in each group
Table 1
Table 1: Percentages of children in each category at each group.
|
SIR score /Different groups |
1 |
2 |
3 |
4 |
5 |
6 |
7 |
8 |
9 |
10 |
|
1 |
20 |
20 |
18 |
14 |
3 |
1 |
0 |
0 |
0 |
0 |
|
2 |
0 |
0 |
2 |
6 |
17 |
17 |
8 |
0 |
0 |
0 |
|
3 |
0 |
0 |
0 |
0 |
0 |
0 |
5 |
6 |
0 |
0 |
|
4 |
0 |
0 |
0 |
0 |
0 |
2 |
7 |
11 |
7 |
1 |
|
5 |
0 |
0 |
0 |
0 |
0 |
0 |
0 |
3 |
13 |
19 |
shows the SIR scores of children in different groups. It can be seen that the previous group has a lower score and the latter group has a higher score. With the increase of age, the score of SIR questionnaire increased gradually, and month age was highly correlated with the score (Pearson correlation coefficient r = 0.836, P < 0.01).
Table 2
Table 2: Cumulative percentages in each category at each group.
|
SIR score /Different groups |
1 |
2 |
3 |
4 |
5 |
6 |
7 |
8 |
9 |
10 |
|
1 |
100 |
100 |
100 |
100 |
100 |
100 |
100 |
100 |
100 |
100 |
|
2 |
0 |
0 |
10 |
30 |
85 |
90 |
100 |
100 |
100 |
100 |
|
3 |
0 |
0 |
0 |
0 |
0 |
0 |
60 |
100 |
100 |
100 |
|
4 |
0 |
0 |
0 |
0 |
0 |
10 |
35 |
70 |
100 |
100 |
|
5 |
0 |
0 |
0 |
0 |
0 |
0 |
0 |
15 |
65 |
95 |
shows the cumulative percentages for each group. Since SIR is a strict rating scale, no children reach a higher category before the lower category, so the cumulative percentage is applicable. [9]
The development of SIR score versus age by month
The speech ability of Mandarin children with normal hearing improves significantly with age. The solid line in Figure 1
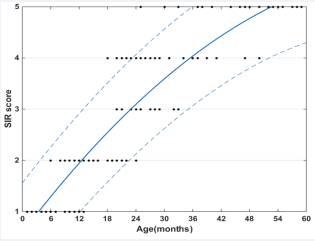
Figure 1: The development of median SIR score versus age by month.
shows the relationship between the median SIR score and month age after excluding the value of ceiling effect. The dashed lines plot the 5% and 95% confidence intervals based on the standard deviation of the residuals, respectively.
The upper dotted line indicates the upper limit of 95% confidence interval (UCL), indicating that 5% of children can achieve the above indicators. The lower dotted line represents the lower limit of the 95% confidence interval (LCL), indicating that more than 95% of children can reach the age condition.
In order to eliminate the ceiling effect, the later older age data are deleted successively from the first month of continuous full score, the approximate fitting curve is obtained, and the regression equation is calculated. The curve peaked at 52 months and the regression equation was used for the calculation in Table 3.
Table 3: Regression functions for prediction of SIR score from age and prediction of age from SIR.
|
SIR |
Score prediction equation |
R² |
Age prediction equation |
R² |
|
The best-fit curve |
Score=-0.0009126age² ?0.133age?0.5275 |
0.8925 |
Age=0.4418score²?8.5score-0.4963 |
0.8775 |
|
95% confidence bounds |
Score=-0.000674age² ?0.1176age?0.379 Score=-0.0006384age² ?0.1484age?0.676 |
|
Age=0.0214score²?10.251score-7.87 Age=0.2886score² ?9.2086score+2.814 |
|
Conversion between SIR score and month age
According to the age and score conversion formula obtained in Table 3, the table for predicting the score by age (Table 4)
Table 4: Prediction of SIR score as a function of age.
|
Age month |
Score |
Age month |
Score |
||||
|
LCL* |
Median |
UCL* |
LCL |
Median |
UCL |
||
|
1 |
0.49 |
0.65 |
0.74 |
31 |
3.37 |
3.77 |
4.56 |
|
2 |
0.61 |
0.78 |
0.87 |
32 |
3.45 |
3.84 |
4.67 |
|
3 |
0.72 |
0.91 |
1.01 |
33 |
3.52 |
3.92 |
4.77 |
|
4 |
0.83 |
1.04 |
1.15 |
34 |
3.59 |
3.99 |
4.88 |
|
5 |
0.95 |
1.16 |
1.30 |
35 |
3.66 |
4.06 |
4.98 |
|
6 |
1.06 |
1.29 |
1.44 |
36 |
3.73 |
4.13 |
5.09 |
|
7 |
1.16 |
1.41 |
1.58 |
37 |
3.80 |
4.19 |
5.19 |
|
8 |
1.27 |
1.53 |
1.72 |
38 |
3.87 |
4.26 |
5.29 |
|
9 |
1.38 |
1.65 |
1.85 |
39 |
3.94 |
4.32 |
5.39 |
|
10 |
1.48 |
1.76 |
1.99 |
40 |
4.00 |
4.38 |
5.49 |
|
11 |
1.59 |
1.88 |
2.13 |
41 |
4.06 |
4.44 |
5.00 |
|
12 |
1.69 |
1.99 |
2.26 |
42 |
4.12 |
4.50 |
5.00 |
|
13 |
1.79 |
2.10 |
2.39 |
|
4.18 |
4.55 |
5.00 |
|
14 |
1.89 |
2.21 |
2.52 |
44 |
4.24 |
4.61 |
5.00 |
|
15 |
1.99 |
2.31 |
2.65 |
45 |
4.30 |
4.66 |
5.00 |
|
16 |
2.08 |
2.42 |
2.78 |
46 |
4.36 |
4.71 |
5.00 |
|
17 |
2.18 |
2.52 |
2.91 |
47 |
4.41 |
4.76 |
5.00 |
|
18 |
2.27 |
2.62 |
3.04 |
48 |
4.47 |
4.80 |
5.00 |
|
19 |
2.37 |
2.72 |
3.16 |
49 |
4.52 |
4.85 |
5.00 |
|
20 |
2.46 |
2.82 |
3.28 |
50 |
4.57 |
4.89 |
5.00 |
|
21 |
2.55 |
2.91 |
3.41 |
51 |
4.62 |
4.93 |
5.00 |
|
22 |
2.63 |
3.01 |
3.53 |
52 |
4.67 |
5.00 |
5.00 |
|
23 |
2.72 |
3.10 |
3.65 |
53 |
4.71 |
5.00 |
5.00 |
|
24 |
2.81 |
3.19 |
3.76 |
54 |
4.76 |
5.00 |
5.00 |
|
25 |
2.89 |
3.28 |
3.88 |
55 |
4.80 |
5.00 |
5.00 |
|
26 |
2.98 |
3.36 |
4.00 |
56 |
4.85 |
5.00 |
5.00 |
|
27 |
3.06 |
3.45 |
4.11 |
57 |
4.89 |
5.00 |
5.00 |
|
28 |
3.14 |
3.53 |
4.23 |
58 |
4.93 |
5.00 |
5.00 |
|
29 |
3.22 |
3.61 |
4.34 |
59 |
4.97 |
5.00 |
5.00 |
|
30 |
3.30 |
3.69 |
4.45 |
60 |
5.00 |
5.00 |
5.00 |
and the table for predicting the age by score (Table 5)
Table 5: Prediction of age as a function of score.
|
Score |
Age months |
|
|
|
LCL* |
Median |
UCL* |
|
|
1 |
2.86 |
8.9883 |
13.74 |
|
2 |
12.09 |
17.4993 |
19. 87 |
|
3 |
22.22 |
28.0367 |
32.01 |
|
4 |
35.25 |
42.6005 |
48.15 |
|
5 |
43.18 |
52.1907 |
54.30 |
are obtained.
Correlation between CAP-II and SIR
According to the median score of the same age group of cap and Sir, the scatter diagram is obtained, the fitting curve is shown in Figure 2,
Figure 2: Correlation between CAP-II and SIR
and the score formula is SIR=0.0497CAPII²0.665CAP-II 0.6141, in which the SIR range is 1-5 and the CAPII range is 1-9. R ² Is 0.9145.
Reliability
The reliability analysis results of SIR scale are shown in Table 6
Table 6: test-retest reliability coefficients (n = 60).
|
Statistics Value |
ICC |
Spearman |
Kendall |
Kappa |
|
Value |
0.914 |
0.845 |
0.876 |
0.763 |
|
p value |
<0.001 |
<0.001 |
<0.001 |
<0.001 |
and Table 7.
Table 7: Reliability between evaluators (n = 60).
|
Statistics Value |
ICC |
Spearman |
Kendall |
Kappa |
|
Value |
0.894 |
0.845 |
0.876 |
0.763 |
|
p value |
<0.001 |
<0.001 |
<0.001 |
<0.001 |
As shown in the figure, the test-retest reliability ICC value of SIR scale is 0.914 and the reliability between evaluators ICC value is 0.894, both of which are greater than 0.750. Therefore, the scales have good test-retest reliability and inter evaluator reliability.
Validity
Content validity: The content validity was judged by expert evaluation method. Four experts in the field of Audiology logically analyzed the scale to judge whether it met the measurement objectives and requirements. After evaluation by four experts, it was found that the scale met the measurement objectives and requirements and had good content validity.
Distinguishing validity: Discriminant validity means that the scale can distinguish the characteristics of different groups. Independent sample t-test was performed in both high and low groups in two steps. The first step is to determine whether there is a significant difference between the two F-test; The second step is to use t-test to determine whether there is a significant difference between the two. Detailed results are shown in Table 8.
Table 8: T-test results of independent samples in high and low groups.
|
SCALE |
F test of variance equation |
t-test of mean equation |
||||||
|
F |
Sig. |
t |
Sig. (bilateral) |
Mean difference |
Standard error value |
Lower confidence limit (95%) |
Upper confidence limit (5%) |
|
|
SIR |
14 .214 |
.000 |
-1.789 |
.000 |
-.190 |
.089 |
-.306 |
-.106 |
|
-1.577 |
.000 |
-.190 |
.086 |
-.312 |
-.112 |
|||
DISCUSSION
Speech development of children with normal hearing
The purpose of this study is to create a Chinese version of Sir and determine the development track of speech ability of normal hearing children according to the score of the scale. The SIR score of children with normal hearing increased with age and reached the highest score at about 52 months.
Figure 1 shows the development track of speech ability of normal children from birth to 60 months. After curve fitting, the relationship between age and score is: score = -0.0009126age² 0.133age 0.5275 Age=0.4418score² 8.5score-0.4963. According to the formula, the score range of different ages and the age range of different scores can be predicted. From table 4 and table 5, we can see that the score of 4-month-old children can reach 1 point (unintellable). When the child is 13 months old, the score can reach 2 points (intelligent speech is developing in single words). When the child is 22 months old, he can get 3 points (Intelligible to a listener who concentrates and lip-reads). The score can reach 4 points at the age of 35 months (Intelligible to a listener who has littler experience of a deaf person’s speech.). When the child is 52 months old, the score can reach 5 points, which is the full score of the questionnaire (intelligent to all listeners).
Correlation between CAP-II and SIR
As shown in Figure 2, the development level of speech ability of children with normal hearing increases with the improvement of hearing development level, which suggests that most of our children with good hearing are more likely to have better speech ability. Therefore, we can know that hearing compensation for hearing-impaired children is very important for their speech development. We can also see from Figure 2 that with the improvement of hearing level, the development of speech level is faster and faster, which suggests that clinicians and rehabilitation teachers seize the peak of speech development and carry out speech rehabilitation training for hearing-impaired children to achieve better rehabilitation effect. We also obtained the relationship between children’s hearing and speech within 60 months. SIR=0.0497CAP-II² 0.665 CAP-II + 0.6141, the full score of SIR is 5 and the full score of CAP-II is 9. If it is found that the child’s speech ability does not match the development of hearing ability through evaluation, we should consider whether there are other related problems, such as speech organ disorders.
Reliability and validity
Reliability refers to the index that reflects the authenticity of test characteristics according to the consistency or stability of results obtained by test tools. If the measurement produces similar results under consistent conditions, it is considered to have high reliability. Reliability is expressed by correlation coefficient, which can be divided into stability coefficient and internal consistency coefficient [12]. The reliability in the stability coefficient consists of test-retest reliability and the reliability between evaluators, which is measured by the intra group correlation coefficient (ICC). In 1966, Bartko first used ICC to measure and evaluate the reliability of the scale. Less than 0.4 indicates poor reliability, and greater than 0.75 indicates good reliability [13]. The test-retest reliability was tested repeatedly by the same tester for the same group of children at a certain time interval. In this study, the test-retest reliability coefficient of SIR is 0.914 (> 0.75), indicating that the test-retest reliability of SIR is acceptable. The reliability between evaluators was evaluated by different evaluators without discussion [14]. Similarly, the reliability coefficient between evaluators of SIR scale is 0.894 (> 0.75), indicating that the reliability between evaluators of SIR scale is acceptable. SIR is usually used to track the rehabilitation results of children with hearing impairment, so test-retest reliability and reliability between evaluators are very important.
Validity refers to the accuracy of the scale, that is, the scale can accurately measure the content to be measured, including the effectiveness and correctness of the scale. Effectiveness is an important condition for scientific testing tools to play a role. Content validity is a subjective index that measures the content and compliance of the selected topic, and the measurement results are consistent with the measurement objectives and requirements. In this study, experts evaluate each level, considering that all items meet the measurement objectives and requirements, and have good content validity. Discriminant validity means that the scale can distinguish the characteristics of different groups. The results of this study show that the probability p value of F and t statistical tests is less than 0.05 of the significance level. It is considered that there is a significant difference between the two overall averages, indicating that the scale can distinguish children with different speech abilities and has good discriminant validity.
Clinical applications
The questionnaire used in this study is not a laboratory type test, but a questionnaire of daily performance, which can reflect the actual progress of children’s speech development in daily life. In addition, children who cannot cooperate with the subjective and objective tests due to age or other reasons can also quickly understand their speech development through questionnaire survey. On the other hand, because the survey method is not limited by language, the survey results can be compared between different languages for international communication.
For children with hearing impairment, we can quickly and objectively evaluate their speech development. And predict whether their speech ability meets the standard of normal children. If the month age calculated by the score according to Table 4 is significantly lower than the actual month age, or the score calculated by the age of the current month according to Table 5 is significantly lower than the actual score, it can be considered whether children have the problem of slow speech development. The possibility of hearing loss or insufficient hearing compensation equipment can be considered, and the sensory aids need to be optimized or other hearing devices need to be replaced. We can also consider whether there is the development of vocal organs. The age and score conversion tables (Tables 4 and 5) obtained in this study provide a reference for the evaluation of children’s speech development, and have certain clinical guiding significance for the intervention and speech rehabilitation of children with hearing impairment.
REFERENCES
- BLejeune,LDemanez.Speechdiscriminationandintelligibility:outcomeof deaf children fitted with hearing aids or cochlear implants. B-ENT.2006; 2: 63-68.
- Osberger MJ. Cochlear implantation in children under the age of two years: candidacy considerations. Otolaryngol Head Neck Surg. 1997; 117: 145-9.
- Valencia DM, Rimell FL, Friedman BJ, Oblander MR, HelmbrechtJ. Cochlear implantation in infants less than 12 months of age. Int J Pediatr Otorhinolaryngol. 2008; 72: 767–73.
- Tianqiu Xu, Yan Zhong, Hong Wang, Xueqing Chen. A normative study of auditory perception in Mandarin-speaking children with categories of auditory Performance-II. International Journal of Pediatric Otorhinolaryngology. 2021; 145: 110705.
- S Archbold, ME Lutman, DH Marshall. Categories of auditory performance. Ann Otol Rhinol Laryngol Suppl. 1995; 166: 312–314.
- MC Allen, TP Nikolopoulos, GM O’Donoghue. Speech Intelligibility in children after cochlear implantation. Am J Otol. 1998; 19: 742–746.
- Allen C, Nikolopoulos TP, Dyar D, GM O’Donoghue. Reliability of a rating scale for measuring speech intelligibility after pediatric cochlear implantation. Otol Neurotol. 2001; 22: 631 633.
- B Lejeune, L Demanez. Speech discrimination and intelligibility: outcome of deaf children fitted with hearing aids or cochlear implants. B-ENT. 2006; 2: 63-68.
- JA Harkness. Questionnaire translation, in: J.A. Harkness, F.J.R. van de Vijver, P. P. Mohler (Eds.), Cross-Cultural Survey Methods. Wiley Series in Survey.
- Kristine Bundgaard, Matilde Nisbeth Brøgger. Who is the back translator? An integrative literature review of back translator descriptions in cross-cultural adaptation of research instruments. Perspectives. 2019; 27: 833–845.
- Bartko JJ. The intraclass co rrelation coefficient as a measure ofreliability. Psychol Rep. 1966; 19: 3.
- TP Nikolopoulos, SM Archbold, GM O’Donoghue. The development of auditory perception in children following cochlear implantation. Int J Pediatr Otorhinolaryngol. 1999; 49: 189-191.
- Hinderink JB, Krabbe PF, Van Den Broek P. Development and application of a health-related quality-oflife instrument for adults with cochlear implants: the Nijmegen cochlear implant questionnaire. Otolaryngol Head Neck Surg. 2000; 123: 756-65.
- R Aiken Lewis, Gary Groth-Marnat. Psychological Testing and Assessment. Pearson. 2008.


