Using Propensity Score Matching to Compare Prognostic Differences between Multifocal/ Multicentric and Unifocal Breast Cancer
- 1. Breast Surgery Department, Affiliated Hospital of Hebei Engineering University, China
- 2. Department of Breast Center, the Fourth Hospital of Hebei Medical University, Shijiazhuang, China
Abstract
Background: The detection rate of Multifocal/Multicentric Breast Cancer (MMBC) is increasing, garnering greater clinical attention. However, prognostic differences between MMBC and Unifocal Breast Cancer (UBC) remain controversial.
Methods: This retrospective cohort study analyzed 109 MMBC and 4,198 UBC patients who underwent mastectomy at the Breast Center of the Fourth Hospital of Hebei Medical University from 2010 to 2014. Propensity score matching (PSM, 1:2 ratio, caliper = 0.1) balanced baseline characteristics. Two T-staging methods were evaluated: Tmax (largest lesion diameter) and Tsum (cumulative lesion diameters). Outcomes included Locoregional Recurrence (LRR), Disease-Free Survival (DFS), and Overall Survival (OS).
Results: MMBC patients were younger (median 46 vs. 52 years, p < 0.001), more frequently premenopausal (67.0% vs. 48.5%, p < 0.001), and had higher lymph node involvement (48.6% vs. 37.1%, p < 0.001). Under Tmax staging, MMBC showed comparable OS (p = 0.127) and LRR (p = 0.118) but inferior DFS (p = 0.010) versus UBC. Tsum staging increased TNM stages in 45.0% of MMBC patients, aligning DFS (p = 0.079) and OS (p = 0.269) with UBC. Multivariate analysis identified MMBC (HR: 0.387, p = 0.015) and nodal involvement (HR: 2.446, p = 0.022) as independent DFS predictors in Tmax-staged patients.
Conclusions: Tsum staging better reflects MMBC tumor burden, mitigating prognostic disparities observed under Tmax staging. Current Tmax-based protocols may underestimate MMBC severity, advocating for revised staging criteria.
Keywords
• Multifocal Breast Cancer
• Tumor Staging
• Propensity Score Matching
• Survival Analysis
Citation
Lv X, Fan Z, Li Y (2025) Using Propensity Score Matching to Compare Prognostic Differences between Multifocal/Multicentric and Unifocal Breast Cancer. Ann Breast Cancer Res 9(1): 1032.
INTRODUCTION
The definitions of multifocal and multicentric breast cancer —collectively termed MMBC—vary across studies, though MMBC typically denotes ≥2 ipsilateral lesions within the same (MF) or distinct (MC) quadrants. MMBC is associated with aggressive clinicopathological features, including younger age, higher lymph node metastasis rates, and advanced histological grade [1-4]. Despite these associations, consensus on MMBC’s prognostic impact remains elusive, with studies reporting conflicting survival outcomes [5-8]. Therefore, further research is necessary to clarify the prognostic implications of MMBC. A critical knowledge concerns T-staging methodology. Current AJCC (8th Edition) guidelines stage MMBC using the largest lesion’s diameter (Tmax), neglecting cumulative tumor burden. Emerging evidence suggests that summing all lesion diameters (Tsum) may better predict outcomes, though validation in large cohorts is lacking[9-11]. This study addresses two aims: 1. Compare prognosis between MMBC and UBC using propensity score matching (PSM) to minimize confounding. 2. Evaluate the clinical utility of Tsum versus Tmax staging in MMBC.
METHODS
Study Design and Population
This single-center retrospective analysis included women with stage ?-? breast cancer undergoing mastectomy (2010–2014). Exclusion criteria: prior excisional biopsy, occult/bilateral cancers, carcinoma in situ, or neoadjuvant therapy.
Data Collection
ductal Clinicopathological variables included age, menopausal status, tumor size, nodal status, TNM stage (AJCC), histology, and receptor status (ER/PR: positivity ≥1% nuclear staining; Ki-67: high ≥ 30%, based on consensus among Chinese experts.). For MMBC, immunohistochemistry was performed on the largest lesion.
Staging Methods
T stage was categorized as T1 (≤ 2 cm), T2 (> 2 cm but ≤ 5 cm), and T3 (> 5 cm) in pathology. Two approaches were used for T stage of MMBC tumors: Tmax: Based on the largest tumor lesion’s maximum diameter. Tsum: Based on the sum of all measurable tumor lesions’ maximum diameters. Pathological nodal (pN) staging: pN1: 1–3 metastases; pN2: 4–9 metastases; pN3: 10 or more metastases.
Outcomes
All patients were followed up through phone calls and outpatient visits. The follow-up period concluded on September 15, 2023, with a median duration of 144 months (range: 104–164 months). Locoregional Recurrence Free Survival (LRFS): Defined as the time from the initial diagnosis to the recurrence of cancer in the ipsilateral chest wall or regional lymph nodes (axillary, subclavian, supraclavicular, or internal mammary nodes). Disease Free Survival (DFS): Defined as the time from the initial diagnosis to disease recurrence or death from any cause. Overall survival (OS): Defined as the time from the initial diagnosis to death from any cause.
Statistical Analysis
Statistical analysis was conducted using SPSS Statistics software (version 26). Qualitative data were compared using the chi-square test, while quantitative data conforming to a normal distribution were described as means. Survival curves were generated using the Kaplan Meier method and compared between groups using the log-rank test to assess differences in LRFS, DFS, and OS before and after matching. Univariate and multivariate analyses were performed using Cox proportional hazards regression models. Statistical significance was set at p < 0.05. Propensity Score Matching (PSM) was applied to balance the characteristics of UBC patients with those of MMBC patients to minimize selection bias.
RESULTS
Baseline Characteristics
MMBC patients (n = 109) were younger (46 vs. 52 years, p < 0.001), more often premenopausal (67.0% vs. 48.5%, p < 0.001), and lymph node-positive (48.6% vs. 37.1%, p < 0.001) than UBC (n = 4,198)
Table 1: Clinicopathological characteristics before PSM.
|
Characteristics |
MMBC (N = 109) |
UBC (N = 4198) |
p |
|
Age, years |
46 (25-76) |
52 (22-93) |
< 0.001 |
|
Family History |
|||
|
Absent |
100 (91.7%) |
3995(95.2%) |
0.103 |
|
Present |
9 (8.3%) |
203 (4.8%) |
|
|
Menopausal Status |
|||
|
Premenopausal |
73 (67.0%) |
2036 (48.5%) |
v0.001 |
|
Postmenopausal |
36 (33.0%) |
2162 (51.5%) |
|
|
Clinical T stage(cT) |
0.108 |
||
|
1 |
59 (54.1%) |
2115 (50.4%) |
|
|
2 |
44 (40.4%) |
1916 (45.6%) |
|
|
3 |
5 (4.6%) |
76(1.8%) |
|
|
4 |
1 (0.9%) |
91(2.2%) |
|
|
Clinical N stage(cN) |
< 0.001 |
||
|
0 |
56(51.4%) |
2640(62.9%) |
|
|
1 |
41(37.6%) |
1192 (28.4%) |
|
|
2 |
11(10.1%) |
366 (8.7%) |
|
|
3 |
1(0.9%) |
0 (0) |
|
|
ER |
0.158 |
||
|
Negative |
21 (19.3%) |
1058 (25.2%) |
|
|
Positive |
88 (80.7%) |
3140 (74.8%) |
|
|
PR |
0.092 |
||
|
Negative |
37 (33.9%) |
1763 (42.0%) |
|
|
Positive |
72 (66.1%) |
2435 (58.0%) |
|
|
Tumor Grade |
0.162 |
||
|
? |
2 (1.8%) |
50 (1.2%) |
|
|
? ? |
57 (52.3%) |
1858 (44.3%) |
|
|
? ? ? |
13 (11.9%) |
821 (19.6%) |
|
|
Unknown |
37(34.0%) |
1469 (34.9%) |
|
|
Ki-67 |
|||
|
< 30% |
52 (47.7%) |
2071 (49.3%) |
0.737 |
|
≥ 30% |
57 (52.3%) |
2127 (50.7%) |
|
(Table 1). Post-PSM cohorts (Tmax: 82 MMBC/155 UBC; Tsum: 76 MMBC/130 UBC) showed no statistically significant differences (Table 2).
Table 2: Clinicopathological characteristics after PSM.
|
t |
Tmax group |
p |
Tsum group |
p |
||
|
MMBC (N = 82) |
UBC (N = 155) |
MMBC (N = 76) |
UBC (N = 130) |
|||
|
Age, years |
48.7 |
48.4 |
|
48.1 |
48.1 |
|
|
Family history |
|
|
0.43 |
|
|
0.79 |
|
Absent |
80(97.6%) |
148(95.5%) |
|
72(94.7%) |
122(93.8%) |
|
|
Present |
2(2.4%) |
7(4.5%) |
|
4(5.3%) |
8(6.2%) |
|
|
Menopausal status |
|
|
0.49 |
|
|
0.72 |
|
Premenoausal |
53(64.6%) |
93(60.0%) |
|
51(67.1%) |
84(64.6%) |
|
|
Postmenopausal |
29(35.4%) |
62(40.0%) |
|
25(32.9%) |
46(35.4%) |
|
|
pT |
|
|
0.75 |
|
|
0.55 |
|
1 |
45(54.9%) |
90(58.1%) |
|
19(25.0%) |
41(31.5%) |
|
|
2 |
35(42.7%) |
63(40.6%) |
|
52(68.4%) |
83(63.8%) |
|
|
3 |
2(2.4%) |
2(1.3%) |
|
5(6.6%) |
6(4.7%) |
|
|
pN |
|
|
0.82 |
|
|
0.39 |
|
0 |
44(53.7%) |
91(58.7%) |
|
41(53.9%) |
81(62.3%) |
|
|
1 |
29(35.4%) |
46(29.7%) |
|
26(34.3%) |
31(23.8%) |
|
|
2 |
7(8.5%) |
15(9.7%) |
|
8(10.5%) |
14(10.8%) |
|
|
3 |
2(2.4%) |
3(1.9%) |
|
1(1.3%) |
4(3.1%) |
|
|
ER |
|
|
0.45 |
|
|
0.30 |
|
Negative |
17(20.7%) |
39(25.2%) |
|
15(19.7%) |
34(26.2%) |
|
|
Positive |
65(79.3%) |
116(74.8%) |
|
61(80.3%) |
96(73.8%) |
|
|
PR |
|
|
0.84 |
|
|
0.36 |
|
Negative |
27(32.9%) |
53(34.2%) |
|
25(32.9%) |
51(39.2%) |
|
|
Positive |
55(67.1%) |
102(65.8%) |
|
51(67.1%) |
79(60.8%) |
|
|
Ki-67 |
|
|
0.63 |
|
|
0.21 |
|
< 30% |
36(43.9%) |
63(40.6%) |
|
33(43.4%) |
45(34.6%) |
|
|
≥ 30% |
46(56.1%) |
92(59.4%) |
|
43(56.6%) |
85(65.4%) |
|
pN: pathological N staging.
Staging Reclassification
Tsum increased T-stage in 45.0% of MMBC patients (T1→T2: 36.7%; T2→T3: 8.3%, p < 0.001), elevating TNM stage (p = 0.003) (Table 3,4).
Table 3: pT stage comparison: Tmax vs. Tsum in MMBC.
|
pT stage |
Tmax group (N = 109), n (%) |
Tsum group (N = 109), n (%) |
p |
|
1 |
63 (57.8%) |
23 (21.1%) |
< 0.001 |
|
2 |
41 (37.6%) |
72 (66.1%) |
|
|
3 |
5 (4.6%) |
14 (12.8%) |
|
pT: pathological T staging.
Table 4: TNM stage comparison: Tmax vs. Tsum in MMBC.
|
TNM stage |
Tmax group (N = 109), n (%) |
Tsum group (N = 109), n (%) |
p |
|
? |
36 (33%) |
14 (12.8%) |
0.003 |
|
?A |
39 (35.8%) |
39 (35.8%) |
|
|
?B |
21 (19.3%) |
41 (37.6%) |
|
|
?A |
12 (11%) |
14 (12.8%) |
|
|
?B |
0 (0) |
0 (0) |
|
|
?C |
1 (0.9%) |
1 (0.9%) |
|
Survival Analysis
In the Tmax group, MMBC had worse DFS (p = 0.010) (Figure 3),
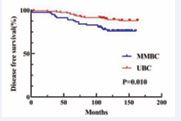
Figure 3 Kaplan–Meier analyses of DFS between MMBC and UBC patients in Tmax group.
but comparable OS/LRR (Figure 1, 2).
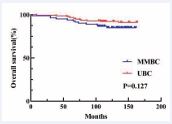
Figure 1 Kaplan–Meier analyses of OS between MMBC and UBC patients in Tmax group.
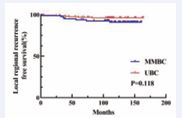
Figure 2 Kaplan–Meier analyses of LRFS between MMBC and UBC patients in Tmax group.
In the Tsum group, no statistically significant differences were observed (Figure 4-6)

Figure 4 Kaplan–Meier analyses of OS between MMBC and UBC patients in Tsum group.

Figure 5 Kaplan–Meier analyses of LRFS between MMBC and UBC patients in Tsum group.
Multivariate Analysis
In Tmax-staged patients, MMBC (HR: 0.387, p = 0.015) and N1 (HR:2.446, P=0.022) independently predicted reduced DFS. In Tsum-staged patients, Pn1 predicted LRR (HR: 5.286, P = 0.008).
DISCUSSION
This study demonstrates that MMBC patients present with distinct clinicopathological profiles, including younger age and higher nodal involvement. While Tmax staging revealed inferior DFS in MMBC versus UBC, Tsum staging reconciled these differences by accounting for cumulative rumor burden, resulting in comparable survival outcomes. With advancements in imaging techniques, such as magnetic resonance imaging (MRI), the detection rate of MMBC is increasing. However, our understanding of its pathogenesis and clinicopathological characteristics remains limited. Previous studies [1–4] have highlighted that MMBC is associated with higher nodal involvement, more lymphatic and vascular invasion, negative ER/PR status, and other adverse prognostic factors. Furthermore, some researchers have suggested [9] that MMBC may originate from a primary lesion metastasizing within the ipsilateral gland to form additional lesions, potentially explaining the higher biological risk profile observed in MMBC patients. However, whether MMBC correlates with worse prognosis remains a topic of debate, with insufficient related studies in China and conflicting findings in international research [5–8]. Currently, T staging for breast cancer is determined by the maximum diameter of the largest lesion, which excludes the contribution of smaller lesions. This approach may underestimate the tumor burden in MMBC patients. To address this limitation, some studies have proposed the Tsum staging method, where the sum of the maximum diameters of all measurable lesions is used to reevaluate the T stage. For instance, a retrospective study conducted in Turkey [10] involving 323 MMBC patients demonstrated that the Tsum staging method was superior to Tmax in predicting OS, challenging the validity of the traditional T staging method. Similarly, a retrospective study in Japan [11] supported this conclusion. However, there are studies that question the prognostic utility of the Tsum staging method [12–14]. While Tsum can elevate the T stage for some MMBC patients, the lymph node metastasis rate remains similar between MMBC and UBC patients. Additionally, Tmax staging has been shown to provide prognostic information comparable to the Tsum method. Thus, whether Tsum offers improved prognostic value over Tmax requires further investigation.
Given that the majority of previous studies on MMBC were retrospective, inherent biases were unavoidable. Additionally, MMBC patients exhibit more biological risk factors, complicating direct prognostic comparisons with UBC patients. A significant challenge lies in determining the most appropriate T staging method to accurately reflect the biological characteristics of MMBC, a question that continues to perplex clinicians. To address these challenges, we applied the Propensity Score Matching (PSM) method, matching MMBC patients with UBC patients according to two different staging approaches: Tmax and Tsum. This enabled a comparison of the prognostic differences between MMBC and UBC under each T staging method. After matching, no statistically significant differences were observed in baseline characteristics between the groups, ensuring a balanced comparison. First, we compared the prognosis of MMBC patients staged by Tmax and Tsum with their respective matched UBC cohorts. In the Tmax-staged group, there was no statistically significant difference in OS between MMBC and UBC patients (P = 0.127; Figure 1). However, DFS was significantly worse for MMBC patients compared to UBC patients (P = 0.010; Figure 3). In the Tsum-staged group, neither OS (P = 0.269; Figure 4) nor DFS (P = 0.079; Figure 6) showed statistically significant differences between MMBC and UBC patients. These results suggest that, for the same T stage, the prognosis of MMBC patients is generally worse than that of UBC patients. Furthermore, the Tmax staging method may underestimate the biological behavior of MMBC. Treatment plans formulated based on Tmax staging could lead to adverse outcomes due to underestimation of the disease severity. We further examined the differences in T staging and TNM staging between the Tmax and Tsum groups. The results revealed that using the Tsum staging method resulted in a 45.0% (49/109) upstaging of the T stage for MMBC patients, accompanied by an elevation in the overall TNM stage. Traditionally, a higher T stage is associated with a poorer prognosis. However, when MMBC patients staged by Tsum were compared with matched UBC patients, no statistically significant differences were observed in OS or DFS between the two groups. This suggests that the Tsum staging method better reflects the biological behavior of MMBC by accounting for the cumulative tumor burden, thereby providing a more accurate representation of the disease.
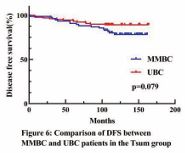
Figure 6 Kaplan–Meier analyses of DFS between MMBC and UBC patients in Tsum group.
Current guidelines for MMBC patients typically rely on the largest lesion to determine the T stage and to formulate treatment plans based on the lesion's immunohistochemical characteristics [15]. Consistent with these guidelines, this study performed immunohistochemical tests only on the largest lesion of MMBC patients. However, differences in immunohistochemical expression among different lesions in MMBC have not been explored. Future clinical practice should incorporate immunohistochemical testing for all lesions in MMBC patients to gain a more comprehensive understanding of the disease. This approach would facilitate the development of more effective and individualized treatment strategies. Despite balancing relevant clinical factors through propensity score matching, this study has several limitations. As a single-center retrospective study, the number of included MMBC patients was relatively small. Additionally, during the study period (2010–2014), anti HER2 therapies, such as trastuzumab, were not widely used in China, and most patients with HER2 2+ status did not undergo fluorescence in situ hybridization (FISH) testing. As a result, this study did not retrospectively analyze HER2 status. Furthermore, the study did not examine subsequent treatment modalities, such as chemotherapy, radiotherapy, and endocrine therapy, making their impact on patient prognosis unknown.
CONCLUSION
In summary, MMBC patients exhibit distinct demographic and pathological features versus UBC. Tmax staging underestimates tumor burden, leading to inferior DFS in MMBC; Tsum staging aligns prognoses by incorporating cumulative disease extent. Revised staging criteria for MMBC are warranted.
CODE AVAILABILITY
Not applicable.
DECLARATIONS
Ethics Approval and Consent to Participate
This retrospective cohort study was conducted in accordance with the principles of the Declaration of Helsinki.Given the retrospective nature of the study, and considering that all patient data used were de-identified (with personal identifiers such as names, hospital numbers, and contact information removed to protect patient privacy), we waived the requirement for written informed consent from individual patients. All procedures involving human participants were in compliance with relevant ethical regulations and institutional guidelines.
Availability of Data and Materials
The datasets used and/or analysed during the current study are available from the corresponding author on reasonable request.
Competing interests
None declared.
Founding
None received.
Author contributions
Xin Lv and Yuntao Li designed the study. Zhigang Fan acquired data. All authors involved in data interpretation. The manuscript was drafted by Xin Lv and Yuntao Li; reviewed and approved by Yuntao Li.
ACKNOWLEDGEMENTS
We thank all the patients and their families who participated in this study. We also thank all collaborators.
REFERENCES
- Rezo A, Dahlstrom J, Shadbolt B, Rodins K, Zhang Y, Davis AJ, et al. Tumor size and survival in multicentric and multifocal breast cancer. Breast. 2011; 20: 259-263.
- Tot T, Gere M, Pekár G, Tarján M, Hofmeyer S, Hellberg D, et al. Breast cancer multifocality, disease extent, and survival. Hum Pathol. 2011; 42: 1761-1769.
- Neri A, Marrelli D, Megha T, Bettarini F, Tacchini D, De Franco L, et al. "Clinical significance of multifocal and multicentric breast cancers and choice of surgical treatment: a retrospective study on a series of 1158 cases". BMC Surg. 2015; 15: 1.
- Lang Z, Wu Y, Li C, Li X, Wang X, Qu G. Multifocal and Multicentric Breast Carcinoma: A Significantly More Aggressive Tumor than Unifocal Breast Cancer. Anticancer Res. 2017; 37: 4593-4598.
- Shaikh T, Tam TY, Li T, Hayes SB, Goldstein L, Bleicher R, et al. Multifocal and multicentric breast cancer is associated with increased local recurrence regardless of surgery type. Breast J. 2015; 21: 121- 126.
- Katz A, Strom EA, Buchholz TA, Theriault R, Singletary SE, McNeese MD. The influence of pathologic tumor characteristics on locoregional recurrence rates following mastectomy. Int J Radiat Oncol Biol Phys. 2001; 50: 735-742.
- Kuan LL, Tiong LU, Parkyn R, Walters D, Lai C, Walsh D. Disease recurrence and survival in patients with multifocal breast cancer: a follow-up study with 7-year results. ANZ J Surg. 2017; 87: E125-E128.
- Lynch SP, Lei X, Hsu L, Meric-Bernstam F, Buchholz TA, Zhang H, et al. Breast cancer multifocality and multicentricity and locoregional recurrence. Oncologist. 2013; 18: 1167-1173.
- Choi Y, Kim EJ, Seol H, Lee HE, Jang MJ, Kim SM, et al. The hormone receptor, human epidermal growth factor receptor 2, and molecular subtype status of individual tumor foci in multifocal/multicentric invasive ductal carcinoma of breast. Hum Pathol. 2012; 43: 48-55.
- Karakas Y, Dizdar O, Aksoy S, Hayran M, Altundag K. The Effect of Total Size of Lesions in Multifocal/Multicentric Breast Cancer on Survival. Clin Breast Cancer. 2018; 18: 320-327.
- Fushimi A, Yoshida A, Yagata H, Takahashi O, Hayashi N, Suzuki K, et al. Prognostic impact of multifocal and multicentric breast cancer versus unifocal breast cancer. Surg Today. 2019; 49: 224-230.
- Hilton JF, Bouganim N, Dong B, Chapman JW, Arnaout A, O'Malley F, et al. Do alternative methods of measuring tumor size, including consideration of multicentric/multifocal disease, enhance prognostic information beyond TNM staging in women with early stage breast cancer: an analysis of the NCIC CTG MA.5 and MA.12 clinical trials. Breast Cancer Res Treat. 2013; 142: 143-151.
- O'Daly BJ, Sweeney KJ, Ridgway PF, Quinn C, McDermott EW, O'Higgins NJ, et al. The accuracy of combined versus largest diameter in staging multifocal breast cancer. J Am Coll Surg. 2007; 204: 282- 285.
- Boros M, Moldovan C, Varlam CM, Podoleanu C, Georgescu R, StolnicuS. Which is the best method to measure the size in multiple breast carcinoma in correlation with impact on prognosis? A retrospective study of 418 cases. Int J Clin Exp Med. 2016; 9: 3489-3496.
- Wedemeyer G. Protocol for the examination of specimens from patients with invasive carcinoma of the breast. Arch Pathol Lab Med. 2010; 134: 505.


