Brain Tumor Detection Using Watershed Transform
- 1. Department of Physics and Mathematics, Helwan University, Egypt
Abstract
The eventual fate of image processing and computer-aided diagnosis (CAD) in analytic radiology is more encouraging now than any other time in recent memory, with encouraging reliable results being reported from expert’s radiologist. Computer aided design systems are utilized generally in a few therapeutic zones for enhancing earlier recognition and treatment stages. Brain tumor is a standout between the most well-known malignancies among peoples in the developing countries. It has turned into a major reason for a death. In this paper we propose an execution for a quick segmentation of a brain tumors utilizing watershed transforms. This expands the watershed transform for division by permitting the integration of from the earlier data about image objects and the watershed calculation. Prior to the watershed change can start, the algorithm need a method of representing the brain image in terms of the amount of change around each pixel. Tumors in the digital image processing can be recognized as circled or semicircle in shapes and the intensity of the tumor will be darker as we moved far from its center. As mentioned before, the most brilliance point in the tumor image will be concentrated in its center. The complement for the center point can be taken as a local minimum that required for starting the watershed calculation. So every tumor image can be represented as a lake with critical value located in the center of supplement tumor image. The tumor center points were considered as seed points that improved the rate of a segmentation process very well. In the wake of utilizing the strategy, the identification of tumor rate turns out to be more reliable.
Keywords
• Watershed transforms
• Brain tumors
• Feature extraction
• Magnetic resonance imaging
Citation
Shahin OR (2018) Brain Tumor Detection Using Watershed Transform. Ann Clin Cytol Pathol 4(1): 1096.
ABBREVIATIONS
MRI: Magnetic Resonance Imaging
INTRODUCTION
Brain tumor is an ailment of unusual cells developing and increasing in an undisciplined way. It has turned out to be a standout amongst the most widely recognized and real reasons for the expansion in mortality among peoples on the world. Brain is bit of focal sensory system which is situated into the skull. It is delicate light mass of tissue that is ensured by bones of skull and three thin layers called meninges. Brain tumor is group of anomalous cells which in a roundabout way demolishes healthy cells of brain and causes aggravation, swelling inside the skull. Brain tumors can be classified into benign and malignant. These tumors can be found in various sizes and shapes, which differ from case to another case. Be that as it may, the impacts of both the sorts of tumor are generally same and can cause comparable issues relying upon their kind. Benign tumor is a non destructive sort of tumor which does not develop in adjacent tissues or spread to different parts [1]. While, malignant tumors are harmful tumor and are perilous since they spread to particular parts of body. The grade of tumor alludes to way, the cells look under a magnifying instrument.
Grade 1: Benign tissues, these tissues looks like typical tissues gradually offer ascent to these cells.
Grade 2: The cells are malignant these tissues look like ordinary tissues alike grade 1 tissue.
Grade 3: They are the malignant tissues which are not the same as should be normal cells. As they are anomalous cells so are quickly growing.
Grade 4: These are generally irregular cells and are quickly spread.
So that, the time was considered as a critical factor to stop the spread for such disease. The early detection is the way to enhance brain cancer diagnosis and treatment. The Magnetic Resonance Image (MRI) displays the high delicate tissue outline contrasted with other therapeutic imaging modalities and it’s ordinarily used to break down an assortment of infections in brain and the image segmentation is significantly utilized as a part of human services framework for examination and findings of different sicknesses in different restorative applications. Detection and segmentation of brain tumor from multimodal brain MR image is a testing assignment because of different factors, for example, brain MR image produced from assorted scanners with various arrangements and besides the brain tumor shifts from power fluctuates to sound tissues and with their shape, size and area is particular to quiet. With the significant progress in the brain MRI techniques have uncovered the expansive potential outcomes of brain life systems examination in light of multimodal brain MRI. The MRI imaging is ordinarily utilized as a part of the different biomedical applications to analyze an assortment of diseases, to visualize the inward development of the brain and to identify tumor.
Watershed transformation is an effective strategy for therapeutic image segmentation in view of numerical morphology. Such strategy respects the topographic surface of an image. Watershed transformation considers three points composes: (a) those that have a place with a provincial least; (b) those at which water would fall with assurance to a solitary least; and (c) those at which water would probably tumble to more than one such least. Catchment basins are the aftereffect of focuses that fulfill condition (b) and those that fulfill condition (c) frame peak lines that partitions distinctive catchment basins, alluded to as watershed lines. Catchment basins are the parcels we expect to acquire. The quantity of objects that outcome from segmentation relies upon the quantity of neighborhood minima that exists in the image. Watershed segmentation is generally utilized with MRIs, CTs, and X-rays on the grounds that it is straightforward, instinctive technique, and produces finish image division into isolated areas, regardless of whether the contrast is poor. Thus, there is no compelling reason to play out any post-preparing work, like contour joining. Be that as it may, the deformity of watershed transformation is over-segmentation, which implies that the image is isolated into an excessive number of locales, or an excessive number of items have been fragmented. This by an excessive number of neighborhood minima in the image. Another confinement of watershed division is its affectability to commotion. In this way, filtering tasks have been utilized to remove noise and ancient rarities in MRI. Also, the idea of morphological recreation and marker extraction can be utilized to kill over-division that outcomes from the utilization of watershed transformation on a gradient image.
There are numerous classifications for highlight for the tumors in image preparing, however we will take the fundamental and the one that will help us in our approach. In this way, we try to find the features that translate medical words to qualitative things that can be calculated through computer algorithm which considered the main goal for this paper. The principle classifications of features are: Geometric, Texture and Gradient highlights (features) [2].
MATERIALS AND METHODS
Tumor features
There are numerous classifications for highlight for the tumors in image preparing, however we will take the fundamental and the one that will help us in our approach. In this way, we try to find the feature that translates medical words to qualitative things that can be calculated through computer algorithm which considered the main goal for this paper. The principle classifications of features are: Geometric, Texture and Gradient features [2].
Geometric features: Geometric features portray the geometric properties of the Region of Interest (ROI). It is spoken to as a gathering of pixels in an image. In this way, for motivation behind recognition we have to depict the properties of pixels [2,3]. The geometric properties of the region are the fundamental regional descriptors that any object must distinguish by that highlights. In therapeutic analyze, geometric features are basic to perceive any object, regardless of brain. Along these lines, to design and recognize ROI from others we have to know its geometric features. The essential characters of geometric element are area, perimeter and compactness [4].
Texture features: Texture is really an extremely nebulous concept, frequently credited to human recognition, as either the appearance or the presence of the fabric. Everybody has his or her own particular translation to the idea of texture, so there is no numerical definition for texture. Basically, there is neither any exceptional meaning of texture, nor any one of a kind numerical model to combination texture. But there are numerous approaches to portray and extricate it. Unmistakably, image will for the most part contain tests of more than one texture. While no formal meaning of texture exists, naturally this depiction gives measures of properties, for example, smoothness, coarseness, and regularity. Texture features speak to an endeavor to describe gray level varieties between adjoining pixels in the image [5].
Gradient features: The gradient image is the subsidiary of the neighborhood image esteems. An edge in the original image would compare to a higher incentive in the gradient picture [6]. The sobel operator used to register the gradient image too. It has unmistakable focal points, in spite of the fact that it is somewhat more asymmetrical. It is less sensitive to disengaged high power point varieties since it normal focuses over a bigger territory. After we connected Sobel operation in all MRI and create the gradient pictures, we recalculate all texture highlights said above utilizing gradient picture. In other hand, we should as certained Gradient Normalized Histogram (GNH) from ROI histogram of the gradient picture at that point normalized the outcome. Along these lines, we utilize GNH vector and Gradient Image Vector in most gradient feature.
METHODOLOGY
The suspicious area (ROI) can be simply detected in an image if the area has adequate contrast from the background. The proposed algorithm can be summarized as follows
Reading the MR image
The image will be read and directly transformed to a 3D matrix 100×100×3.
Obtain the gradient of the input image
Use the gradient magnitude as the essential segmentation function. In this stage the detection of the Brain cells is attained. The object to be segmented differs significantly in contrast from the background image. Changes in contrast can be identified by operators that determine the gradient of an image. There are different methods to calculate the gradient of an image such, Sobel, Canny, Prewitt, Roberts, etc. But, in this work the Sobel detector operator is used because it is easy to execute, and it doesn’t deliver an extensive noise. Then the Detection the frontal area will take place, using objects utilizing morphological systems called “opening-by-recreation” and “shutting by-reproduction” to “clean” up the image. These tasks will create level maxima inside each protest.
Calculate the regional minimum
By complement the image the calculation of the minimum value for any tumor which represents the center for each complete tumor image can be detected. The whole image of the tumor can be expressed as complete graph of lake catchment basins with a minimum value surrounded by two parallel dams (Figure 1).
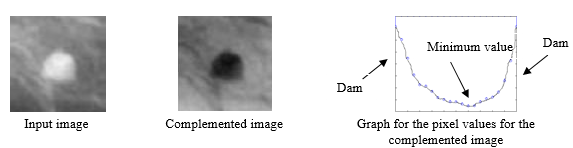
Figure 1: Shape of the tumor image.
Watershed segmentation
The idea of watersheds depends on envisioning a image in 3D: two spatial coordinates against dark levels [7,8]. In such a topographic understanding, we think about three sorts of focuses: a) points having a place toward regional minimum, b) point when water drops and c) point when water would probably fall. For a specific provincial least, the arrangement of focuses fulfilling condition (b) is called catchment basin or watershed of that base. A watershed locale or catchment bowl is characterized as the area over which all focuses stream “downhill” to a typical point. The focuses fulfilling condition (c) are named divide lines or watershed lines. The watershed transformation can be developed by flooding process on a dark tone picture and might be appeared as appeared in Figure 2.
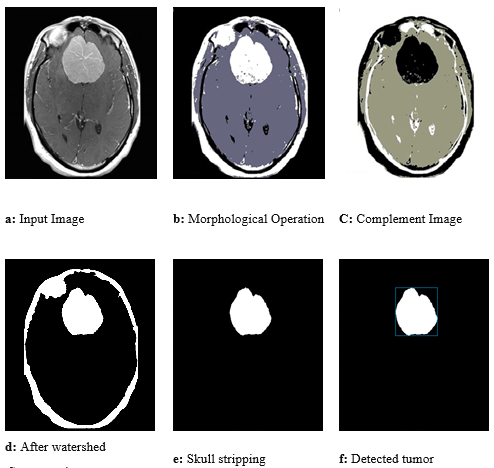
Figure 2: Sample of tumor segmentation.
As watershed division method isolates any picture as various force parcels and furthermore the tumor cells have high proteinaceous liquid (fluid) which has high thickness and consequently high intensity, in this manner watershed division is the best tool to characterize tumors and high power tissues of brain.
Skull stripping
There are a severable methods accessible to perform skull stripping, the calculation utilized as a part of our proposed framework depends on an edge task and is portrayed in the accompanying advances:
a. Labeled Im = convert image that resulted from last phase into labeled image.
b. Find the region properties for Labeled Im.
c. Skull Reg = region that have maximum perimeter.
d. Skull Reg assigns 0 and other pixels assign 1
Calculate the features for segmented areas
In this stage, the assurance of the geometric, texture, and gradient features will be accomplished by utilizing the all around characterized conditions [4-6]. These features can be listed below in Table 1[9].
Table 1: List of tumor features.
|
Metrics |
Formulae |
|
|
Area |
Area is the easiest way to give the size of the tumor. Therefore, it is the number of pixels in the extracted ROI. |
|
|
|
(1) |
|
|
Where: i , j are the pixels within the shape. And XROI is vector include ROI X positions, YROI is vector include ROI Y positions. |
||
|
Perimeter |
Perimeter is another straightforward property defined by the length of extracted ROI boundary. in addition, it is define as: |
|
|
|
(2) |
|
|
Where: Xedge, Yedge are vector stand for the coordinate of the ith , jth pixel forming the curve, respectively. |
||
|
Compactness |
Based on area and perimeter it is promising to characterize the compactness of a region. It calculates the object roundness and has value 1 for circle acts as a minimum values for the compactness. It is a dimensionless quantity. This measure was effective due to its insensitive to orientation. |
|
|
|
(3) |
|
|
Where: A is Area and P is perimeter |
||
|
Mean |
Mean is defined as the average pixels values within the ROI. It is important to know the brightness of ROI since the tumor has high value of intensity. |
|
|
|
(4) |
|
|
Mean Global Area |
Mean Global can be used to determine the relative amount of contrast between the region and the whole image. |
|
|
|
(5) |
|
|
Mean Local |
Mean Local can be used to determine the relative amount of contrast inside the region. |
|
|
|
(6) |
|
|
Uniformity |
Uniformity determines the uniformity of intensity in the histogram of a ROI. Tumor has positive low value of uniformity. |
|
|
|
(7) |
|
|
Where: NH is normalized histogram vector |
||
|
Standard Deviation |
Standard Deviation considered as the root mean square (RMS) deviation of the values from their arithmetic mean. If the data points are all close to the mean value, then the standard deviation is goes toward zero. If many data points are far from the mean, then the standard deviation is far-off from zero. In fact tumor is far from zero. |
|
|
|
(8) |
|
|
Smoothness |
Smoothness determine the relative smoothness of the intensity in a ROI. It is used to measure the region whether it is smooth or not. When its value is near to 1 this region is more complex than smoothness when the region is more smooth value is near to 0. Practically tumor is consider as a smooth area. |
|
|
|
(9) |
|
|
Skewness |
Skewness determine the asymmetry of the probability distribution of a real-valued random variable. A distribution has negative skew (left skewed) or positive skew (right-skewed). Ideally, Tumor has left skewness, which gets direction to the bright gray level. |
|
|
|
(10) |
|
|
Entropy |
Entropy represent the measure of chaos in an object gray level organization, large value of entropy correspond too much incompetent distribution. Low entropy images have very small contrast. Image that is ideally flat will have zero entropy. Tumor has negative low value of entropy. In fact tumor has negative low value of entropy. |
|
|
|
(11) |
|
|
Correlation |
Correlation is an extremely factor in a statistical approach. Moreover, correlation produces a large value if an object contains huge connected subcomponents of invariable gray level, and with large gray level differences is created between contiguous components. Tumor has elevated value of correlation. |
|
|
|
(12) |
|
|
Inverse |
It gives high value when the high value of the entry of normalized histogram vector (NH) is near to the main diagonal. Tumor has positive smallest value of inverse. |
|
|
|
(13) |
|
|
Sobel-Mean: |
|
(14) |
|
Sobel-Mean Global Area:
|
|
(15) |
|
Where: NBL and NBC correspond to respectively the number of lines and the number of columns of the image. |
||
|
Sobel-Uniformity:
|
|
(16) |
|
Sobel-Standard Deviation: |
|
(17) |
|
Sobel-Smoothness: |
|
(18) |
|
Sobel-Skewness: |
|
(19) |
|
Sobel-Entropy: |
|
(20) |
|
Sobel-Correlation: |
|
(21) |
|
Sobel-Inverse:
|
|
(22) |
Extract the location of the tumor
As indicated by the region properties for each fragmented zones we decide the tumor location according to its features. The assurance of the tumor features was based on the features values mentioned in [10,11].
RESULTS AND DISCUSSION
In order to display the advantages of the proposed technique it was implemented and applied on 180 genuine images. We utilized example pictures of 20 patients with 9 slices for every patient. These test images were gained utilizing a 3 Tesla Siemens Magnetom Spectra MRI machine. The aggregate quantities of slices for all channels were 20, which prompts add up to 180 images at 9 slices for every patient. This dataset had ground truth images that contrasted the consequences of our technique and the manual examination of radiologists. As we have seen, a portion of the tissues are darkened by a brilliant locale in the focal point of the tumor image. This bright region makes the image be unevenly lit up. Since the tumor image background is dull and the image objects are for the most part lighter than the image background, we utilize the top-hat transform to decrease the uneven brightening. The top-hat transform is characterized as the distinction between the original image and its opening. The opening of the image is the gathering of frontal area parts of a picture that fit a specific organizing component. After the discovery of the suspicious area and concentrate it from the entire brain locale the highlights for these district will be figured, as said before 22 features will be calculated and will be spared in database which contains 188 lines, each line for one image and 22 records in light of the fact that in each image we register 22 feature extraction. After that the outlined element will be displayed in Table 1 contains the base and greatest value for each feature, to make the readings less demanding we adjusted the entire outcome for three decimal places.
CONCLUSION
From the comparison tests that for result appeared in Table 2. We see that all highlights acquired by the proposed calculation are coordinating with those features in the past works. Along these lines, the proposed calculation can recognize the locale of the tumors and decide its areas. Notwithstanding the last advantage, it could recognize more than one tumor in a similar brain region, which offers energy to the proposed calculation as appeared in Figure 2. As observed from the exploratory outcomes, the proposed highlights extraction demonstrates a decent outcome. In this manner, it has a capacity to execute brain tumor CAD system.
REFERENCES
- Joseph A. Regezi, James J. Sciubba, Richard C. K. Jordan. Oral pathology: clinical pathologic correlations. Elsevier Health Sciences. 2016; 1-496.
- Liu Xiaoming, Jinshan Tang. Mass Classification in Mammograms Using Selected Geometry and Texture Features, and a New SVM-Based Feature Selection Method. IEEE Systems Journal. 2014; 8: 910-920.
- Tustison NJ, Shrinidhi KL, Wintermark M, Durst CR, Kandel BM, Gee JC, et al. Optimal Symmetric Multimodal Templates and Concatenated Random Forests for Supervised Brain Tumor Segmentation (simplified) with ANTsR. Neuroinformatics. 2015; 13: 209-225.
- Häberle L, Wagner F, Fasching PA, Jud SM, Heusinger K, Loehberg CR, et al. Characterizing mammographic images by using generic texture features. Breast Cancer Res. 2012; 14: 59.
- Bahadure NB, Ray AK, Thethi HP. Comparative Approach of MRI-Based Brain Tumor Segmentation and Classification Using Genetic Algorithm. J Digit Imaging. 2018.
- Nabizadeh N, Miroslav K. Brain tumors detection and segmentation in MR images: Gabor wavelet vs. statistical features. Computers Electr Eng. 2015; 45: 286-301.
- Kwon Goo Rak, Dibash Basukala, Sang Woong Lee, Kun Ho Lee, Moonsoo Kang. Brain image segmentation using a combination of expectation?maximization algorithm and watershed transform. Int J Imaging Syst Technol. 2016; 225-232.
- Bhima K, Jagan A. An Improved Method for Automatic Segmentation and Accurate Detection of Brain Tumor in Multimodal MRI. Int J Image Grap Sig Pro. 2017; 9: 1-8.
- Shahin O, Kelash H, Attiya G, Osama S. Farag Allah. Breast Cancer Detection Based on Dynamic Template Matching. Wulfenia J. 2013; 20: 193-205.
- Erickson, Bradley J, Panagiotis Korfiatis, Zeynettin Akkus, Timothy L. Kline. Machine Learning for Medical Imaging. Radiographics. 2017; 37: 505-515.
- Milletari Fausto, Seyed-Ahmad Ahmadi, Christine Kroll, Annika Plate, Verena Rozanski, Juliana Maiostre, et al. Hough-CNN: Deep learning for segmentation of deep brain regions in MRI and ultrasound. Comput Vis Image Underst. 2017; 164: 92-102.


