Assessment of Attitudes Regarding Access to Healthy Diet and Physical Activity Resources in an Urban Community Health Center Population
- 1. Department of Community Health and Social Medicine, Sophie Davis School of Biomedical Education, USA
ABSTRACT
Obesity is a major threat to public health. The socioecological model recognizes the many different contributors to obesity but, to date; primary care clinicians seeking to help patients to change their dietary and exercise habits have not effectively assessed non-physiological barriers to weight loss. The Capability Assessment for Diet and Activity (CADA), is a tool designed to help practices determine barriers to patient’s ability to change diet and exercise behaviors. One potential weakness of this tool was that it had only been tested in a Texas border area population for which it was developed. We administered the CADA to a random sample of patients at one community health center in New York City and report on the results that we obtained and the differences between our results and those previously published using the CADA. We conclude that the CADA is a useful tool to help clinicians and practices identify the environmental, social, and emotional barriers that have the potential to impact patient’s ability to achieve health-related goals.
CITATION
Deen D, Chang A, Maranda M (2015) Assessment of Attitudes Regarding Access to Healthy Diet and Physical Activity Resources in an Urban Community Health Center Population. Ann Community Med Pract 1(2): 1006.
KEYWORDS
• Community health
• Health behavior
• Surveys
• Primary health care
INTRODUCTION
The rising prevalence of obesity is a major public health problem worldwide. The extra medical costs of obesity in the USA in 2003 were estimated as$75billion annually and are expected to be increasing by $66billion/year by 2030 [1 ].
Unhealthy diet and physical inactivity have been identified as two of the most important contributors to this problem. The association of obesity with other chronic diseases (asthma, diabetes, hypertension, and hyperlipidemia) highlights the importance for primary care practitioners to assist patients with these non-communicable diseases in lifestyle change efforts to address risk factors [2]. Optimal disease management depends on patients making lifestyle changes [3]. Numerous theories of behavior change exist (e.g. self-efficacy, the Trans-theoretical Model, the Health Beliefs Model, etc.) [4-6] and effective interventions based on these theories have been investigated. However, most primary care practices are not organized to effectively deliver behavior change interventions. Physician interventions have been recommended, yet physician efforts alone are often not very effective in getting patients to fully adopt a healthier diet and lifestyle [7,8].This may be due to the barriers that individuals face (environmental or social) in changing behaviors that are beyond personal choice. To effect behavior change, both social and physical inhibitors must be recognized and addressed [9] and primary care practices may need to be reorganized to improve their effectiveness [10,11]. Practices must partner with patients [12], to set behavior change goals and help to identify community-based resources that can assist in addressing these barriers.
Risk factors for obesity are related to eating behaviors, sleep, and physical activity patterns (e.g., exercise and screen time). Many of these factors are family-based, and will require social support to formulate effective interventions. Resources for healthy diet and physical activity are limited in underserved communities. For example, opportunities for physical activity may not be available in certain neighborhoods due to a high crime rate which may result in the perception that it is too dangerous to use the facilities that exist. Family, friends, or co-workers may support or discourage positive healthy behaviors. Methods to evaluate these community resources are few and may not be culturally relevant to poor or minority communities. To this end, Ferrer and colleagues applied the concept of a “Capability Approach” to assess people’s opportunities to achieve health-related goals that they value [13]. They developed a tool, the Capability Assessment for Diet and Activity (CADA), to evaluate patient’s perceived capabilities regarding changing, diet and exercise. The purpose of the CADA is to identify potential limited opportunities for healthy behavior change among patients seen in a primary care setting. The CADA contains seven subscales: convenience, barriers, and knowledge, support from family and non-family, opportunity, time, and respect. One of the potential weaknesses cited in their report of the CADA [12] was that it was developed in only one region with a largely Hispanic, rural, mostly immigrant population. To help in addressing this weakness, we conducted the current study to evaluate the utility of the CADA instrument in an urban primarily minority population. Our hypothesis was that the CADA would be useful in better understanding the health-related behaviors, barriers, and knowledge of patients in a Federally Qualified Health Center in New York City.
METHODS
Population/Setting: The CADA instrument was administered to patients in the waiting area of an urban community health care center waiting room in New York City in the summer of 2014. Each patient who appeared to be capable of at least moderate physical activity was approached by a trained medical student research assistant and asked if they would like to participate in the study. The purpose of the study was explained to potential participants and informed consent was obtained. Individuals 18 years or older who were able to speak and read English were invited to participate in the survey. No incentives were offered. Respondents who mentioned they had difficulty reading because of poor eyesight (a possible indicator of a literacy issue [14]) were offered the option for the survey to be read to them.
Measures
We used a version of CADA that was modified by Ferrer and his colleagues after their initial study. It includes 38 statements which respondents either agreed or disagreed with on a 5-point Likert scale with 5 being strongly agree and 3 being not sure. Items that indicate agreement with a negative condition are reverse coded. Consequently a higher score indicates more support or more favorable conditions for a healthy lifestyle. Statements in the CADA comment about the availability of a resource, the lack of a resource or a barrier to a resource. The resource can be access to physical exercise, healthy food, or social support. A barrier can be lack of money, time, safety issues, hostility from a partner and emotional or health issues that limit activities. Other items refer to knowledge about healthy behaviors or concern neighborhood or community resources and family or spouse support or constraint.
In addition to the CADA we administered the Newest Vital Sign Tool (for Health Literacy) the Multidimensional Health Locus of Control (MHLC) Scale [15], Starting the Conversation (STC) (a brief dietary assessment and intervention tool), and questions developed in accordance with the Theory of Planned Behavior (TPB) model [16,17]. The protocol for this project was approved by the Institutional Review Boards both at the City College of New York and at the community clinical site.
The intent of the present paper is to present the results of the CADA, its subscales, and individual CADA items and to compare these results from a New York City sample with those of Ferrer, et al., who studied a Texas population [12]. In addition to give context to the CADA subscales and questions we also present results from the instrument Starting the conversation which reflects patient’s actual dietary intake.
Data Collection
A total of 160 individuals were approached to complete the data collection instruments. The participation rate was 88%, with 19 refusals. Completed surveys were reviewed for incomplete items. When necessary, the respondent was approached again and asked to complete the incomplete items. If they declined, no further effort was made to complete the survey. Questionnaires were considered to be incomplete and unusable if more than ten questions. Among the remaining 141 surveys, 21 were deemed unusable because the number of questions left blank per survey exceeded 10. Incomplete surveys were typically due to time constraints or unwillingness to complete them. Some patients reported that the survey was too long, or that they had to leave because they had completed their doctor’s visit. The responses to each of the120 usable questionnaires were entered into an SPSS file and verified for accuracy. If there was disagreement about a response to an item (usually due to poor legibility) an agreement for the best answer was reached between two of the researchers. The results presented are based on the 120 useable surveys.
Data Analysis
Of the CADA subscales related to conditions or situations that promote or obstruct a healthy diet or physical exercise, we excluded the subscale Respect from the analyses because the three items that comprise this subscale relate to attitudes toward linguistic isolation and immigration status that did not apply to this study population. The means for each of the six remaining subscales as well as the overall mean for the CADA scale were calculated and plotted for comparison. See (Figure 1).
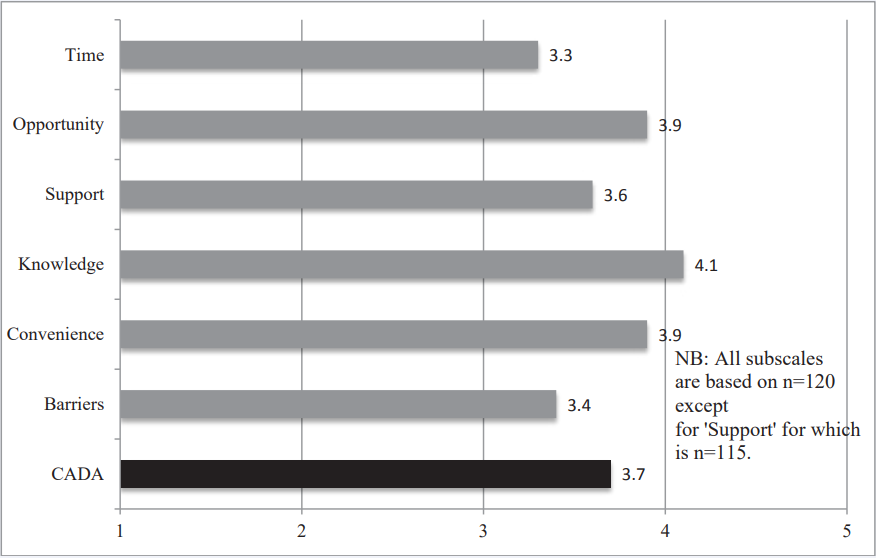
Figure 1: Capability Assessment for Diet and Activity Scale (CADA) with Subscale Comparison.
RESULTS
We examined how the various subscales means compared to the overall CADA mean (3.7, sd=0.38). Among the subscales, Knowledge (4.1, sd=0.57), Convenience (3.9, sd=0.57), Opportunity (3.9, sd=0.45), and Support scored above average while Time (3.3, sd=0.78) and Barriers (3.4, sd=0.79) scored below average. The “Knowledge” subscale scored the highest (4.1, sd=0.57).
The items in this subscale inquired if the individual believed that they knew where in the neighborhood they could be physically active, where to shop for healthy foods, and whether or not they knew how to make healthy choices when eating out.
Questions per training to the subscale “Time” explore the individual’s beliefs regarding their opportunities to food shop or cook meals for themselves. Questions included in this subscale also ask about physical activity and meal preparation in the context of family care: “Taking care of my family gives me little time to cook meals/be physically active.” This subscale received the lowest score (3.3 sd=0.78).
The “Barriers” subscale question show physical health, illness, and emotional state affected physical activity, food shopping, and meal preparation. Because these items are reversed coded, a higher score indicates fewer or weaker barriers. It too received a lower score than the CADA average (3.4 sd=0.79). (Figure 1) presents the mean for the CADA and six subscales.
Table 1 shows the demographics and socioeconomic characteristics of the sample.
Table 1: Survey Sample Demographic and Socioeconomic Characteristics N=120.
| Age | 18-81 years of age; (mean age 38.8) (1 unknown) |
| Gender | Female 81 (67.5%) Male 38 (31.7%) unknown 1 (0.8%) |
| Ethnicity | Number (%) |
| Hispanic | 31 (25.8%) |
| African-Am/Black(Non-Hisp) | 74 (61.7%) |
| White (Non-Hispanic) | 4 (3.3%) |
| Other (Non-Hispanic) | 9 (7.5%) |
| Unknown | 2 (1.6%) |
| Marital Status | |
| Married or living with someone | 40 (33.3%) |
| Single Never Married | 66 (55%) |
| Divorced/Separated/Widowed | 13 (10.8%) |
| Unknown | 1 (0.8%) |
| Education | |
| Less than High School Grad | 20 (16.6%) |
| High School Grad/GED | 38 (31.7%) |
| At least Some College | 61 (50.8%) |
| Unknown | 1 (0.8%) |
| Personal Income | |
| Less than $1000 per month | 48 (40%) |
| $1000 to $5000 per month | 52 (43.3%) |
| More than $5000 per month | 12 (10%) |
| Unknown | 8 (6.7%) |
| Reported using SNAP | 69 (57.5%) |
| Reported using Medicaid | 69 (57.5%) |
The respondents ranged in age 18 years old to 81 years old and 67.5% were female. Approximately half (50.8%) of the respondents reported that they had at least some college and 20.8% had four or more years of college. More than half of the respondents (61.7%) identified themselves as African American/Black and non-Hispanic. Two fifths of the respondents reported that their monthly income is less than a $1000. More than half (57.5%) reported that they use SNAP food stamps and more than half (57.5%) reported Medicaid as their health insurance.
Almost three-quarters of the sample reported height and weight that classified them as over weight (BMI > 25) and almost two-fifths were obese (37.5%) with a BMI> 30. Twenty percent of the sample had a history of diabetes. Twenty-two percent (21.7%) reported that their health was poor or fair, and almost half (49.2 %) reported that their health interferes, at least sometimes, with moderate physical activities during a typical day. Concerning emotional health, 40.9% reported that they felt downhearted and depressed at least some of the time during the previous 4 weeks. (Table 2) displays these health characteristics of the sample. Percentages are based on the number of respondents who answered each question.
Table 2: Health Characteristics of the Survey Sample N=120*.
|
Self-reported Health Status |
N (%) |
|
Poor |
3 (2.5%) |
|
Fair |
23 (19.2%) |
|
Good |
45 (37.5%) |
|
Very Good |
41 (34.2%) |
|
Excellent |
8 (6.7%) |
|
Self-reported diabetes |
24 (20%) |
|
BMI weight (kg)/height(cm)2 |
From 18 to 58.6 mean 29.6 (n=114) |
|
Overweight (BMI>25) |
86 (71.7%) |
|
Obese (BMI>30) |
45 (37.5%) |
|
Obese or Diabetes |
54 (45%) |
|
Health Interferes with Moderate Activity |
|
|
Yes limited a lot |
16 (13.3%) |
|
Sometimes limited |
43 (35.8%) |
|
No, not at all |
60 (50%) |
|
Unknown |
1 (0.8%) |
|
My health limits my daily activities compared to most people my age. |
|
|
Strongly Agree |
22 (18.3%) |
|
Agree |
35 (29.2%) |
|
Not sure |
23 (19.2%) |
|
Disagree |
27 (22.5%) |
|
Strongly Disagree |
13 (10.8%) |
|
Reported downhearted & depressed last 4 weeks |
|
|
All of the time/most of the time |
14 (11.7%) |
|
Some of the time |
35 (29.2%) |
|
A little of the time |
38 (31.7%) |
|
None of the time |
32 (26.7%) |
|
*Percentages are based on the number of respondents who answered the question. |
|
Data from Starting the Conversation was used to reflect patient’s actual dietary intake. (Figure 2) shows that the participants make moderately healthful decisions for the food groups questioned except for servings of fruits and vegetables.
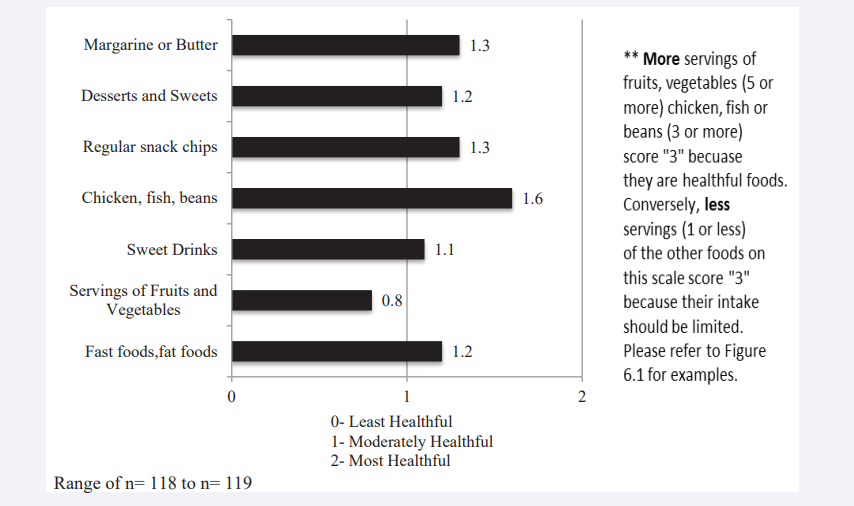
Figure 2: Starting the Conversation: Diet.
According to the results, the population had a mean score of 0.8 (sd =0.69) which corresponds to an “at least moderately” healthful diet. A score of 1 means 3 to 4 serving of vegetables per data and a score of 0 means 2 or less serving per day. Individual CADA items shed some light on these issues. (Figure 3) shows that while affordability may not be a problem in the short term, over a month’s time, it becomes difficult for a family or individual to sustain adequate fruit and vegetable in take on a limited budget.

Figure 3: CADA Items Specific to Fruits and Vegetables.
Comparisons between data from Texas and NY
We compared our results with a NYC sample on individual CADA items with Ferrer et al., results with a Texas population. There were some obvious differences between the two study populations: the Texas sample l used obesity and diabetes as selection criteria for participation but the NYC sample was not limited in this way. Half of the NYC sample was African-American and only about a quarter was Hispanic, in contrast Ferrer et al., sample was 81.5% Hispanic. Two thirds of the NYC sample had at least some college, while the Texas sample was less educated (any college 35%), and was on average older (mean age is 46.8) than the NYC sample and had more women (78%). Table 3, below compares our results with those of Ferrer et al.,[12] study on selected CADA items.
Table 3: Comparison of responses from Ferrer & colleagues original study with responses to the same item from the present study.
|
Item Description |
Ferrer & colleagues original study conducted in Texas (%) |
Current study conducted in NYC (%) |
|
Nearby outdoor Physical Activity |
71.9 |
93.2* |
|
Easy to walk places in neighborhood |
57.9 |
97.5* |
|
See people walk in my neighborhood |
66.3 |
96.7* |
|
Indoor Physical Activity on my schedule |
45.3 |
76.1* |
|
People generally feel safe in my neighborhood |
50.5 |
56.7 |
|
Groceries too expensive to afford over entire month (rev) |
70.8 |
68.9* |
|
Know where in neighborhood to be active |
59.6 |
85.0* |
|
Neighborhood well lit for activities |
40.3 |
65.8* |
|
Neighborhood Physical Activity w/o needing to pay |
48.6 |
58.3 |
|
Feel safe walking during the day |
60.3 |
85.8* |
|
Easy to get to food store |
85.6 |
94.2* |
|
Health limits my activities (rev) |
38.0 |
47.5* |
|
Can afford fruit & vegetables |
69.9 |
83.2* |
|
Taking care of family leaves little time for Physical Activity (reverse coded) |
64.7 |
45.6* |
|
Available fruit and vegetables where I shop |
95.9 |
91.6 |
|
Afford gym |
19.1 |
46.7* |
|
Partner sometimes refuses to eat healthy food (rev) |
69.4 |
63.8 |
|
Partner sometimes forbids me to be physically active (rev) |
86.0 |
80.9 |
|
Must consider partner's jealousy in planning day (rev) |
82.1 |
76.5 |
|
Local fruit and vegetables of high quality |
74.3 |
49.2* |
|
Illness gets in the way of Physical Activity (rev) |
44.5 |
40.3 |
|
Know how to eat healthy foods |
75.2 |
88.3* |
|
Afford lean meat and fish |
57 |
74.6* |
|
Too tired to cook own meals |
67.8 |
70 |
|
Know where to shop for healthy foods |
69.5 |
85.8* |
|
Feeling depressed keeps me from Physical Activity (rev) |
43.4 |
57.5* |
|
Feeling depressed keeps me from food shopping (rev) |
60.5 |
72.9* |
|
There are people I live with who eat healthy foods |
62.4 |
71.2 |
|
I have time to prepare my own meals |
76.3 |
79.2 |
|
Partner helps me get regular Physical Activity |
46.6 |
50.0 |
|
Taking care of family leaves little time for cooking (rev) |
72.8 |
55.9* |
|
Friends keep me company for Physical Activity |
44.7 |
57.1* |
|
My schedule gives me little time to shop for food (rev) |
67.8 |
57.1* |
|
(rev) = reverse coded from original. *The difference is statically significant at alpha=0.05 using a difference of proportion test. This was the only statistical procedure done using the R language. Note: all coded in direction of positive opportunity. Percentages in the table refer to proportion that indicated strongly agree or agree. Two items on the version of the CADA we used were not included in the original CADA. |
||
The table presents the proportion who indicated strongly agrees or agrees with a particular item. Given that New York City is densely populated compared to Texas some differences reflect what would be expected due to differences in population density. For items such as “Nearby Outdoor Physical Activities,’’ “Easy to Walk Places in Neighborhood,” and “See People Walk in My Neighbor” the NYC sample scored higher than the Texas sample. Also items that were related to ease of access were rated higher by the NYC sample than Ferrer and colleagues’ Texas sample. However, the NYC sample scored lower on items such “local fruit & veg of high quality” and “available fruit and vegetable where I shop.” Although the NYC group reported that they were better able to “afford a gym membership,” (46.7% vs 19.1%) and to purchase “fruits and vegetables” (83.2% vs 69.9%) and “lean meat and fish” (74.6% vs 57%) both groups experienced food insecurities. Results for both groups were similar for the item “Groceries too expensive to afford over entire month” the Texas group scored 70.8% and the NYC group 68.9%. Depression as a reason not to shop (72.9% vs. 60.5%) or engage in physical activities (57.5% vs 43.4%) was more often reported by the NYC group.
DISCUSSION
We utilized the CADA instrument developed by Ferrer et al., to reveal strengths and weaknesses expressed by120 underserved, mostly minority patients seen at one Federally Qualified Health Center in New York City. The CADA instrument identified emotional and physical barriers that limited patient’s capability to achieve health goals. The presence of these barriers, in addition to the lack of time, negatively affects the perceptions of the individual and consequently their intentions for healthy behavior. Differences and similarities were noted on individual CADA items between the results from the New York City sample when compared with the responses Ferrer obtained from their sample in Texas. The two groups differed on items that are likely associated with population density but suffered similar rates of food insecurity. The scale performed similarly with both populations and was versatile, serving as a valuable resource to identify key obstacles that individuals face emotionally, socially, environmentally, financially, and materially which impair their ability to achieve health goals. Individual items (more than subscales) help to identify barriers that may impact patients in primary care settings, and prevent them from successfully changing their behavior. The results also reinforce the need for health care providers to view each individual patient within their family, community, social and financial framework.
Helping patients improve their health involves setting goals for lifestyle behavior change. While the goals are typically positive and attractive, barriers to these goals may be present. The capability study performed by Ferrer, et al., demonstrated that a multi-dimensional survey tool such as the CADA could be used to explore the complexity of perceived available opportunities and barriers. The instrument reflects their death a teaching health goals not only involves the presence of resources and social support, but also adequate motivation to utilize these resources to achieve a desired goal.
Figure 4 illustrates the theory of planned behavior featured in the Capability Dictionary developed by Ferrer et al.
![Theory of Planned Behavior. Ferrer et al Ref [13].](https://www.jscimedcentral.com/public/assets/images/uploads/image-1706942849-1.PNG)
Figure 4: Theory of Planned Behavior. Ferrer et al Ref [13].
The different tools utilized in this study, such as the Capability Assessment for Diet and Physical Activity (CADA), Multi-Dimensional Health Locus of Control (MHLC) Scale, and the Newest Vital Sign (NVS). Tool for Health Literacy, are presented alongside the Theory of Planned Behavior item that they reflect. Together, they indicate the complexity and inter relatedness of the different survey instruments that might provide a well-rounded perspective of the patient’s translation between intention and achievement of health goals.
Our sample from the health center population was not only well educated, they also believe themselves to be knowledgeable about important health practices. Despite their level of educational attainment, data from the NVS tool indicates that most had difficulty reading food labels and understanding nutritional concepts on a food label2 . During survey administration, respondents often shared their thoughts on specific items of the questionnaire. While our study design did not include collection of qualitative data, some of these comments are instructive. One of the responses was, “I’m not limited by pain or injury, but it is difficult to exercise because of my weight.” In conjunction with demographic data shown in (Table 1), indicating those three quarters of our sample is overweight; (Figure 2) shows that the state of physical health, weight in particular, might be a barrier to physical activity in this population.
Some CADA items yielded ambiguous results due to low response rates, while other CADA items did not apply to everyone. We have mentioned the problem with the Respect subscale with our population. We have since learned that the questions associated with this subscale have been dropped from a newer version of the CADA. But there is also a problem for those that live alone with questions that imply social or familial relationships. The answers may not identify social isolation. About a fifth of the NYC sample reported that they lived alone (20.5%) which made the questions related to family involvement less relevant for them. Moreover some respondents mentioned to the research assistant that they were not the primary meal preparers in their family. Thus, the responses to questions in the subscale regarding time and opportunity might have included more “Not Sure” or “Disagree” responses than would be accurate because a “Not Applicable” option was not available. These questions should be modified to allow for answers such as “not applicable”, or “I do not make the food selections in my household,” or “because I live alone, I am not influenced by family,” to address these issues.
CONCLUSION
Unlike the population surveyed by Ferrer et al., the knowledge, opportunity, and support that the NYC site population possesses are some of the stronger aspects in the transition between intention and achievement. However, physical and emotional barriers as well as lack of time were often cited as barriers that detracted from patient’s motivation and ability to achieve their desired goals. In terms of translation from intention to behavior, those surveyed displayed moderately healthful diet choices with special attention needed toward fruit and vegetable intake.
The CADA explored a rich range of possible factors that a company the journey from intention to action in overweight or obese adults. A better understanding of these perceptions may be useful to help primary care providers assess the types of challenges that patients face in reaching their health goals when they leave the doctor’s office. While provider time is limited, our study design demonstrated that patients could complete this survey while in the waiting room with very little assistance from staff. Health centers or their community partners could then utilize the information obtained to identify shared needs of their patient populations and then try to harness resources that address these needs. For example, this center’s population relied heavily on the SNAP program and maintaining a healthy diet throughout the month was a challenge. As primary care providers, enlisting a diet it is an, nutritionist, health coach, or patient educator, who could address the relationship between finances and food purchases, may help patients maintain the financial resources to eat a healthier diet.
ACKNOWLEDGEMENTS
Funding for this research project was provided by the Rogers Fellowship of the New York Academy of Medicine. Special thanks to the staff and patients of the Helen B. Atkinson Health Center of the Community Healthcare Network.


