Prevalence and Determinants of Undernutrition among Under Five Children in Bangladesh: Evidence from the 2019 MICS
- 1. Department of Statistics, University of Rajshahi, Bangladesh
- 2. International Centre for Diarrhoeal Disease Research, Bangladesh
- 3. Department of Population Science and Human Resource Development, University of Rajshahi, Bangladesh
- 4. Department of Public Health, First Capital University of Bangladesh, Bangladesh
- 5. Department of Epidemiology and Preventive, Monash University, Australia
Abstract
Background: Malnutrition manifests as undernutrition and overnutrition, with stunting, underweight, and wasting being critical forms of undernutrition that hinder the physical and cognitive development of children under five in Bangladesh. This study aims to assess the nutritional status of children under five and identify key determinants of undernutrition.
Methods: This study utilized secondary data from the 2019 Multiple Indicator Cluster Survey (MICS), including 22,448 children under five. The analysis focused on socio-demographic factors. Chi-square and t-tests were used for hypothesis testing, and logistic regression identified determinants of undernutrition.
Results: The prevalence of multiple forms of undernutrition was 3.2%, with stunting affecting 27.9% of children, underweight 22.6%, and wasting 9.8%. Among districts, stunting was most prevalent in Sunamganj (45.9%), underweight in Habiganj (37.9%), and wasting in Lakshmipur (15.9%). Children from the poorest households had significantly higher odds of experiencing stunting (aOR: 2.2, 95% CI: 1.92-2.51), underweight (aOR: 2.4, 95% CI: 2.04-2.73), and wasting (aOR: 1.5, 95% CI: 1.24-1.83) compared to those from the richest households. Additionally, children in families with a history of child mortality had increased odds of stunting (aOR: 1.2, 95% CI: 1.05-1.32), underweight (aOR: 1.2, 95% CI: 1.07-1.36), and wasting (aOR: 1.2, 95% CI: 1.06-1.45).
Conclusions: Household wealth and a history of child mortality were key determinants of undernutrition among children under five. Parental education, particularly the lack of primary education in both parents, was strongly associated with stunting and overall undernutrition. These findings highlight the need to improve socio-economic conditions and promote parental education to reduce childhood undernutrition in Bangladesh.
Keywords
• MICS
• Undernutrition
• Under Five Children
• Prevalence and Determinants of Undernutrition
Citation
Nahar MA, Haque M, Parvin S, Sultana M, Chowdhury MRK, et al. (2025) Prevalence and Determinants of Undernutrition among Under Five Children in Bangladesh: Evidence from the 2019 MICS. Ann Community Med Pract 10(1): 1067.
INTRODUCTION
Malnutrition is a critical global public health issue that is alarming for the development of developing countries like Bangladesh. Rates of malnutrition in Bangladesh are among the highest in the world. In Bangladesh, more than half the population suffers from malnutrition. Malnutrition affects people in every country. Nearly half of deaths among children under 5 years of age are linked to undernutrition. These mostly occur in low- and middle income countries [1]. Globally, 144 million children under 5 suffer from stunting, 47 million children under 5 were wasted of which 14.3 million were severely wasted, and 38.3 million were overweight [2]. Over the past fifteen years, Bangladesh has succeeded in reducing childhood malnutrition, but substantial inequalities exist across geographical regions and economic groups [2]. In all forms of undernutrition, children living in rural areas face greater challenges than those living in urban areas [3]. District-level undernutrition indicators show that districts in north-eastern and south-eastern parts are highly exposed to either form of undernutrition than the districts in south-western and central parts of the country. Study revealed that over two-fifths of the children were stunted, of which 26.3% were moderately stunted and 15.1% were severely stunted in rural areas [4]. In contrast to the national decrease observed in Bangladesh overall, child malnutrition has increased in Sylhet in recent years [5,6]. A study revealed that 43% of the children under age five were suffering from chronic malnutrition, 17% were acutely malnourished, and 41% had an underweight [7]. Bangladesh’s nutrition gains have been amongst the highest in the world. However, still many millions of children in Bangladesh grow up stunted because of poor nutrition [8]. Latest nationwide data (2019) used to evaluate four malnutrition statuses of under 5 children. Households with lower socio-demographic status had more malnourished children [9]. The children are facing stunting in the long run. This scenario is almost the same for urban and rural areas [10]. The primary objective of this study was to assess the current nutritional status of children under five in Bangladesh. The dataset comprises information from 64 districts, incorporating multiple indicators of child nutrition and health. Although numerous studies [10-14], have explored under-five malnutrition in Bangladesh, comparative analyses between urban and rural settings remain limited. Only a few studies have explored area disparities in childhood malnutrition with some focusing solely on the rural area scenario [15-18]. The existing research primarily focuses on undernutrition prevalence without systematically comparing area wise disparities and their underlying socio-demographic and economic determinants. This study aims to address this gap by providing a comparative analysis of undernutrition indicators across urban and rural populations. By analyzing the spatial distribution and socio economic determinants of childhood undernutrition, this research provides a comprehensive understanding of its prevalence in different areas. Identifying high-risk areas and vulnerable groups will enable policymakers to develop targeted interventions aimed at reducing child undernutrition, morbidity, and mortality in Bangladesh. The findings may also inform future policies and programs aimed at achieving sustainable improvements in child nutrition and overall public health.
MATERIALS AND METHODS
Source of data
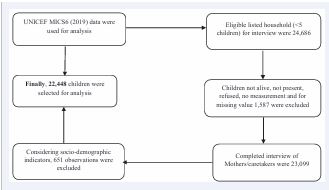
For this study, we utilized data extracted from the Multiple Indicator Cluster Survey (MICS) 2019, conducted by UNICEF. The MICS 2019 represents the sixth edition of this survey, which was carried out using a two-stage stratified cluster sampling by the Bangladesh Bureau of Statistics (BBS) in collaboration with UNICEF Bangladesh, spanning from January to May 2019. The survey included 3,220 Primary Sampling Units (PSUs), covering a total of 64,400 households, with 24,686 eligible households that had children under five years old selected for interviews. The final dataset for our analysis consisted of 22,448 completed interviews with mothers after excluding certain socio-demographic factors. Figure 1 depicts the algorithm used to outline the selection process of the study sample from the MICS datasets.
Figure 1 Study sample selection algorithm.
The MICS surveys are designed to be nationally representative, with sample sizes large enough to ensure robust estimates at regional, provincial, and urban-rural levels. The MICS 2019 was specifically structured to provide data on a wide array of indicators concerning the situation of children and women at the national level, as well as across different geographic regions, including regions, governorates, and districts. The survey utilized a multi-stage, stratified cluster sampling technique for sample selection, and the data is not self-weighting. Therefore, sample weights were applied to ensure accurate national-level estimates.
Variables included in the study
In this study, undernutrition was considered as the outcome variable, which was assessed using three indicators: stunting (height-for-age z-score), underweight (weight-for-age z-score), and wasting (weight-for-height z-score). Undernutrition was defined according to the World Health Organization (WHO) standards, with a z-score of <-2 standard deviations (SD) from the median. The covariates used in the analysis were derived from the socio-demographic section of the dataset and were categorized into three groups: household characteristics, maternal characteristics, and child characteristics.
Statistical Analysis
All statistical analyses were conducted using STATA (Stata Statistical Software: Release 15, StataCorp LLC, College Station, Texas, USA). For data visualization, bar charts waere used. Descriptive analysis was performed to examine the characteristics of the study participants, with results presented as frequencies and percentages. Descriptive statistics, including proportions, means, and standard deviations, were used to summarize the data. Bivariate analyses, specifically the Chi-square test, was utilized to assess significant differences between two categorical variables. For inferential statistics, a 95% confidence interval (CI) was applied, and statistical significance was determined with a p-value threshold of <0.05. To examine the strength of the association between undernutrition and the independent variables, a multiple logistic regression model was employed. Additionally, to identify the adjusted factors associated with child undernutrition, the data were weighted for analysis.
RESULTS
Table 1: Socio-demographic and economic characteristics of under five children by residence.
|
Basic characteristics |
Urban (18.70%) |
Rural (81.30%) |
Overall |
p-values |
|
Household |
||||
|
Father age in years (Mean ± SD) |
34.92±6.97 |
34.66±7.38 |
34.71±7.30 |
0.112 |
|
Father had no formal education |
3328(86.44) |
12487(77.39) |
15815(79.13) |
<0.001 |
|
Muslim religion |
3841(91.52) |
16363(89.66) |
20204(90.00) |
<0.001 |
|
Bengali ethnicity |
4135(98.52) |
17827(97.68) |
21962(97.83) |
<0.01 |
|
Number of family members (≤3) |
701(16.70) |
2279(12.49) |
2980(13.28) |
<0.001 |
|
Had only one (1) under five children |
3202(76.29) |
13261(72.66) |
16463(73.34) |
<0.001 |
|
Had (5-17) years old children |
2584(61.57) |
12190(66.79) |
14774(65.81) |
<0.001 |
|
Had one (1) sleeping room |
1354(32.26) |
5747(31.49) |
7101(31.63) |
0.332 |
|
Cooking place was in main house |
2311(55.06) |
5625(30.82) |
7936(35.35) |
<0.001 |
|
Wealth quintile |
|
|
|
<0.001 |
|
Poorest |
362(8.63) |
5190(28.44) |
5552(24.73) |
|
|
poorest |
362(8.63) |
4311(23.62) |
4673(20.82) |
|
|
Middle |
551(13.13) |
3688(20.21) |
4239(18.88) |
|
|
Richer |
1005(23.95) |
3207(17.57) |
4212(18.76) |
|
|
Richest |
1917(45.68) |
1855(10.16) |
3772(16.80) |
|
|
Mother |
||||
|
Age at 1st marriage in years (Mean ± SD) |
17.67±3.57 |
17.08±3.08 |
17.19±3.18 |
0.214 |
|
Age interval was 20-34 at first birth |
3155(75.17) |
13048(71.49) |
16203(72.18) |
<0.001 |
|
Had no formal education |
324(7.72) |
1978(10.84) |
2302(10.25) |
<0.001 |
|
Had knowledge sharing scope (≥1) |
4014(95.64) |
15787(86.50) |
19801(88.21) |
<0.001 |
|
Ever had child who later died |
282(6.72) |
1602(8.78) |
1884(8.39) |
<0.001 |
|
Faced any kind of domestic violence |
1037(24.71) |
5015(27.48) |
6052(26.96) |
<0.001 |
|
Child |
||||
|
Age in years (Mean ± SD) |
2.00±1.42 |
2.00±1.41 |
2.00±1.41 |
0.142 |
|
Height-for-age z-score |
-1.13±1.44 |
-1.33±1.33 |
-1.29±1.35 |
|
|
Weight-for-age z-score |
-0.99±1.21 |
-1.26±1.11 |
-1.21±1.14 |
|
|
Weight -for- Height z-score |
-0.49±1.27 |
-0.70±1.17 |
-0.66±1.18 |
|
|
Male sex |
2179(51.92) |
9438(51.71) |
11617(51.75) |
0.810 |
|
Birth interval |
|
|
|
<0.001 |
|
First birth |
1647(39.24) |
6446(35.32) |
8093(36.05) |
|
|
≤2 years |
503(11.98) |
2733(14.97) |
3236(14.42) |
|
|
>3 years |
2047(48.77) |
9072(49.71) |
11119(49.53) |
|
|
No twins |
4141(98.67) |
17968(98.45) |
22109(98.49) |
0.300 |
|
Had Diarrhea |
294(7.01) |
1257(6.89) |
1551(6.91) |
0.789 |
|
Had Cough |
944(22.49) |
3867(21.20) |
4811(21.44) |
0.065 |
|
Had picture/reading books |
1366(32.55) |
4758(26.07) |
6124(27.28) |
<0.001 |
Table 1 presents the socio-demographic characteristics of children from urban and rural settings of Bangladesh. In this study, nearly two out of ten children were from urban areas. For household characteristics, the mean age of fathers and the standard deviation (SD) were similar across both urban and rural areas. When comparing the two settings, a higher percentage of fathers in rural areas had completed education beyond primary school 22.61% compared to urban fathers. In terms of family size, 55.23% of urban families had more than three members, while 61.24% of rural families fell into this category. Regarding the number of children under five years old, 23.71% of urban households had more than one, compared to 27.34% in rural areas. The presence of a cooking area inside the main house was more common in urban areas 55.06% than rural areas 30.82%. According to the wealth quintile, 45.68% of the richest individuals lived in urban areas, whereas the poorest 28.44% resided in rural areas. For maternal characteristics, the mean age at first marriage was nearly 17 years for mothers in both urban and rural areas. In terms of education, a higher proportion of mothers in both urban 92.28% and rural 89.16% areas had completed education beyond primary school compared to fathers. Moreover, 95.64% of urban mothers had access to at least one source of knowledge, compared to 86.50% of rural mothers. Concerning maternal health, child mortality rates and exposure to domestic violence were higher in rural areas 8.78% compared to urban areas 6.72% and for domestic violence 27.48% in rural vs. 24.71% in urban. In the children’s characteristics section, the overall mean age of children was 2 years, with a slightly higher proportion of males 51.75% than females 48.25%. Regarding morbidity, diarrhea and cough rates were higher in urban areas 7.01% vs. 6.91% for diarrhea and 22.49% vs. 21.20% for cough compared to rural areas. However, a notable difference was observed in the availability of reading materials or picture books for children, with rural households having significantly higher access 73.93% compared to urban households 67.45%.
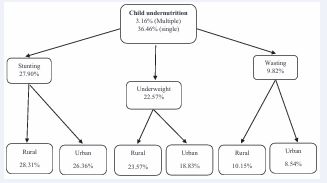
Figure 2 Area-wise child undernutrition
Figure 2 shows that 3.16% of children experienced multiple forms of undernutrition, with stunting, underweight, and wasting occurring simultaneously in the same child. Additionally, the overall prevalence of at least one form of undernutrition, stunting, underweight, or wasting, was 36.46%.
In the selected sample, the prevalence rates for stunting, underweight, and wasting were 27.90%, 22.57%, and 9.82%, respectively. When comparing rural and urban areas, the prevalence of stunting, underweight, and wasting was higher in rural areas than in urban areas.
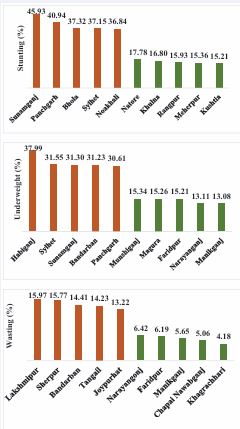
Figure 3 Five (5) districts of stunting, underweight and wasting in highest and lowest position.
In Figure 3, among the 64 districts, stunting and underweight rates remained highest in the north-eastern districts of Sunamganj 45.93% and Habiganj 37.99%, respectively. In contrast, the south-eastern district of Lakshmipur had the highest rate of wasting at 14.97%. On the other hand, Kushtia 15.21%, Manikganj 13.08%, and Khagrachhari 4.18% recorded the lowest rates for stunting, underweight, and wasting, respectively. However, no district was completely free from undernutrition.
Table 2. Associated determinants of childhood stunting, underweight, and wasting
|
Indicators |
Stunted |
Underweighted |
Wasted |
|||
|
COR (95%CI) |
AOR (95%CI) |
COR (95%CI) |
AOR (95%CI) |
COR (95%CI) |
AOR (95%CI) |
|
|
Father age |
1.00(0.99, 1.00) |
0.99(0.98, 0.99)c |
1.00(0.99-1.00) |
0.99(0.99-1.00)b |
1.01(1.00-1.01)a |
1.00(0.99-1.01) |
|
Father education (Ref.: Primary and above) |
|
|
|
|
||
|
Pre-primary or none |
1.67(1.55, 1.80)c |
1.18(1.08, 1.29)c |
1.59(1.47-1.72)c |
1.15(1.05-1.25)b |
1.25(1.12-1.40)c |
1.02(0.89-1.16) |
|
Religion (Ref.: Muslim) |
|
|
|
|
|
|
|
Non-Muslim |
1.08(0.97, 1.20) |
1.14(1.01, 1.28)a |
0.99(0.88-1.11) |
1.02(0.90-1.16) |
1.04(0.89-1.22) |
0.99(0.83-1.19) |
|
Ethnicity (Ref.: Other) |
|
|
|
|
|
|
|
Bengali |
0.85(0.64, 1.13) |
1.64(1.20, 2.25)b |
1.29(0.93-1.81) |
2.22(1.54-3.20) |
0.93(0.61-1.43) |
1.12(0.70-1.79) |
|
Number of family members (Ref.: >3) |
|
|
|
|
||
|
≤3 |
1.04(0.96, 1.14) |
1.15(1.01, 1.31)a |
1.01(0.92-1.11) |
1.12(0.97-1.28) |
0.93(0.81-1.06) |
1.03(0.85-1.25) |
|
Number of under five children (Ref.: 1) |
|
|
|
|
||
|
>1 |
1.21(1.13, 1.29)c |
1.19(1.10, 1.30)c |
1.16(1.08-1.24)c |
1.10(1.01-1.21)a |
1.08(0.97-1.19) |
1.07(0.95-1.22) |
|
Had (5-17) years old children (Ref.: No) |
|
|
|
|
||
|
Yes |
1.08(1.02, 1.15)a |
1.19(1.07, 1.31)b |
1.12(1.05-1.20)b |
1.14(1.02-1.27)c |
1.13(1.03-1.25)a |
1.04(0.89-1.21) |
|
Number of sleeping room (Ref.: >1) |
|
|
|
|
||
|
1 |
1.33(1.25, 1.42)c |
1.10(1.02, 1.19)b |
1.23(1.15- 1.32)c |
1.01(0.93-1.09) |
1.15(1.05-1.27)c |
1.06(0.95-1.19) |
|
Cooking place (Ref.: Outside of main house) |
|
|
|
|
||
|
In main house |
0.93(0.87, 0.99)a |
1.10(1.02, 1.19)a |
0.88(0.82-0.94)c |
1.14(1.05-1.23)b |
0.89(0.81-0.98)a |
1.03(0.92-1.16) |
|
Residential area (Ref.: Rural) |
|
|
|
|
||
|
Urban |
0.91(0.84, 0.98)b |
1.28(1.16, 1.40)c |
0.75(0.69-0.82)c |
1.06(0.96-1.17) |
0 .83(0.74-0.93)b |
0.96(0.84-1.11) |
|
Wealth quintile (Ref.: Richest) |
|
|
|
|
||
|
Richer |
1.24(1.12, 1.37)c |
1.29(1.14, 1.46)c |
1.48(1.32-1.65)c |
1.57(1.37-1.79)c |
1.07(0.92-1.25) |
1.07(0.89-1.29) |
|
Middle |
1.41(1.27, 1.56)c |
1.47(1.29, 1.67)c |
1.69(1.51-1.89)c |
1.76(1.53-2.02)c |
1.20(1.03-1.39)a |
1.22(1.01-1.47)a |
|
Poorer |
1.84(1.67, 2.03)a |
1.79(1.57, 2.04)c |
2.23(2.01-2.49)c |
2.17(1.88-2.50)c |
1.50(1.30-1.73)c |
1.47(1.21-1.78)c |
|
Poorest |
2.48(2.25, 2.72)c |
2.20(1.92, 2.51)c |
2.62(2.36-2.91)c |
2.36(2.04-2.73)c |
1.57(1.36-1.81)c |
1.51(1.24-1.83)c |
|
Mother |
|
|
|
|
|
|
|
Age at first marriage |
0.99(0.98, 1.00)a |
1.01(1.00, 1.03)a |
0.99(0.98-1.00)b |
1.01(1.00-1.02) |
0.98(0.97-1.00)a |
0.99(0.98-1.01) |
|
Age category at first birth (Ref.: 20-34 years) |
|
|
|
|
||
|
<20 & 35+ years |
1.16(1.08, 1.24)c |
1.22(1.13, 1.33)c |
1.11(1.03-1.19)c |
1.10(1.01-1.20)a |
0.99(0.90-1.10) |
1.04(0.92-1.17) |
|
Education (Ref.: Primary and above) |
|
|
|
|
||
|
Pre-primary or none |
1.95(1.78, 2.13)c |
1.34(1.20, 1.49)c |
1.85(1.68-2.03)c |
1.31(1.17-1.47)c |
1.41(1.23-1.61)c |
1.16(0.99-1.36) |
|
Knowledge sharing source (≥1) (Ref.: Yes) |
|
|
|
|
||
|
No |
1.64(1.50, 1.80)c |
1.13(1.02, 1.25)c |
1.62(1.48-1.79)c |
1.17(1.05-1.30)c |
1.18(1.03-1.36)a |
0.97(0.83-1.13) |
|
Ever had child who later died (Ref.: No) |
|
|
|
|
||
|
Yes |
1.47(1.33, 1.62)c |
1.18(1.05, 1.32)b |
1.42(1.28-1.58)c |
1.20(1.07-1.36)b |
1.40(1.21-1.62)c |
1.24(1.06-1.45)b |
|
Faced any kind of domestic violence (Ref.: No) |
|
|
|
|
||
|
Yes |
1.28(1.19, 1.36)c |
1.09(1.01, 1.17)a |
1.15(1.07-1.23)c |
0.97(0.90-1.05) |
0.99(0.90-1.10) |
0.92(0.83-1.03) |
|
Child |
|
|
|
|
|
|
|
Age (in years) |
1.07(1.05, 1.10)c |
1.56(1.12, 1.18)c |
1.11(1.09-1.14)c |
1.17(1.14-1.21)c |
0.99(0.96-1.03) |
0.99(0.96-1.04) |
|
Sex (Ref.: Female) |
|
|
|
|
|
|
|
Male |
1.01(0.95, 1.08) |
1.01(0.94, 1.07) |
0.98(0.92-1.05) |
0.99(0.92-1.06) |
1.15(1.05-1.26)b |
1.17(1.06-1.29)b |
|
Birth interval (Ref.: 2≤ years) |
|
|
|
|
||
|
≥ 3 years |
0.66(0.61, 0.72)c |
0.77(0.70, 0.86)c |
0.74(0.67-0.80)c |
0.85(0.77-0.95)b |
0.89(0.79-1.02) |
0.98(0.85-1.14) |
|
First birth |
0.66(0.60, 0.72)c |
0.80(0.71, 0.91)c |
0.70(0.64-0.77)c |
0.91(0.80-1.04) |
0.76(0.66-0.87)c |
0.92(0.77-1.12) |
|
Twins (Ref.: No) |
|
|
|
|
|
|
|
Yes |
1.55(1.23, 1.95)c |
1.44(1.10, 1.89)b |
1.76(1.39-2.22)c |
1.65(1.26-2.17)c |
1.39(1.00-1.94)a |
1.36(0.94-1.96) |
|
Diarrhea (Ref.: No) |
|
|
|
|
|
|
|
Yes |
1.11(0.99, 1.24) |
1.08(0.96, 1.23) |
1.34(1.19-1.51)c |
1.34(1.18-1.52)c |
1.21(1.02-1.42)a |
1.18(0.99-1.41) |
|
Cough (Ref.: No) |
|
|
|
|
|
|
|
Yes |
0.99(0.92, 1.07) |
1.04(0.96, 1.13) |
1.01(0.94-1.09) |
1.06(0.97-1.15) |
1.06(0.95-1.18) |
1.03(0.92-1.15) |
|
Picture/reading books (Ref.: Yes) |
|
|
|
|
|
|
|
No |
1.46(1.36, 1.56)c |
1.53(1.40, 1.68)c |
1.27(1.18-1.37)c |
1.40(1.28-1.54)c |
1.18(1.06-1.31)b |
1.03(0.91-1.18) |
Note: a<0.05, b<0.01, and c<0.001
Table 2 outlines the factors significantly associated with stunting, underweight and wasting in children under five years old, after adjusting for various variables. These include the father’s age and education, as well as the child’s religion, ethnicity, and the number of children under five and those aged 5-17 years in the household. Additional factors include the number of sleeping rooms, total family members, cooking location, residential area,wealth quintile, mother’s age at first marriage and first birth, maternal education, access to at least one source of knowledge, exposure to domestic violence, history of child mortality, the child’s age, birth interval, twins, and the availability of picture books or reading materials for the child. The adjusted associations between various factors and underweight status in children under five years old.Significant predictors include paternal age and education, maternal age at first birth and education, ethnicity, household composition (number of children under five and those aged 5-17 years), cooking location, wealth quintile, access to health-related knowledge, history of child mortality, and child-specific factors such as age, birth interval, presence of twins, diarrhea incidence, and availability of picture books or reading materials. Children with fathers who had no formal education were more frequently underweight compared to those with educated fathers (aOR: 1.15, 95% CI: 1.05-1.25; p < 0.01), and a similar association was observed for maternal education (aOR: 1.31, 95% CI: 1.17-1.47; p < 0.001). Cooking inside the main house was associated with higher underweight rates than cooking outdoors (aOR: 1.14, 95% CI: 1.05 1.23; p < 0.01). Children from the poorest households had higher odds of being underweight compared to those from the richest families (aOR: 2.36, 95% CI: 2.04-2.73; p < 0.001). Maternal age at first birth also played a role, with children born to mothers younger than 20 or older than 35 years showing higher underweight rates compared to those born to mothers aged 20-34 years (aOR: 1.10, 95% CI: 1.01-1.20; p < 0.05). Twins had higher underweight rates than singletons (aOR: 1.65, 95% CI: 1.26-2.17; p < 0.001). Children who had experienced diarrhea were more frequently underweight (aOR: 1.34, 95% CI: 1.18 1.52; p < 0.001). Furthermore, children from households without picture books or reading materials had higher odds of being underweight than those with access to such materials (aOR: 1.40, 95% CI: 1.28-1.54; p < 0.001). After adjusting for various factors, the significantly associated variables with childhood wasting were household wealth quintile, history of child mortality, and child sex. In terms of wealth quintile, children from middle-class families had 1.22 times higher odds of being wasted compared to those from the richest families (aOR: 1.22, 95% CI: 1.01-1.47; p < 0.05). In poorer families, the odds of wasting were 1.47 times higher than in the richest families (aOR: 1.47, 95% CI: 1.21-1.78; p < 0.001), and in the poorest families, the odds of wasting were 1.51 times higher (aOR: 1.51, 95% CI: 1.24-1.83; p < 0.001). No significant association was observed with wasting in the richer wealth class. A history of child mortality was associated with 1.24 times higher odds of childhood wasting (aOR: 1.24, 95% CI: 1.06-1.45; p < 0.01). Regarding sex, male children were more likely to experience wasting, with 1.17 times higher odds compared to female children (aOR: 1.17, 95% CI: 1.06-1.29; p < 0.01).
DISCUSSION
Bangladesh, like many developing countries, faces a significant burden of child undernutrition, with both single and multiple forms prevalent. In this study, 3.2% of children had multiple forms, and 36.5% had at least one form of undernutrition. These findings align with results reported in other settings [19]. MICS6 reported stunting at 27.9%, underweight at 22.6%, and wasting at 9.8%, while BDHS 2022 showed similar trends with 24% stunting, 22% underweight, and 11% wasting [20]. In South Asia, the prevalence of stunting, underweight, and wasting has been reported at 30.7%, 27.4%, and 14.1%, respectively, where in Nepal, the national average prevalence of underweight is 37% [21]. Our study highlighted area-wise disparities in undernutrition among under-five children, revealing higher rates in rural areas compared to urban areas. This finding aligns with evidence from other low- and middle income countries, which also report greater burdens of severe acute malnutrition in rural populations [22]. Despite higher overall malnutrition rates in rural areas, the analysis showed that children in urban settings were more likely to be stunted aOR: 1.28 (1.16-1.40), indicating that residential area served as an effect modifier in the association with stunting [23]. Parental formal education was more prevalent and showed a stronger association in urban areas compared to rural areas. Among stunted children, the odds of having a formally educated father were aOR: 1.18 (1.08-1.29), while for underweight children, the odds were aOR: 1.15 (1.05-1.25) [24]. Research on child undernutrition had shown that higher levels of parental education were linked to reduced rates of stunting and underweight among children. This relationship was found to be stronger in urban areas, indicating that parental education has a more substantial influence on child health outcomes in urban areas compared to rural ones [4-25]. The prevalence of nuclear families (families with ≤3 members) was higher in urban areas (17%) compared to rural areas (12%). Additionally, living in a nuclear family was identified as an independent predictor of stunting in children [26]. The prevalence of families with more than one child under five was higher in rural areas, and this factor was associated with childhood stunting and underweight [27]. In urban settings, 55% of households reported cooking inside the main house. Indoor cooking emerged as an independent predictor of childhood stunting and underweight, aligning with findings from Bangladesh [28], and India [29]. In all aspects of nutritional status (stunting, underweight, and wasting), household socio-economic status, particularly wealth quintile, was a significant independent predictor of undernutrition. In rural areas, there was a decreasing trend in percentage from the poorest to the richest quintile, whereas in urban areas, the trend showed an increase [30,31]. The scope of knowledge sharing (with at least one source) was higher among mothers in urban areas compared to those in rural areas. This higher knowledge-sharing scope was found to be associated with determinants of stunting and underweight in children [32]. The death of a child later in life was reported in 9% of rural areas and 7% of urban areas. This factor was independently associated with multiple forms of undernutrition [33]. Domestic violence was more prevalent in rural areas and was found to be associated with childhood stunting [34]. In the Sylhet Division, particularly in the northeastern area [35], two districts, Sunamganj (46%) and Habiganj (38%), showed a high prevalence of stunting and underweight [36]. In this study, the prevalence of infections, including cough and diarrhea, was higher in urban areas, with diarrhea being associated with undernutrition in children aOR: 1.34 (1.18-1.52), highlighting the need to focus on infectious diseases in the context of undernutrition. Additionally, the study found that diarrhea is linked to childhood undernutrition in rural settings of Bangladesh [37]. In this study, a consistent finding was observed for wasted children, with male wasting being associated with specific determinants aOR: 1.17 (1.06-1.29) [16]. In comparison to other studies, this research observed a notable decrease in the rates of underweight and wasting; however, the prevalence of stunting remains a significant concer [38]. We identified several key factors associated with child undernutrition, which were found to be different from those in other studies [39-41]. Several contextual factors, including the father’s age, religion, ethnicity, number of under-five and school-aged children in the household, number of sleeping rooms, total family size, indoor cooking practices, access to information, exposure to domestic violence, history of maternal child loss, and the presence of children’s pictures or reading materials, may influence child undernutrition. These multidimensional determinants underscore the complex interplay of household, social, and environmental factors, warranting further investigation in future studies.
STRENGTHS AND LIMITATIONS
The strength of this study was the use of a nationally representative sample, with data collected from all 64 districts through a partnership between the Bangladesh Bureau of Statistics (BBS) and UNICEF Bangladesh. This large sample size allowed for a robust estimation of the effects of undernutrition. Additionally, the study has several limitations. The dataset lacks information on several important variables, such as the measurement of mid-upper arm circumference for both children and mothers, children’s mobility patterns, household income and expenditure, and parental occupations. Furthermore, certain relevant variables, including birth size, pre- and postnatal visits, duration of breastfeeding, and place of delivery, were excluded from the analysis due to significant missing data. However, since the study utilized secondary data, it was not possible to examine certain factors that were not included in the dataset.
CONCLUSIONS
Despite numerous advancements in public health, malnutrition basically undernutrition continues to pose a significant barrier to the achievement of the 2030 Sustainable Development Goals (SDGs). The challenges have been compounded by the COVID-19 pandemic, which disrupted food systems, health services, and economic stability worldwide. Furthermore, the ongoing impacts of climate change, such as erratic weather patterns, droughts, and floods, have worsened food insecurity and undernutrition, particularly in vulnerable populations. Achieving the SDGs related to nutrition, health, and poverty reduction has become even more urgent and complex in the wake of these crises. However, there is still hope. To overcome the public health challenges posed by maternal and child undernutrition, a united approach is essential. The concerted efforts of governments, non governmental organizations, and international agencies are crucial to addressing the root causes of undernutrition. Through collaborative action, investments in healthcare infrastructure, enhanced food security initiatives, and sustainable development practices, these organizations can play a key role in alleviating the burden of undernutrition and working toward the realization of the SDGs. The consequences of undernutrition should be a significant concern for policymakers in Bangladesh.
ACKNOWLEDGEMENTS
The authors would like to thank UNICEF for granting permission to use the data.
ETHICS
The MICS study adheres to UNICEF’s ethical standards for research, evaluation, data collection, and analysis and includes a record of an ethics review. It is designed to protect and respect human and child rights in all research, evaluation, and data collection processes conducted or commissioned by UNICEF.
AVAILABILITY OF DATA
The data are available in a public, open-access repository.
REFERENCES
- Khanam SJ, Haque MA. Prevalence and determinants of malnutrition among primary school going children in the haor areas of Kishoreganj district of Bangladesh. Heliyon. 2021; 7: e08077.
- UNICEF, LEVELS AND TRENDS IN CHILD MALNUTRITION. 2020.
- Nisbett N, Davis P, Yosef S, Akthar N. Bangladesh’s story of change in nutrition: Strong improvements in basic and underlying determinants with an unfinished agenda for direct community level support. Global Food Security. 2017; 13: 21-29.
- Nahar MZ, Zahangir MS. The role of parental education and occupation on undernutrition among children under five in Bangladesh: A rural- urban comparison. PLoS One. 2024; 19: e0307257.
- Guha S, Das S, Baffour B, Chandra H. Multivariate small area modelling of undernutrition prevalence among under-five children in Bangladesh. Int J Biostat. 2022; 19: 191-215.
- Mostafa KS. Socio-economic determinants of severe and moderate stunting among under-five children of rural Bangladesh. Malays J Nutr. 2011; 17: 105-118.
- Sen LC, Ahmed S, Touhiduzzaman AS, Mandal S, Ahmed AT, Das SK, et al. Nutritional status of under-five children in rural Bangladesh. Int J Public Health. 2020; 9: 205-210.
- BDHS, Bangladesh Demographic and Health Survey 2022. National Institute of Population Research and Training, Medical Education and Family Welfare Division, Ministry of Health and Family Welfare Dhaka, Bangladesh, The DHS Program ICF Rockville, Maryland, USA. 2022.
- Haque MA, Choudhury N, Farzana FD, Ali M, Raihan MJ, Ahmed SMT, et al. Determinants of maternal low mid-upper arm circumference and its association with child nutritional status among poor and very poor households in rural Bangladesh. Matern Child Nutr. 2021; 17: e13217.
- Hossain S, Chowdhary PB, Biswas RK, Hossain A. Malnutrition status of children under 5 years in Bangladesh: A sociodemographic assessment. Children and Youth Services Review, 2020; 117: 105291.
- Islam M, Islam MT, Noor FM. Determinants of Malnutrition among Under-Five Children in Bangladesh: Evidence from Multiple Indicator Cluster Survey, 2019 Data. 2022; 5: 284-295.
- Rahman MS, Mushfiquee M, Masud MS, Howlader T. Association between malnutrition and anemia in under-five children and women of reproductive age: Evidence from Bangladesh Demographic and Health Survey 2011. PLoS One. 2019; 14: e0219170.
- Alam MZ, Islam MS. Is there any association between undesired children and health status of under-five children? Analysis of a nationally representative sample from Bangladesh. BMC Pediatr. 2022; 22: 445.
- Ahmed T, Ahmed AM. Reducing the burden of malnutrition in Bangladesh. BMJ. 2009; 339: b4490.
- Anik AI, Chowdhury MRK, Khan HTA, Mondal MNI, Perera NKP, Kader M. Urban-rural differences in the associated factors of severe under-5 child undernutrition based on the composite index of severe anthropometric failure (CISAF) in Bangladesh. BMC Public Health. 2021; 21: 2147.
- Ferdous F, Das SK, Ahmed S, Farzana FD, Latham JR, Chisti MJ, et al. Severity of diarrhea and malnutrition among under five-year-old children in rural Bangladesh. Am J Trop Med Hyg. 2013; 89: 223-228.
- Islam MR, Rahman MS, Rahman MM, Nomura S, de Silva A, Lanerolle P, et al. Reducing childhood malnutrition in Bangladesh: the importanceof addressing socio-economic inequalities. Public Health Nutr. 2020; 23: 72-82.
- Badhan TH, Zahangir MS, Hoq MN. Determinants of stunting among children under 5 years in Bangladesh: a quantile regression analysis. J Hum Nutr Diet. 2025; 38: e13383.
- Rahman MS, Ali M, Ahmed NAMF. Contributing Factors to Under-Five Child Malnutrition in Rural Bangladesh. Juniper Publishers Juniper Online J Case Studies. 2017; 4: 1-4.
- Chowdhury MRK, Khan HTA, Rashid M, Kabir R, Islam S, Kader M. Differences in risk factors associated with single and multiple concurrent forms of undernutrition (stunting, wasting or underweight) among children under 5 in Bangladesh: a nationally representative cross-sectional study. BMJ Open. 2021; 11: e052814.
- UNICEF. UNICEF-WHO-The World Bank: Joint Child Malnutrition Estimates (JME) — Levels and Trends. 2023.
- Fagbamigbe AF, Kandala NB, Uthman AO. Demystifying the factors associated with rural-urban gaps in severe acute malnutrition among under-five children in low- and middle-income countries: a decomposition analysis. Sci Rep. 2020; 10: 11172.
- Khan MMA, Billah MA, Fatima K, Islam MM, Sarker BK, Khanam SJ, et al. Child undernutrition and its association with household environmental conditions in Bangladesh. Public Health Nutr. 2024; 28: e3.
- Adhikari D, Khatri RB, Paudel YR, Poudyal AK. Factors Associated with Underweight among Under-Five Children in Eastern Nepal: Community-Based Cross-sectional Study. Front Public Health. 2017; 5: 350.
- Farooq U, Rafique MZ, Shah SM, The effects of mother education and intervening mechanisms on rural-urban child stunting: evidence from Pakistan. Revista Pan-Amazônica de Saúde, 2019; 10.
- Chowdhury TR, Chakrabarty S, Rakib M, Winn S, Bennie J. Risk factors for child stunting in Bangladesh: an analysis using MICS 2019 data. Arch Public Health. 2022; 80: 126.
- Bhowmik KR, Das S. On exploring and ranking risk factors of child malnutrition in Bangladesh using multiple classification analysis. BMC Nutr. 2017; 3: 73.
- Alam MB, Acharjee S, Mahmud SM, Tania JA, Ali Khan M, Islam MS, et al. Household air pollution from cooking fuels and its association with under-five mortality in Bangladesh. Clinical Epidemiology and Global Health. 2022; 17: 101134.
- Upadhyay AK, Singh A, Kumar K, Singh A. Impact of indoor air pollution from the use of solid fuels on the incidence of life threatening respiratory illnesses in children in India. BMC Public Health. 2015; 15: 300.
- Das S, Gulshan J. Different forms of malnutrition among under five children in Bangladesh: a cross sectional study on prevalence and determinants. BMC Nutrition, 2017; 3: 1.
- Hong R, Banta JE, Betancourt JA. Relationship between household wealth inequality and chronic childhood under-nutrition in Bangladesh. Int J Equity Health. 2006; 5: 15.
- Mohsena M, Mascie-Taylor CG, Goto R. Association between socio- economic status and childhood undernutrition in Bangladesh; a comparison of possession score and poverty index. Public Health Nutr. 2010; 13: 1498-1504.
- Hoddinott J, Ahmed I, Ahmed A, Roy S. Behavior change communication activities improve infant and young child nutrition knowledge and practice of neighboring non-participants in a cluster- randomized trial in rural Bangladesh. PLoS One. 2017; 12: e0179866.
- Das SK, Chisti MJ, Malek MA, Das J, Salam MA, Ahmed T, et al. Changing childhood malnutrition in Bangladesh: trends over the last two decades in urban-rural differentials (1993-2012). Public Health Nutr. 2015; 18: 1718-1727.
- Haque MA, Choudhury N, Ahmed SMT, Farzana FD, Ali M, Rahman SS, et al. Factors Associated with Domestic Violence in Rural Bangladesh. J Interpers Violence. 2022; 37: 1248-1269.
- Hasan MM, Uddin J, Pulok MH, Zaman N, Hajizadeh M. Socioeconomic Inequalities in Child Malnutrition in Bangladesh: Do They Differ by Region? Int J Environ Res Public Health. 2020; 17: 1079.
- Sanin KI, Khanam M, Rita RS, Haque MA, Ahmed T. Common factors influencing childhood undernutrition and their comparison between Sylhet, the most vulnerable region, and other parts of Bangladesh: Evidence from BDHS 2007-18 rounds. Front Nutr. 2023; 9: 999520.
- Rahman SMJ, Ahmed NAMF, Abedin MM, Ahammed B, Ali M,Rahman MJ, et al. Investigate the risk factors of stunting, wasting, and underweight among under-five Bangladeshi children and its prediction based on machine learning approach. PLoS One. 2021; 16: e0253172.
- Sumon IH, Hossain M, Ar Salan S, Kabir MA, Majumder AK. Determinants of coexisting forms of undernutrition among under- five children: Evidence from the Bangladesh demographic and health surveys. Food Sci Nutr. 2023; 11: 5258-5269.
- Rahman MT, Jahangir Alam M, Ahmed N, Roy DC, Sultana P. Trend of risk and correlates of under-five child undernutrition in Bangladesh: an analysis based on Bangladesh Demographic and Health Survey data, 2007-2017/2018. BMJ Open. 2023; 13: e070480.
- Chowdhury NR, Moname EJ, Azad GA, Hani U, Nazmin F, Farhana Ferdaus. Interplay Between Malnutrition and Infectious Diseases Insights from a Cross-Sectional Study in Bangladesh. Asia Pacific J Med Innovations. 2024; 1: 41-47.


