Sensitive FT-IR External and Internal Reflection Techniques for the Identification of Mineral Samples-potential Applications in Forensic Science
- 1. Department of Sciences, John Jay College of Criminal, USA
Abstract
The use of a nondestructive reflection technique to identify small mineral particles in the mid-infrared is reported. The results of this technique for six minerals are compared with those obtained via conventional diamond ATR spectroscopy on powdered samples from the same minerals. Although peak height variability is large, sufficient peak position wavelength reproducibility is demonstrated to indicate potential for forensic applications. In the second section of this study, the results using two different ATR configurations in the same FTIR accessory are compared. The first configuration used a triangular prism ATR element with a sampling area of approximately 1.5 mm diameter. The second configuration used a hemispherical ATR element with a sampling area of 0.5 mm diameter. Powdered samples were prepared from three mineral specimens: gypsum, malachite, and sodalite. Modifications were made to the accessory to reduce the amount of powder sample required. Although mineral samples were used in this study, the conclusions should be applicable to other powdered samples, both inorganic and organic.
In the third section, an instrumental change is made to increase sample pressure in an attempt to improve performance with softer samples. Also, sample preparation enhancements are made to study their effect on reproducibility.
Keywords
Fourier transform infrared spectroscopy; FT-IR spectroscopy; Reflection; Diffuse reflection; Specular reflection; Transflection; Attenuated total reflection; ATR.
CITATION
Koçak A (2020) Sensitive FT-IR External and Internal Reflection Techniques for the Identification of Mineral Samples-potential Applications in Forensic Science. Ann Forensic Res Anal 7(1): 1055.
INTRODUCTION
Minerals have constituted important forensic evidence used to link suspects to crime scenes for over a century. Minerals are also used in the manufacture of a variety of industrial and commercial products which may also constitute part of an investigation. Developing sensitive nondestructive techniques which can identify small amounts of sample are critical to such analyses.
There has been much interest in the use of reflection infrared spectroscopic methods [1,2] for the rapid, sensitive, and reliable detection of compounds of forensic interest [3,4] the two techniques used here are internal reflection, or, attenuated total reflection (ATR) and external reflection. In ATR the spectra obtained are affected by the depth of penetration of the evanescent wave which depends on the wavelength, the refractive index of the internal reflection element (IRE), the refractive index of the sample, and the angle of incidence [5]. In the external reflection spectroscopy used in this paper, the sample is deposited on a roughened metallic substrate [3]. The incident light reflects from the sample (diffuse or specular) or transmits through the sample onto the surface of the substrate from which it is diffusely reflected back through the sample (transflection). An additional component reflects from the substrate only and contributes to stray light. Reflection spectroscopy has been successfully used in the near infrared and introduced in mid-IR transflection to forensic work [3].
In this paper we introduce the qualitative use of reflection spectroscopy for the analysis of mineral samples in the mid infrared and compare this technique with conventional ATR spectroscopy on the same samples. Also, we compare different configurations of the ATR technique.
EXPERIMENTAL
Spectrometer
All spectra were taken with a Thermo/Nicolet NexusTM 670 FT IR spectrometer equipped with a DTGS detector and a standard KBr mid-IR beamsplitter and using Thermo/Nicolet OmnicTM Version 6.1 software. All spectra were run at 4000 to 400 cm-1 at a velocity of 0.6329 cms-1 using Happ-Genzel apodization, Mertz phase correction, and with no zero filling. The aperture was set to 100 (fully open). The gain was set to 4 for spectra taken with the Praying MantisTM and 8 for spectra taken with the MVP-Pro StarTM. The resolution was set to 4 cm-1. Spectra were derived from 64 co-added scans. A background spectrum was taken prior to each sample spectrum.
Spectra were converted to absorbance units and were baseline corrected using the OmnicTM software. Peak maxima and associated wavelengths were found using the OmnicTM “Analyze Find Peaks” function.
Accessory for External Reflection
The Harrick Praying MantisTM diffuse reflection accessory (DRP-NI8) was installed in the sample compartment of the FT IR spectrometer for collecting external reflection spectra. The standard sample holder of the Praying MantisTM was replaced with a special reflection substrate holder [3]. This holder allows any substrate to be easily and repeatably replaced in the same position. The sample itself is placed on the substrate.
The substrate disk is made of 316 stainless steel. Previous work has shown that this material is equivalent to 6061 aluminum in optical performance and superior in chemical resistance [3].
The disk is 9.1 mm in diameter and 2.7 mm thick. There is a centrally located spherical indentation in the top of the disk which is 0.51 mm deep and 2.9 mm in diameter. This recess is produced using a 4.8 mm ball end mill. The disk is then bead blasted to produce a diffusely reflecting finish.
Bead-blasting is accomplished using a special cabinet (Cyclone Manufacturing) operated at 75 psi compressed air pressure. Glass beads from the same company of 60 to 100 grit (254 to 122 μm diameter) are used in the cabinet. Samples are placed in the recess. The spherical geometry of the recess helps to center a particle sample placed in it.
Previous work has shown that the same substrate should be used for both background and sample scans [3]. Different disks have different diffuse reflectivities due to differences in the bead- blasted finishes. This results in sensitivity variations. The same work also shows that optimum baseline stability is maintained when the substrate disk is not removed between sample and background scans. That is, the ideal technique is to place the sample onto the disk after the background scan without removal of the disk from the holder. From a practical standpoint, however, placement of the particle on the disk while it is in the accessory proves difficult. For this reason, the substrate is removed after taking the background spectrum. The particle is placed in the recess of the substrate. The substrate is then returned to the accessory for the sample spectrum.
Accessory for Internal Reflection (ATR)
The Harrick MVP-Pro StarTM 45o single reflection diamond ATR accessory (MVS-NI8) was installed in the sample compartment of the FT-IR spectrometer for collecting internal reflection (ATR) spectra. A special powder sample cup was installed above the internal reflection element. The cup is 4.1 mm in diameter and has a depth of 2.5 mm. The resultant sample volume required is 33 mm3. This sample volume is equivalent to approximately 100 mg of the powdered samples used in this work. (By comparison, the particle samples used in the external reflection technique have a sample size of 0.4 to 17 mg.) The standard tip of the built-in pressure applicator of the accessory was replaced with a special cylindrical powder cup tip, whose diameter is slightly less than that of the sample cup. All ATR runs were conducted using the standard 56 oz-in pressure applicator, except for those conducted for the third section of this report which employed a special 72 oz-in version. The slip clutch assures that the same amount of pressure is exerted on each sample.
The standard diamond ATR cartridge was used in all three sections of this work. This cartridge uses a triangular prism ATR element with a sampling area of approximately 1.5 mm diameter. An alternate diamond ATR cartridge having a hemispherical ATR element with a sampling area of 0.5 mm diameter was also used for comparison in the second section of this work.
Samples
Seven mineral samples were obtained from Minerals Unlimited (Ridgecrest, CA): gypsum, malachite, sodalite, milky quartz, calcite and lazurite. All seven were used in the first section of this work. Only gypsum, malachite, and sodalite were used in the second and third sections. Three sand particles, with 1.0 to 1.6 mm sizes, were run in the first section by external reflection. These samples were author-collected from Oyster Bay, NY.
Sample preparation
For external reflection, samples were prepared by crushing between two 150 mm x 150 mm x 5 mm 316 polished stainless steel plates (McMaster-Carr). Five single particle samples were obtained from each of the seven minerals. Each particle had a size in the 0.7 to 2.0 mm range. The particle size was measured using a 2 mm stage micrometer with 10 μm divisions (Fisher Scientific) in a microscope with an illuminator and a graduated stage (Edmund Scientifics). The 10X objective of the microscope was used with its 10X eyepiece, yielding a 100X magnification. Micro forceps with 1 mm tips were used to manipulate the particles. The samples produced by this process were intended to represent as-is samples which could not be altered for analytical purposes such as those which might be obtained for forensic purposes.
Powdered samples to be analyzed by ATR in the first section of the report were further processed by grinding with a mortar and pestle and then filtered to -150 mesh size (smaller than 104 μm s) using 316 stainless steel woven wire cloth screen (McMaster-Carr). Five different powder samples were run from each of the minerals.
Previous work [6] showed that finer mesh sized screens, giving smaller particle size distributions, would produce higher packing densities and hence, higher sensitivities when used for ATR powder analysis. Such sizes would yield particle sizes under 102 to 15 μm, respectively.
These finer mesh sizes, however, make sample preparation extremely difficult in that obtaining a sufficient sample size is a very lengthy process. For this reason, the 150 mesh was chosen as the best compromise for both sample preparation ease and good sensitivity.
For the second section of this work, mineral powders for ATR analysis were prepared by a slightly modified process. After crushing between steel plates, the samples were reduced to a particle/powder consistency using a 1.4 kg ball-peen hammer and a steel percussion (Plattner’s) mortar and pestle (Humbolt Manufacturing), then brought to a fine powder using a standard mortar and pestle. Finally, the samples were filtered using a 75 mm diameter, 140 mesh sieve (W. S. Tyler) to produce particles smaller than 106 μm . Ten samples from each of the three minerals (gypsum, malachite, and sodalite) were run for each of the two diamond ATR configurations. For the third section of this work, powdered ATR samples were processed as described for the second section with the following exception. The 140 mesh samples were filtered with a 270- mesh sieve (W. S. Tyler). Particles that fell through, labeled “fine,” were smaller than 53 μm. Particles that were retained, labeled “coarse,” were 106 to 53 μm . Ten “coarse” and ten “fine” samples were run for each of the three minerals (gypsum, malachite, and sodalite).
RESULTS AND DISCUSSION
External vs Internal Reflectance
Identified external reflection particle and ATR powder peaks generally occur at different wavelength positions. The two data sets show different statistical analysis results. For example, the relative standard deviation (RSD) for absorbance peak heights for average of 5 runs is 54% for external reflection compared to only 7% for ATR. The RSD for peak position wavelengths is 0.42% for reflection and 0.05% for ATR. Finally, and perhaps less conclusively (see below), more peaks are identified with the reflection data, the absorbance values appear to be approximately 1.4 times those of ATR, and peaks are identified in a shorter wavelength region. The above differences are exemplified in Figures 1 [1,2],
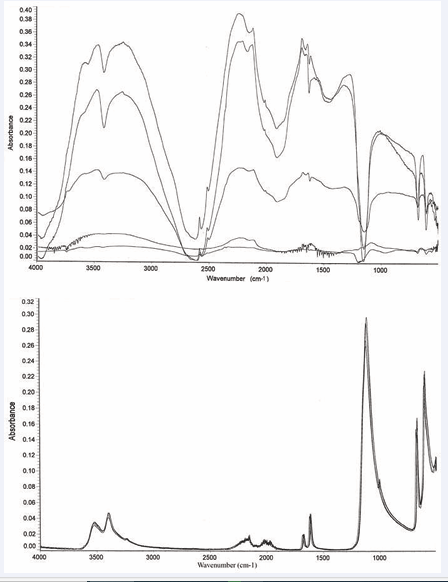
Figure 1: Five gypsum (CaSO4.2H2O) reflection particle spectra and Five gypsum (CaSO4.2H2O) ATR powder spectra.
which present spectra obtained for gypsum by the reflection and ATR techniques, respectively. The reflection data also exhibit more subtle effects when compared to the ATR data. In some cases, peaks have different shapes or relative intensities. Sodalite is a good example. See Figures 2 [3,4]. Gypsum and lazurite also exhibit this behavior to a lesser extent. Finally, the reflection data frequently indicate the presence of –OH, even in cases where no such groups are indicated by the molecular formula.
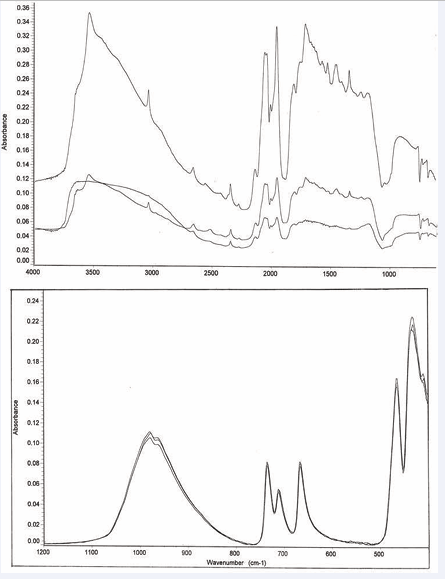
Figure 2: Three sodalite (Na8Cl2Al6Si6O24) reflection spectra and three sodalite (Na8Cl2Al6Si6O24) ATR powder spectra.
One of the largest differences in the two techniques is variation in peak height. For the ATR powder approach, the principal cause of variation is the difference in particle packing efficiency in the effective pathlength volume [5,6] an effect which is relatively small. The random physical orientation of particles averages any spectral differences due to crystal orientation. The use of multiple particles from a well-mixed bulk sample also makes the effects of any impurities uniform. For example, the quartz and lazurite samples used in this study contain limonite (FeO (OH).nH2O) and limestone (CaCO3), respectively. Yet the ATR RSD figures for both are similar to other minerals. With the reflection technique, however, impurities, contaminants, and birefringence can be major causes. Another contributor to the reflection variation is variation in stray light. The particles are typically smaller than the 1.5 mm beam size projected on the sample/substrate. Since the particles differ in size, stray light contributions will also differ. Finally, with the size of particles analyzed, the major component of light collected from the particle is conventional diffuse reflection. Differences in particle finish and orientation, size, and shape lead to more or less specular reflection, which is largely rejected by the optical design. With ATR spectra, peak heights are generally attenuated at shorter wavelengths and enhanced at longer wavelengths, when compared with transmission and reflection techniques, since the depth of penetration is proportional to wavelength [7].
Despite the drawbacks encountered, the external reflection technique still offers a viable analytical tool for relatively nondestructive analysis of single small particles. Such requirements preclude the use of dilution [8,9] or silicon carbide [10] diffuse reflection techniques. No sample preparation is required, and the necessary modifications made to the standard equipment are small and simple. Although variations in peak heights occur, as do occasional anomalies, wavelength positions are fairly reproducible so that identifications of unknowns are possible. Such identifications would be assisted by the comparison of unknowns with a library of spectra of previously identified samples. Although the method has not been discussed in various applicable review sources [11-16] it should prove useful in obtaining investigative data in forensic and archaeological [17] applications.
Due to the previously discussed attenuation of ATR peaks at shorter wavelengths compared to transmission and reflection techniques, external reflection is particularly sensitive to the hydroxyl groups present in some minerals, showing relatively strong peaks in the 3700 to 3500 cm-1 and 3200 to 2800 cm-1 regions [18]. In fact, the technique is also very sensitive to adsorbed water, even in minerals which do not have such groups in their formulas [19]. For the same reason, reflection should prove particularly useful for the detection of organics by monitoring the –CH stretch at 2900 to 2800 cm-1[20]. It would be a relatively easy task to distinguish an organic particle, perhaps an illicit drug, from sand (see Figure 3 [5]) or oil-bearing clay from some barren ore.
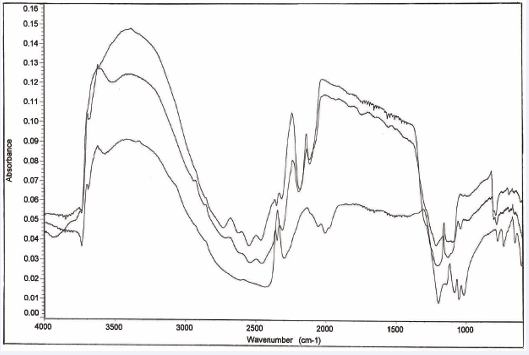
Figure 3: Reflection spectra of three sand particles from Oyster Bay, Long Island.
Reproducibility of Mineral Spectra using Alternate Single Reflection Diamond ATR Configurations
General results for all minerals: The average of 10 spectra for gypsum, malachite and sodalite samples is compared using the prism and hemisphere configurations, Figures 4-6 [6-11] respectively.
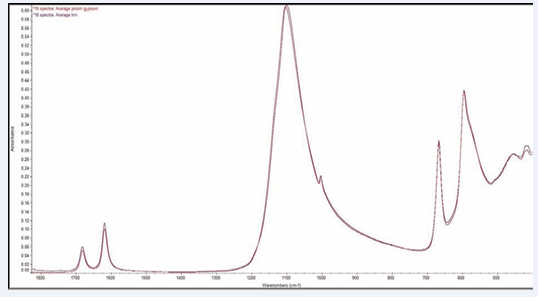
Figure 4: Ten gypsum (CaSO4.2H2O) spectra taken using a prism ATR element and a hemisphere ATR element.
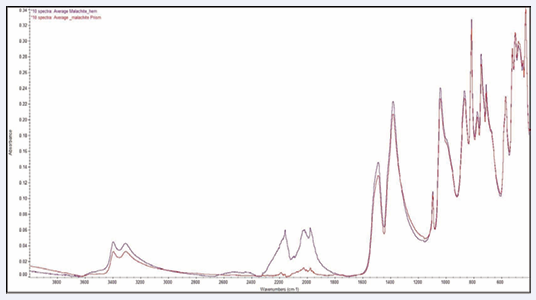
Figure 5: Ten malachite (Cu2(OH)2CO3) spectra taken using a prism ATR element and a hemisphere ATR element.

Figure 6: Ten sodalite (Na8Cl2Al6Si6O24) spectra taken using a prism ATR element and a hemisphere ATR element.
Average peak positions and intensities, along with associated standard deviations and relative standard deviations were compared for the prism and hemisphere results. This analysis indicates that there is a significant difference in the precision of peak intensities for malachite and sodalite. In fact, the prism configuration provides approximately two times the precision when compared to the hemisphere configuration. This increase in precision is attributed to the larger sampling area of the prism configuration, which tends to better average the effects of particle size differences and packing in homogeneities.
Gypsum spectra, however, shows that the peak height precisions for the prism and hemisphere configurations are similar Figure 4 [6,7]. This result is attributed to the softness of gypsum compared to the other minerals. The soft gypsum material is better compressed in the crowned hemisphere configuration, thereby making the peak height precision equivalent to the wider sampling area prism, where lower pressures (and less contact) are expected. With the harder materials, malachite and sodalite, results are less sensitive to pressure, provided that an initial threshold amount is applied to compact the powder. Thereafter, the harder samples are essentially incompressible, so that applying more pressure will not yield any improvement.
The same individual results for the malachite and sodalite indicate that the precision is significantly higher when the prism configuration is used. Statistical analysis indicates that for both malachite and sodalite, the RSD figures using different techniques are significantly different, with 99% confidence.
Improving Mineral Spectra Reproducibility Using Single Reflection Diamond FTIR-ATR Spectroscopy
General results for all minerals: The average of 10 spectra for gypsum, malachite and sodalite samples are compared for coarse and fine samples, Figures 7,8,9 [12-17] respectively. Average peak positions and intensities, along with associated standard deviations and relative standard deviations were compared for both coarse and fine samples of three minerals gypsum, malachite and sodalite.
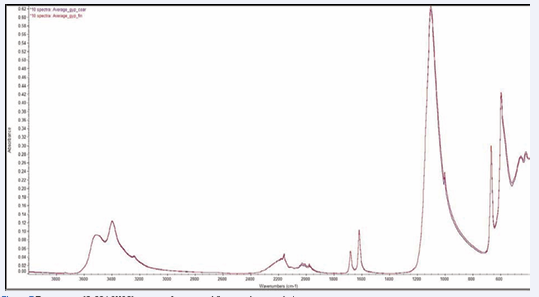
Figure 7: Ten gypsum (CaSO4.2H2O) spectra of coarse and fine powder granulation.
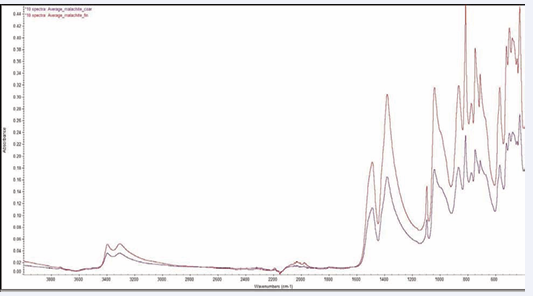
Figure 8: Ten malachite (Cu2(OH)2CO3) spectra of coarse and fine powder granulation.
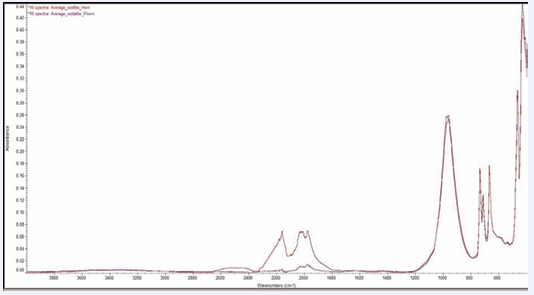
Figure 9: Ten sodalite (Na8Cl2Al6Si6O24) spectra of coarse and fine powder granulation.
The analysis indicates that there is a significant difference in the precision of peak intensities. Fine peak data are more precise. There seems a significant increase in absorbance values for fine peaks when compared to course. There also appears to be a small difference in the relative peak heights between fine and coarse particle results. With respect to precision in peak positions, the spectra of all three minerals (gypsum, malachite, and sodalite) are insensitive to particle size. Both malachite and sodalite also follow the general pattern in that there is a significant increase in the precision and intensities of absorbance values and a significant difference in relative peak heights in the fine particle results. Gypsum results appear relatively insensitive to particle size when absorbance precision, absorbance intensities, and relative peak height differences are examined. :
The Effect of Applied Pressure in Qualitative Analysis: There is no significant difference in wavelength relative standard deviation between the result obtained using 56 oz-in pressure (0.053 +/- 0.095%) and the results obtained using 72 oz-in pressure (0.070 +/- 0.108% for coarse particles and 0.042 +/- 0.081% for fine particles). Using greater pressure will not assist in qualitative analysis.
The Effect of Particle Size in Qualitative Analysis: The results indicate that wavelength position reproducibility is high enough to allow sample identification for both coarse and fine powders. Although some small differences in relative peak heights were observed between the two particle size categories, these would not be large enough to hinder such identifications. Hence, screening to fine particle sizes is probably unnecessary if only identification is required.
The Effect of Applied Pressure in Quantitative Analysis: In Table 1 [IX], the absorbance relative standard deviation results obtained on samples of - 140 mesh (less than 106 μm ) using 56 oz-in pressure are compared with those obtained for coarse and fine samples using 72 oz-in.
|
Table 1: Comparison of Absorbance Relative Standard Deviations Obtained at 56 oz-in and 72 oz-in of Pressure. |
|||
|
|
Absorbance Relative Standard Deviation (%) |
||
|
|
Previous1 (56 oz-in) |
Coarse (72 oz-in) |
Fine (72 oz-in) 367 |
|
Average (N = 25) |
4.86 +/- 1.62 |
5.54 +/- 1.20 (same) |
3.48 +/- 0.69 370 (different) |
|
Gypsum (N = 5) |
6.98 +/- 1.00 |
3.93 +/- 0.72 (different) |
4.26 +/- 0.67 373 (different) |
|
Malachite (N = 14) |
5.01 +/- 0.81 |
6.14 +/- 0.99 (different) |
3.18 +/- 0.52 376 (different) |
|
Sodalite (N = 6) |
2.74 +/- 0.30 |
5.46 +/- 0.53 (different) |
3.52 +/- 0.62 379 (different) |
Only with gypsum, a very soft mineral, was a definite improvement in precision obtained by using 72 oz-in pressure. The general insensitivity to increased pressure is consistent. Once a sample is packed, most minerals are too hard to be greatly affected by further pressure.
The effect of particle size in Quantitative Analysis: In general, finer particle samples will yield lower absorbance relative standard deviations than coarse samples. This is due predominantly to an increase in absorbance values, as standard deviations remain relatively constant. The smaller particles are more efficient in packing that volume which is sampled by the evanescent wave. Higher absorbance values result. Once again, however, gypsum, a very soft mineral, is an exception. No effect was observed in absorbance values, and hence relative standard deviations, with different apparent particle sizes. This result is probably due to problems in screening this soft and hygroscopic material. Note that only 12% of the gypsum stock material passed through the fine screen compared to 68 and 52% for malachite and sodalite, respectively. With gypsum, it is possible that the bulk of fine particles never passed through the fine screen and was retained and analyzed with the coarse material.
CONCLUSION
Alternate schemes have been proposed for the qualitative analysis of minerals. The external reflection technique requires no sample preparation and is non-destructive. It offers a very useful tool for identifying small samples of forensic interest. This technique also has the potential for application to the UV/visible and near-infrared regions of the spectrum. Such capability is extremely difficult to achieve with any ATR technique. If larger sample amounts (at least 100 mg) are available and destruction of the sample is permitted, then the ATR technique offers spectra with a more conventional appearance and greater reproducibility. Both the external reflection and ATR techniques described here are well suited for laboratories with modest budgets and time constraints.
REFERENCES
7. Harrick NJ. Internal Reflection Spectroscopy. Harrick Scientific, Ossining, NY, 1987.
11. Archaeological Chemistry. Speakman RJ, Popelka-Filcoff RS Eds. (ACS, Washington, DC, 2007).
15. Pye K. Geological and Soil Evidence, Forensic Applications. CRC Press. 2007.
16. Tibbett M, Carter DO. Soil Analysis in Forensic Taphonomy. CRC Press, 2008.


