Assessment of Glucose Homeostasis in Critically ill Children
- 1. Department of Pediatrics, Menoufia University, Egypt
Abstract
Background: Abnormal blood glucose concentration is the most common metabolic abnormality in childhood particularly in critically ill children. High blood glucose (BG) levels have shown an association with poor outcomes in critically ill patients.
Method: A cross-sectional study was carried on 100 critically ill infants and children admitted to the Pediatric Intensive Care Unit (PICU), Menoufia University Hospital diagnosed as critically ill according to WHO guidelines. Pediatric Sequential Organ Failure assessment Score (pSOFA) and Pediatric Risk of Mortality (PRISM) were performed for all patients. PICU stay, PRISM score, pSOFA score and death in PICU were outcomes of the research. All children included in the study subjected to blood glucose sampling at admission, at 24 hours and at 48 hours.
Results: Most of the studied patients had hypoglycemia (20%) and 22% had normal blood glucose level, while 58% had hyperglycemia. Statistically significant increase in hyperglycemia group than other groups regarding PICU stay, hospital stay, pSOFA score, PRISM score and death in PICU. Also statistically significant relation between mean glycemic lability index with PICU stay (p=0.025), PRISM score (p=0.019), pSOFA score (p=0.038) and death in PICU (p=0.041), which were increased among hyperglycemic patients followed by hypoglycemic patients than normal group. These outcomes were significantly increased with increased of glucose variability. Blood glucose is an independent and significant predictor of mortality among the studied patients with sensitivity (91.3%), specificity (85.7%), positive predictive value (68%) and negative predictive value (35%).
Conclusion: Blood glucose was significantly positive relation with hospital stay, PICU stay, PRISM score and pSOFA score. Mean glycemic lability index was related with PICU stay, PRISM score, pSOFA score and death in PICU, which were increased among hyperglycemic patients followed by hypoglycemic patients than normal group.
Keywords
• Critically ill children; Correlation; PRISM III; Psofa; Outcome
CITATION
Saleh NY, Tawfik MA Abouzouna ZS (2024) Assessment of Glucose Homeostasis in Critically ill Children. Ann Pediatr Child Health 12(1): 1329.
INTRODUCTION
In humans, plasma glucose concentrations are normally maintained within a narrow range throughout the day, usually between 70 and 100 mg dl. Maintenance of the plasma glucose concentration above some critical level is therefore essential to the survival of the brain. Consequently, a hemostasis system has evolved to avoid hypoglycemia and hyperglycemia. In this system, hormones are the most important regulators of glucose homeostasis [1]. Only insulin is capable of decreasing plasma glucose, insulin secretion is inhibited when plasma glucose falls below 70 mg/dl in order to forbid further reduction in plasma glucose. Glucose sensors in the hypothalamus initiate the secretion of counter-regulatory hormones involving cortisol, catecholamine, growth hormone and glucagon, in response to a further decrease in plasma glucose [2].
Hypoglycemia is defined as a blood glucose (BG) level of less than 60 mg/dL (3.3 mmol/L), while hyperglycemia is present when the BG level is greater than 126 mg/dL (7 mmol/L) [3]. Individuals with glucose variability have BG levels between those of hyperglycemia and hypoglycemia during the initial week of their PICU stay [4]. Abnormal BG levels are the most prevalent metabolic abnormality in critically ill children especially hypoglycemia as a result of a diverse range of illnesses. In resource-poor nations, hypoglycemia may be exacerbated by delayed hospital presentation, inadequate diagnostic facilities, poor nutritional status, and infectious diseases [5].
Hypoglycemia may occur due to gastroenteritis or fasting, but recurrent episodes nearly always indicate either an inborn error of metabolism, congenital hypopituitarism, or congenital hyperinsulinism. A list of common causes include prolonged fasting, diarrheal illness in young children especially rotavirus gastroenteritis, isolated growth hormone deficiency and hypopituitarism [6].
Hyperglycemia in the absence of diabetes may occur due to: 1) Dysfunction of the thyroid, adrenal, and pituitary glands 2) Numerous diseases of the pancreas 3) Severe increases in blood glucose may be seen in sepsis and certain infections 4) Encephalitis, brain tumors (especially those located near the pituitary gland), brain bleeds, and meningitis are prime examples. 5) Mild to high blood sugar levels are often seen in convulsions and terminal stages of many diseases. Prolonged, major surgeries can temporarily increase glucose levels. Certain forms of severe stress and physical trauma can increase levels for a brief time [7].
Critical illness defined as any severe problem with the airway, breathing or circulation, or acute deterioration of conscious state; includes apnea, upper airway obstruction, hypoxemia, central cyanosis, and severe respiratory distress, total inability to feed, shock, severe dehydration, active bleeding requiring transfusion, unconsciousness or seizures [8].
High BG levels have been linked in numerous studies to a less favorable prognosis among critically ill children [9]. Aggressive hyperglycemia management in critically ill children has generated controversy on account of the known dangers of hypoglycemia and its detrimental effects on the developing brain. A randomized controlled trial conducted by Vlasselaers in children revealed that focusing on euglycemia reduced mortality; however, this approach significantly increased the risk of hypoglycemia [10]. To assess the association between hypoglycemia, hyperglycemia, and glucose variability with mortality and morbidity among critically ill infants and children, we conducted a prospective study to evaluate the correlation between glucose homeostasis and outcomes in critically ill children and infants.
SUBJECT AND METHODS
Patients
A cross-sectional study was carried on 100 critically ill infants and children; their mean age was 50.28 ± 57.17 months admitted to the Pediatric intensive care unit, Menoufia University Hospital diagnosed as critically ill according to WHO guidelines [8] during the period study from November 2018 till October 2019. Patients were subdivided into three groups according to BG value at admission: Hyperglycemic group with BG more than 180 mg/dl, normoglycemia group with BG from 60 mg/dl to 125 mg/dl and hypoglycemia group; their BG level was less than 60 mg/dl.
Inclusion criteria: All infants and children who are critically ill and aged more than 1 month to less than 18 years admitted to the Pediatric intensive care unit and fulfilling criteria of critical illness according to WHO guidelines.
Exclusion criteria: Patients diagnosed as metabolic diseases for example inborn errors of metabolism, diabetes mellitus, or primary hypoglycemia and patients who received insulin.
Ethical consideration
This study was approved by the Regional Ethical Committee of Faculty of Medicine, Menoufia University and approval number was (3/2018 PEDI) and informed consent from patients and their guardians.
METHODS
All participants were subjected to:
Detailed history taking and clinical examination: Including Personal history name, age, sex, residence, and birth order, history of the present illness, chief complaint, past medical history, feeding history, birth and neonatal histories, family and immunization history. Full clinical examination including: Vital data (Heart Rate, Respiratory Rate, Blood pressure (BP) and temperature), Anthropometric measurements (Weight, Height or length, head circumference and Body mass index) , Complete systemic examination: Gastrointestinal, Chest, Cardiac and Neurological , Mode of oxygenation, and the categorization of the admitting diagnosis was based on the organ affected by the primary diagnosis.
Laboratory investigation: included complete blood count used Sysmex KX-21 automatized hematology analyzer (Sysmex Corporation, Japan). Serum C- reactive protein (CRP), platelet count and hemoglobin level (Hb) used Latex serology test. Liver function test used a bio chromatic (405- 510 nm) rate technique. Arterial blood gases, electrolytes, albumin, blood cultures, and serum creatinine.
Blood glucose measurement (BG): Values of BG samples were recorded at admission, at 24 hours and at 48 hours used an automated Sysmex KX-21 haematology analyzer was utilized to determine the BG (Sysmex Corporation, Japan).
Scores for severity assessment: Pediatric Sequential organ failure assessment (pSOFA) score was utilized to forecast morbidity. The pSOFA score has been recommended for triage during a mass influx of critically ill patients, but it requires laboratory measurement of 4 parameters, which may be impractical with constrained resources [11].
Pediatric Risk of Mortality (PRISM) score was developed from the Physiologic Stability Index (PSI) to reduce the number of physiologic variables required for pediatric intensive-care unit (PICU) mortality risk assessment, from 34 (in the PSI) to 14, and to obtain an objective weighting of the remaining variables. PRISM score has 17 physiologic variables subdivided into 26 ranges. The variables most predictive of mortality were minimum systolic blood pressure, abnormal pupillary reflexes, and stupor/ coma [12].
Sample size determination: A previous study [13], reported that anticipated prevalence of 70% for hyperglycemia (BG >126 mg/dL [7 mmol/L]) among critically ill children .The formula used to calculate it was N = (t2Ηp (1-p)) × m2. N denotes the necessary sample size. t = Level of confidence at 95 % (standard value of 1.96) .The estimated prevalence of hyperglycemia among children who are critically ill. m = Error margin at 5 % (standard value of 0.05). N divided by [1 + (N/Population)].We calculated that 100 subjects would be required to estimate the prevalence of 70% with 5% precision and achieve 80% power, assuming = 0.05. (0.8).
Statistical analysis: Utilizing SPSS v. 25 (SPSS Inc., Chicago, IL, USA) and MICROSOFT Excel 2017 on a personal computer, the results were tabulated and statistically analyzed. Statistical analysis was conducted utilizing the following descriptive measures: mean, standard deviation, and percentage (percent). The analytical methods consist of the t test, one-way ANOVA F test, and Pearson correlation. Receiver operating characteristics (ROC) analysis for blood glucose for mortality detection. A significance level of P below 0.05 was deemed to be statistically significant.
RESULTS
The basic characteristics of the studied groups are shown in Table 1.
Table 1: Demographic data of the studied patients.
|
Items |
Hyperglycemia (No=58) |
Hypoglycemia (No=20) |
Normoglycemia (No=22) |
F-test |
P-value |
|
Age / Months |
|
|
|
|
|
|
- Mean ± SD |
49.07±55.94 |
33.55±43.70 |
68.68±67.57 |
2.051 |
0.134 |
|
- Range |
1.50-204.00 |
2.00-168.00 |
2.00-180.00 |
|
|
|
|
P1= (0.293) , p2= (0.169) , p3= (0.047*) |
||||
|
Sex |
|
|
|
|
|
|
-Male |
36(62.07) |
12(60) |
9(40.91) |
X2 = 3.005 |
0.022* |
|
-Female |
22(37.93) |
8(40) |
13(59.09) |
|
|
|
Weight /Kg |
|
|
|
|
|
|
- Mean ± SD |
14.22±12.47 |
12.03±13.32 |
19.57±19.13 |
1.634 |
0.200 |
|
- Range |
3.00-65.00 |
3.00-65.00 |
3.00-65.00 |
|
|
|
|
P1= (0.556) , p2= (0. 139) , p3= (0.092) |
||||
|
?Height /cm |
|
|
|
|
|
|
- Mean ± SD |
90.45±31.75 |
82.80±29.35 |
98.73±38.03 |
1.242 |
0.293 |
|
- Range |
50.00-160.00 |
50.00-160.00 |
50.00-160.00 |
|
|
|
|
P1= (0.370) , p2= (0.316) ,p3 = (0. 119) |
||||
|
Body Mass Index |
|
|
|
|
|
|
- Mean ± SD |
15.07±4.69 |
15.67±6.69 |
15.59±5.14 |
.143 |
0.867 |
|
- Range |
7.50-34.50 |
8.80-35.50 |
9.30-25.39 |
|
|
|
|
P1= (0.655) , p2= (0.689) , p3= (0.960) |
||||
|
PICU stay/day |
|
|
|
|
|
|
- Mean ± SD |
11.64±7.48 |
11.55±9.58 |
8.64±5.73 |
1.315 |
0.273 |
|
- Range |
2-30 |
2-30 |
2-22 |
|
|
|
|
P1= (0 .965) ,p2 =(0.119) ,p3 = (0.218) |
||||
|
Hospital stay /day |
|
|
|
|
|
|
- Mean ± SD |
13.03±7.60 |
13.45±9.91 |
9.64±5.67 |
1.773 |
0.175 |
|
- Range |
3.00-30.00 |
3.00-30.00 |
2.00-22.00 |
|
|
|
|
P1= (0.837) , p2= (0.083) , p3= (0.115) |
||||
|
|
P1= (0.261) ,p2= (0.727) , p3= (0.508) |
||||
|
pSOFA score |
|
|
|
|
|
|
- Mean ± SD |
5.09±3.73 |
4.52±3.21 |
4.53±3.98 |
0.294 |
0.746 |
|
- Range |
.30-14.00 |
.20-9.70 |
.20-14.60 |
|
|
|
|
P1= (0.546) , p2= (0.541) ,p3= (0.991) |
||||
|
PRISM score |
|
|
|
|
|
|
- Mean ± SD |
11.46±14.85 |
15.26±23.65 |
12.65±18.15 |
0.347 |
0.707 |
|
- Range |
1.10-69.10 |
1.50-80.30 |
1.30-77.20 |
|
|
|
|
P1= (0.407) , p2= (0.788) ,p3= (0.632) |
||||
SD: standard Deviation; PICU: Pediatric intensive care unit; pSOFA: Pediatric Sequential Organ Failure assessment Score; PRISM: Pediatric Risk of Mortality; *significant; F test: ANOVA F test; P1: Comparison between Hyperglycemia and Hypoglycemia; P2: Comparison between Hyperglycemia and Normal; P3: Comparison between Hypoglycemia and Normal
A total of 100 critically ill infants and children admitted to the Pediatric intensive care unit, Menoufia University Hospital (58 % of them suffered from hyperglycemia versus hypoglycemia in 20% and 22% normoglycemic ) did not differ in any statistically significant ways with regard to age, weight, BMI , height, Pediatric intensive unite care stay, Hospital stay, PRISM, and pSOFA score .Young age was significantly greater in the hypoglycemic group than in the normal group (p= 0.047) and male predominance in all groups (p= 0.022).
Table 2 shown that means of hemoglobin,
Table 2: Laboratory characteristics of the studied groups.
|
Items |
Hyperglycemia (No=58) |
Hypoglycemia (No=20) |
Normoglycemia (No=22) |
F-test |
P-value |
|
Hemoglobin, g/dL Mean ± SD Range |
8.83±2.30 6.40-11.50 |
11.52±1.78 8.40-14.50 |
11.61±2.74 7.80-20.20 |
2.249 |
0.0491* |
|
|
P1= (0.255) , p2=(0.0179*) , p3=(0.890) |
||||
|
Platelets, 1000/ml Mean ± SD Range |
226.81±183.20 17.00- 351.00 |
356.85±226.2 99.00-954.00 |
378.64±152.33 129.00-674.00 |
3.673 |
0.0251* |
|
|
P1= (0.05*) , p2= (0.0270*) ,p3=(0.706) |
||||
|
WBC, 1000/ml Mean ± SD Range |
10.70±9.69 4.40-16.80 |
16.31±9.36 14.40-33.00 |
14.72±11.30 11.00-48.40 |
2.519 |
0.045* |
|
|
P1= (0.316) , p2=(0.684) ,p3=(0.608) |
||||
|
Albumin, g/dL Mean ± SD Range |
3.27±0.99 1.20-4.70 |
3.05±1.37 1.30-4.60 |
3.62±0.69 2.60-4.60 |
.446 |
0.644 |
|
|
P1= (0.686) , p2=(0 .449) ,p3=(0.382) |
||||
|
Creatinine, mg/dL Mean ± SD Range |
1.36±2.27 .20-10.50 |
0.84±1.27 .10-4.30 |
0.95±2.17 .20-9.90 |
.518 |
0.597 |
|
|
P1= (0.377) , p2=(0 .476) ,p3=(0.866) |
||||
|
CRP, mg/dL Mean ± SD Range |
50.14±69.51 0.10-318.00 |
35.80±60.39 0.30-240.00 |
37.82±39.78 0.50 -132.00 |
3.459 |
0.040* |
|
|
P1= (0.412) , p2=(0 .489) ,p3=(0.924) |
||||
|
Base - excess Mean ± SD Range |
-5.04±7.73 -28.00-9.60 |
-5.09±5.80 -19.10-6.70 |
-8.03±9.49 -23.90-12.60 |
1.171 |
0.315 |
|
|
P1= (0.981) , p2=(0 .140) ,p3=(0.263) |
||||
|
|
N (%) |
N (%) |
N (%) |
X2 |
P- Value |
|
Blood Culture
-Ve +ve
|
46 (79.31) 12 (18.69)
2 (3.45) 2 (3.45) 5 (8.62) 1 (1.72) 0 (0.00) 1 (1.72) 1 (1.72) |
17(85) 3(15)
1(5) 0(0) 1(5) 0(0) 1(5) 0(0) 0(0.00) |
21 (95.45) 1 (4..55)
0(0.00) 1 (4.55) 0(0.00) 0(0.00) 0(0.00) 0(0.0) 0(0.0) |
9.60 |
0.027* |
Hb: Hemoglobin, WBCS: White blood cells, CRP: C - reactive protein, * statistically significant
platelet levels and WBCs were significantly decreased among Hyperglycemia patients (8.83 ± 2.30, 226.81 ± 183.20 and 10.70 ± 9.69 respectively) than other groups. Also, C- reactive protein was significantly higher among Hyperglycemia patients (50.14 ± 69.51) than other groups, while albumin, creatinine, don’t show statistically significant differences between the groups. Also most of the studied groups had negative blood culture (79.31%, 85%, and 95.45%).
Our study revealed that there was statistically significant decrease in non- survivors versus survivors with regards age, weight, BMI (p=0.003,0.001,and 0.011 respectively).While there was statistically significant increase in non- survivors and survivors regarding hospital stay, PICU stay, C- reactive protein, SGOT, SGPT, PRISM and pSOFA score (p=0.007, 0.006, 0.004, 0.001, 0.016,0.003 and0.002) respectively. There were no statistically significant differences observed between survivors and non-survivors regarding other parameters (p>0.05) (Table 3).
Table 3: Comparison between Survivors and Non-Survivors regarding the studied variables.
|
Items |
Survivors N= 77 |
Non-Survivors N= 23 |
t-test |
P- Value |
|
Age |
67.71±75.51 |
45.65±50.83 |
9.270 |
0.003* |
|
Weight/ kg |
22.52±22.08 |
12.95±10.93 |
28.314 |
0.001* |
|
Height/ cm |
99.71±38.63 |
88.35±30.98 |
2.348 |
0.129 |
|
BMI |
17.97±6.44 |
14.60±4.60 |
6.748 |
0.011* |
|
Hospital Stay / day |
11.57±7.13 |
15.38±9.59 |
7.702 |
0.007* |
|
PICU stay/ day |
9.89±6.79 |
15.00±9.34 |
7.626 |
0.006* |
|
Hb, gm/dl |
11.81±1.98772 |
8.61±1.63 |
1.716 |
0.193 |
|
WBC, 1000/ml |
14.75±9.98 |
13.2914±9.99 |
.013 |
0.910 |
|
Platelets ,1000/ml |
358.09±182.04 |
292.05±195.30 |
.249 |
0.619 |
|
CRP, mg/dL |
34.48±60.31 |
78.98±56.93 |
.603 |
0.004 |
|
Blood glucose on admission |
132.85±61.81 |
148.95±50.62 |
3.364 |
0.070 |
|
Creatinine, mg/dL |
1.12±1.98 |
1.33±2.45 |
.350 |
0.556 |
|
Albumin, g/dL |
3.35±.99 |
3.16±.93 |
.015 |
0.903 |
|
PRISM score |
2.59±1.78 |
12.05±6.84 |
.036 |
0.003 |
|
SGOT |
72.46±91.36 |
105.89±84.51 |
88.0 |
0.001* |
|
SGPT |
44.29±52.22 |
76.29±92.99 |
6.051 |
0.016* |
|
pSOFA score |
3.42±2.43 |
10.27±2.15 |
11.173 |
0.002* |
BMI: Body Mass Index; PICU: Pediatric Intensive Care Unit; SGPT: Serum glutamic pyruvic transaminase; Hb: Hemoglobin WBC: White Blood cells; CRP: C- reactive protein; SGOT: Serum glutamic oxaloacetic transaminase pSOFA: Pediatric Sequential Organ Failure assessment Score; PRISM: Pediatric Risk of Mortality; SD: standard deviation; t: independent t test; * significant
Blood glucose variability according mean glucose index was shown in (Figure 1).
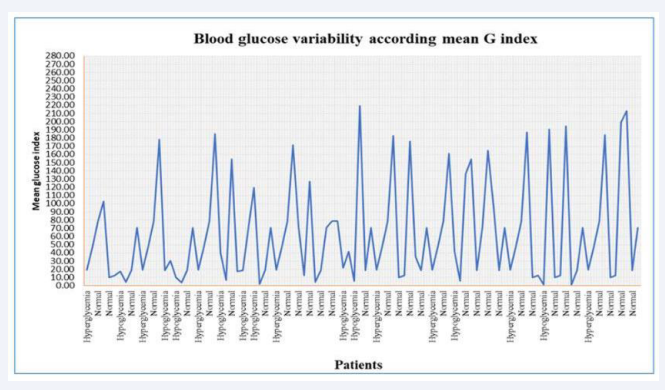
Figure 1: Blood glucose variability according mean G index 18004197900----1179283158.
Blood glucose was significantly positive correlated with hospital stay (p=0.370), PICU stay (p=0.012), PRISM (p=0.037) and pSOFA score (p =0.034), While there was no statistically significant correlation with other studied variables (Table 4).
Table 4: Correlation between blood glucose level and other variables.
|
|
Blood glucose level |
|
|
r |
P-value |
|
|
Age |
0.048 |
0.635 |
|
Sex, Male |
-0.153 |
0.128 |
|
Hospital stay/ day |
0. 590 |
0.370* |
|
PICU stay/ day |
0.750 |
0.012* |
|
Hb, gm/dl |
0.0179 |
0. 44 |
|
WBC, 1000/ml |
-0.075 |
0.457 |
|
Platelets , 1000/ml |
-0.068 |
0.500 |
|
CRP , mg/dl |
0.960 |
0.003* |
|
Creatinine, mg/dL |
0.056 |
0.612 |
|
PRISM score |
0.900 |
0.037* |
|
pSOFA score |
0.932 |
0.034 |
PICU: Pediatric Intensive Care Unit; Hb: Hemoglobin WBC: White Blood cells; CRP: C- reactive protein; PRISM: Pediatric Risk of Mortality; r: Pearson correlation
There was statistically significant relation between mean glycemic lability index with PICU stay (p=0.025), PRISM (p=0.019), pSOFA score (p=0.038) and death in PICU (p=0.041), which were increased among hyperglycemic patients followed by hypoglycemic patients than normal group. These outcomes were increased significantly with increased glucose variability (Table 5 & Figure 2).
Table 5: Mean glycemic lability index in relation to outcomes.
|
Outcomes |
Mean glycemic lability index |
F test |
P- Value |
||
|
Normoglycemia |
Hypoglycemia |
Hyperglycemia |
|||
|
PICU stay |
6.89±2.71 |
10.56±8.39 |
11.48±9.25 |
6.22 |
0.025* |
|
PRISM score |
5.61±3.11 |
12.67±8.99 |
14.35±18.84 |
8.31 |
0.019* |
|
pSOFA score |
4.17±3.22 |
5.13±3.94 |
6.55±3.19 |
KW=3.76 |
0.038* |
|
Death in PICU |
|
|
|
|
|
|
Survivor |
18(72%) |
44(77.19%) |
15(83.33%) |
X2= |
0.041* |
|
Non-survivor |
7(28%) |
13(22.81%) |
3(16.67%) |
2.94 |
|
Pediatric Intensive Care Unit; pSOFA: Pediatric Sequential Organ Failure assessment Score; PRISM: Pediatric Risk of Mortality; F test: ANOVA ;KW: Kruskal Wallis test ; X2:chi-square *significant
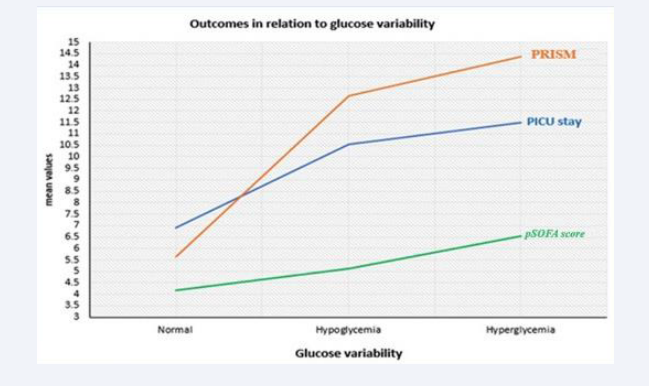
Figure 2: Outcomes in relation to glucose variability.
ROC analysis showed that the mean value of blood glucose (≥59.83 mg/dl) is an independent and signi?cant predictor of mortality among the studied patients (AUC = 0.747; P= 0.0001) with sensitivity (91.3%), speci?city (85.7%), positive predictive value (68%) and negative predictive value (35%) (Table 6 & Figure 3).
Table 6: ROC curve analysis for blood glucose level for mortality prediction.
|
|
Blood glucose level (mg/dl) |
|||||
|
Area |
Cutoff |
Sens. |
Spec. |
PPV |
NPP |
P value |
|
0.747 |
≥59.83 |
91.3% |
85.7% |
68.0% |
35% |
0. 0001* |
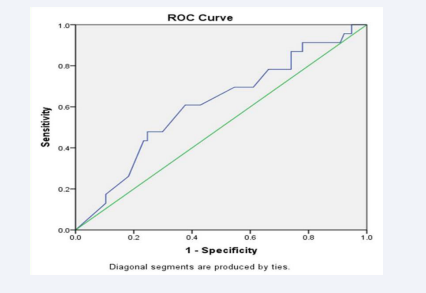
Figure 3: ROC curve analysis of blood glucose level for mortality prediction.
DISCUSSION
Abnormal blood glucose concentration is the most common metabolic abnormality in childhood particularly in critically ill pediatrics. Children are particularly prone to develop hypoglycemia in a wide variety of diseases. In resource poor countries, poor nutritional status, infectious diseases, delay in presentation to hospital, and the lack of diagnostic facilities may aggravate hypoglycemia (14).
The current research revealed male predominance (62.07%) in hyperglycemic group and (60.0%) in hypoglycemic group with mean age of children was 49.07 ± 55.94 for hyperglycemic group versus 33.55 ± 43.70 in hypoglycemic patients without statistically significant (P1= 0.293). Study by Hirshberg et al. [15], analyzed the BG in critically ill patients with alterations in glucose equilibrium: Males comprised 58.7% of the study participants, while 49% of the patients were older than 2 years.
There were no statistically significant differences seen in the weight, BMI, height, pediatric intensive care unit stay, hospital stay, PRISM Score and pSOFA score between the groups under study. Bhutia et al. [13], found in another study that most patients (70 %) were male. Their ages ranged from eighteen to eighty- four months.
In the present study, we found that mean of WBCs, platelet, and hemoglobin levels was significantly lower in patients with hyperglycemia, compared to other groups. Additionally, hyperglycemic patients had a significantly elevated C-reactive protein level on comparing to other groups. According to a study by El-Sherbini et al. [16], children in critical condition who had high blood glucose levels were more likely to experience hepatic and hematological dysfunctions. The majority of individuals included in this study’s analysis had blood cultures that came out negative. There were disparities between the groups under investigation’s blood culture.
Our study found statistically significant decrease in non- survivors than survivors in terms of age, weight, and BMI. However, there were statistically significant increase in non- survivors than survivors in terms of hospital stay, pediatric intensive care unit stay, C- reactive protein, PRISM, and pSOFA score. This result contradicted the findings of a research by Ana et al. [17], which found no statistically significant differences between survivors and non-survivors in relation to several characteristics. The disparity between the two studies can be explained by the use of different age groups and sample sizes.
In our study, blood glucose had significantly positive relation with hospital stay, PICU stay, PRISM score and pSOFA score while there was no statistically significant correlation with other parameters. Our findings concurred with those of El-Sherbini et al. [16], who discovered that hyperglycemia (BG > 180 mg/ dL) was substantially linked to death. These findings were also supported by a number of other researches. Yates et al. [21], Bhutia et al. [13], Hirshberg et al. [15], Preissig and Rigby [18], Gore et al. [19], & Faustino and Apkon [20], and Bagshaw et al., [22]. These results confirm the findings of Ballestero et al. [23],once more, although they deviate from the Patki and Chougule [24] report, where the PRISM score was just barely less than statistically significant.
A statistically significant relationship was found in the current study between the mean glycemic lability index and PICU stay, PRISM, pSOFA score, and death in the PICU. The hyperglycemic patients showed the highest increase in these variables, followed by the hypoglycemic patients. An increase in glucose variability was associated with a significant increase in these outcomes. Our findings concur with those of Naranje et al. [9], who discovered that patients with BG variability required longer stays in the intensive care unit (ICU) than patients without it.
Furthermore, Hirshberg et al. [15], discovered a correlation between hyperglycemia and a longer hospital stay. Our findings differed from those of El-Sherbini et al. [16], who did not discover a significant relationship between the duration of stay in the pediatric intensive care unit and the blood glucose level. This discrepancy may have been caused by the use of a different score to gauge the severity of the illness, different cutoffs, or different cohorts.
According to ROC analysis, among the patients under study, the mean blood glucose level (≥ 59.83 mg/dl) is an independent and significant predictor of death with sensitivity (91.3%), specificity (85.7%), positive predictive value (68%), and negative predictive value (35%). Peak blood glucose was shown to have high sensitivity (90%) and moderate specificity (67.5%) in the study by Patki and Chougule [24], whereas low blood glucose sensitivity (71.4%) and specificity (72.4%) were identified in another study by Branco et al. [25]. These discrepancies in the results could be the consequence of various study conditions, study criteria, and sample sizes that varied.
CONCLUSION
There was a substantial positive correlation found between blood glucose and PRISM score, pSOFA score, hospital stay, and PICU stay. The mean glycemic lability index was higher in hyperglycemic patients than in the normal group when it came to PICU stays, PRISM, pSOFA scores, and PICU death.
DATA AVAILABILITY
The datasets generated during and/or analyzed during the current study are available from the corresponding author on reasonable request.
ETHICAL CONSIDERATION
Informed written consent was obtained from all enrolled children’s parents after explaining all the study’s benefits and risks.
ACKNOWLEDGMENTS
Full thanks and appreciation to patients and their families who are very cooperative.
AUTHORS’ CONTRIBUTION
NYS: Shared in data interpretation and revision process and is the corresponding author. MAT: participated in data interpretation, study coordination, drafting and revision of the manuscript ZSA: participated in data interpretation, study coordination. All authors read and approved the final version of the manuscript
ETHICAL APPROVAL
The Institutional Review Board (IRB) of the Menoufia Faculty of Medicine approved the study. Research work was performed in accordance with the Declaration of Helsinki. Approval number was (3/2018 PEDI).
REFERENCE
- Güemes M, Rahman SA, Hussain K. What is normal blood glucose? Arch dis childhood. 2016; 101: 569-574.
- Saltiel AR. Insulin signaling in the control of glucose and lipid homeostasis. In Metabolic Control. Springer, Cham. 2015; 51-71.
- Khan SA, Ibrahim MN, Haque A. Frequency and mortality associated with hyperglycemia in critically Ill children. JCPSP. 2015; 25: 878.
- Krinsley JS, Chase JG, Gunst J, Martensson J, Schultz MJ, Taccone FS, et al. Continuous glucose monitoring in the ICU: clinical considerations and consensus. Crit care. 2017; 21: 197.
- Madrid L, Lanaspa M, Maculuve SA, Bassat Q. Malaria-associated hypoglycaemia in children. Expert Rev Anti Infect Ther. 2015; 13: 267-277.
- Saudubray JM, Garcia-Cazorla À. Inborn errors of metabolism overview: pathophysiology, manifestations, evaluation, and management. Pediatric Clin. 2018; 65: 179-208.
- Umpierrez G, Pasquel F. “Management of Inpatient Hyperglycemia and Diabetes in Older Adults”. Diabetes Care. 2017; 40: 509-517.
- WHO. Updated guideline: Paediatric emergency triage, assessment and treatment”. Geneva: World Health Organization; 2016.
- Naranje KM, Poddar B, Bhriguvanshi A, Lal R, Azim A, Singh RK, et al. Blood glucose variability and outcomes in critically ill children. Indian journal of critical care medicine: peer-reviewed, official publication of Indian Society of Critical Care Medicine. 2017; 21: 122.
- Vlasselaers D, Milants I, Desmet L, Wouters PJ, Vanhorebeek I, van den Heuel I, et al. “Intensive insulin therapy for patients in paediatric intensive care: A prospective, randomised controlled study”. Lancet. 2009; 373: 547-556.
- Grissom Colin, Brown Samuel, Kuttler Kathryn, Boltax Jonathan, Jones Jason, Jephson Al, et al. A modified sequential organ failure assessment score for critical care triage: Disaster Med Public Health Prep. 2010; 4: 277-284
- Robert L Chatburn; Eduardo Mireles-Cabodevila. Handbook of Respiratory Care (3rd ed). Jones & Bartlett Learning. 2010; 14.
- Bhutia TD, Lodha R, Kabra SK. Abnormalities in glucose homeostasis in critically ill children. Pediatr Crit Care Med. 2013; 14: 16-25
- Berghe G, Wouters P, Weekers F, Verwaest C, Bruyninckx F, Schetz M, et al. Intensive insulin therapy in critically ill patients. N Engl J Med. 2001; 345: 1359-1367.
- Hirshberg E, Larsen G, Van Duker H. Alterations in glucose homeostasis in the pediatric intensive care unit: Hyperglycemia and glucose variability are associated with increased mortality and morbidity. Pediatr Crit Care Med. 2008; 9: 361-366.
- El-Sherbini SA, Marzouk H, El-Sayed R, Hosam-ElDin S. Etiology of hyperglycemia in critically ill children and the impact of organ dysfunction. Revista Brasileira de terapia intensiva. 2018; 30: 286.
- Ana D Sekulic, Sladjana V Trpkovic, Aleksandar P Pavlovic, Olivera M. Marinkovic, and Aleksandra N Ilic. Scoring Systems in Assessing Survival of Critically Ill ICU Patients. Med Sci Monit. 2015; 21: 2621-2629.
- Preissig CM, Rigby MR. Hyperglycaemia results from beta- cell dysfunction in critically ill children with respiratory and cardiovascular failure: a prospective observational study. Critical Care. 2009a; 13: R27.
- Gore DC, Chinkes D, Heggers J, Herndon DN, Wolf SE, Desai M. Association of hyperglycemia with increased mortality after severe burn injury. J Trauma Acute Care Surg. 2001; 51: 540-544.
- Faustino EV, Apkon M. Persistent hyperglycemia in critically ill children. J Pediatr. 2005; 146: 30-34.
- Yates AR, Dyke 2nd PC, Taeed R, Hoffman TM, Hayes J, Feltes TF, Cua CL. Hyperglycemia is a marker for poor outcome in the postoperative pediatric cardiac patient. Pediatr Crit Care Med. 2006; 7: 351-355.
- Bagshaw SM, Egi M, George C, Bellomo R. Early blood glucose control and mortality in critically ill patients in Australia. Crit Care Med. 2009; 37: 463-470.
- Ballestero Y, López-Herce J, González R, Solana MJ, del Castillo J, Urbano J, et al. Relationship between hyperglycemia, hormone disturbances, and clinical evolution in severely hyperglycemic post- surgery critically ill children: an observational study. BMC endocrine disorders. 2014; 14: 25.
- Patki VK, Chougule SB. Hyperglycemia in critically ill children. Indian J Crit Care Med. 2014; 18: 8.
- Branco RG, Tasker RC. Glycemic level in mechanically ventilated children with bronchiolitis. Pediatr Crit Care Med. 2007; 8: 546-550.s


