Growth of General Body Dimensions in well-off NW Indians based on their Bone Age
- 1. Department of Anthropology, Panjab University, Chandigarh, India
ABSTRACT
Background: Among the reports based on the intimately related processes - Skeletal Maturation and physical growth only a few have assessed physical growth on the basis of skeletal maturation. In India only two published reports of such kind are available.
Aim: In this study, the attained means of Height (HT), Sitting Height (SH), Subischial Leg Length (SLL) and Weight (WT) of well-off NW Indian children and their tempo unconditional 1-year velocities based on their Radius, Ulna and the Short Bone Age (RUS BA) and the same based on their Chronological age are compared.
Subjects and Methods: The growth of the General Body Dimensions, namely Stature (HT), Sitting Height (SH), Subischial Leg Length (SLL), Weight (WT) together with Skeletal Maturation (TW2 Bone Ages through their hand-wrist X rays) of 1147 well-off NW Indian school children (564G and 583B) ranging in age between 6-16 years were studied. Out of these children 238girls and 242 boys were contacted again after one year and their progress in physical growth and skeletal maturity were studied. The attained means and tempo unconditional 1-year velocities were obtained for each yearly Chronological Age (CA) and Radius, Ulna and the Short Bone Age (RUS BA) group.
Results: The CA based attained mean curves showed typical growth pattern. However, the same on the basis of the RUS BA were different. By and large the boys’ attained means were larger throughout. Compared to those of the CA based 1-year velocities, the peaks of the same based on these children’s RUS BA were high, narrow, sharp and instantaneous – occurring at about 1-4 RUS BA years later.
Conclusion: This delay in the occurrence of the peaks in the velocity of the General Body Dimensions agrees with the higher tempo of Skeletal Maturity of these children. Another important feature of these RUS BA based growth 1-year velocity curves of the General Body Dimensions was that the girls showed the presence of the mid growth spurts.
KEYWORDS
- Radius
- Ulna and Short Bone Age
- Chronological Age
- Adolescent Spurt
- Mid Growth Spurt
- Tempo
- Age Centre
CITATION
Pathmanathan G (2024) Growth of General Body Dimensions in well-off NW Indians based on their Bone Age. Ann Public Health Res 11(2):1132
INTRODUCTION
Growth status of children is better related with skeletal maturation. Hence a child may be taller/shorter than the chronological age peers simply because of the faster/slower tempo of growth determined by the rate of his bone maturation [1-4]. Therefore, in research, clinical evaluation and to assure the concerned parents it is equally important to interpret child growth in terms of Skeletal Age rather than Chronological Age alone. The latter also may not be known especially in rural and tribal populations. Studies on the assessment of Skeletal Maturation or bone ageing and of physical growth are numerous [5-14]. There are some that have dealt with these two intimately related processes together [16-19]. Indeed only few have assessed physical growth on the basis of skeletal maturation [4- 20].
In India such reports are limited to a preliminary study on the progress of skeletal maturity and growth of height and weight of well-off Chandigarh children [18] and the other, of height growth on the basis of (TW2) 20 Bone Age [20]. Keeping in view the paucity of such data, this paper presents Radius, Ulna and the Short Bone Age (RUS BA) based attained means of Height (HT), Sitting Height (SH), Subischial Leg Length (SLL) and Weight (WT) of well-off NW Indian children and their tempo unconditional 1-year velocities.
MATERIALS AND METHODS
Six hundred and sixty seven (667), apparently healthy school children (Table 1) ( 341B and 326G) belonging to well-to-do families in Chandigarh, NW India were examined using cluster sampling.
Table 1: Chronological Age wise distribution of the sampled children.
|
Age Group |
Boys |
Girls |
|
n |
n |
|
|
6 ± |
32 |
29 |
|
7 ± |
33 |
31 |
|
8 ± |
30 |
31 |
|
9 ± |
31 |
30 |
|
10 ± |
33 |
30 |
|
11 ± |
33 |
32 |
|
12 ± |
31 |
30 |
|
13 ± |
32 |
31 |
|
14 ± |
30 |
32 |
|
15 ± |
31 |
31 |
|
16 ± |
25 |
19 |
|
Total |
341 |
326 |
These were contacted in the modern/expensive, Convent/Public Schools that are preferred and attended by the well-off section of the Chandigarh population. Besides, the profession of the parent(s), the size of the family and the monthly income – all these were taken into account in enlisting the children in the study. Their HT and SH were measured on Holtain Stadiometer and Sitting Height Table, respectively by the standard upward pressure technique [21] in the Auxology Laboratory, Department of Anthropology, Panjab University, Chandigarh, India. SLL in each child was derived by subtracting SH from HT. The WT was measured on an AVERY beam balance to the nearest 50g. Also the same day, a standard anteroposterior left hand wrist radiograph of every child was taken following the standard procedure for assessing the TW2 bone ages [1].
Anthropometry and bone maturity ratings were done by the same person (GP) with high reliability [20-23]. Out of these, 480 children (238G, 242B) were measured and radiographed again after a lapse of 10 months. This allowed calculation of tempo unconditional 1-year velocities of these dimensions and the bone age advance by annualizing the actual increments in each child. The data set therefore comprised of:
Attained Means
Appropriate age and sex wise comparisons of the means of first and second time measurements with the pooled data set did not reveal any significant ‘stayers’ effect’ i.e., the possibility of any child staying in the same age group therefore, being counted twice in a age group. Hence for augmenting the sample size, the attained means of these dimensions are based on the pooled data for each bone/chronological age year (564G, 583B) as done in Prakash and Pathmanathan 1992, Pathmanathan and Prakash 1994 [24-26]. The children were classified sexwise into one bone/chronological age year groups such that gave whole year as the mid point, e.g., 6.6 to 7.49, 7.5 to 8.49 and so on. Means and SDs of these dimensions were then calculated.
Tempo Unconditional 1-Year Velocities
The tempo unconditional 1-year velocities of these dimensions in each child were obtained by annualizing the actual increment to exact one year. An individual ‘bone /chronological age center’ was determined by adding half of the time interval between two examinations to the Bone Age/Chronological Age at the first examination. Thus boys and girls (238G, 242 B) were reclassified separately into one year BA/CA age group with the whole bone/ chronological age year as the mid point as explained above. Means and SDs of the 1-year velocities were then calculated for each sex and Bone/Chronological age year group.
RESULTS
Attained Means
Examination of RUS BA based HT, SH, SLL and WT reveals that boys are larger than the girls at all RUS Bone Age levels except at the ages of 12 to 14 years where both the sexes are more or less on par. In contrast, the Chronological Age based attained means of these measurements show a typical growth pattern, i.e., boys are larger during the younger ages, then the girls take over when they enter into their adolescence (Figures 1a-d, 2a-d). This contrasting growth pattern of boys and girls on the bases of RUS BA and CA show that even though the girls are at par/ slightly larger than the boys at certain Chronological Age points, according to the level of Bone maturity, the attained mean values of the boys are larger than those of girls at most of the Bone age points.
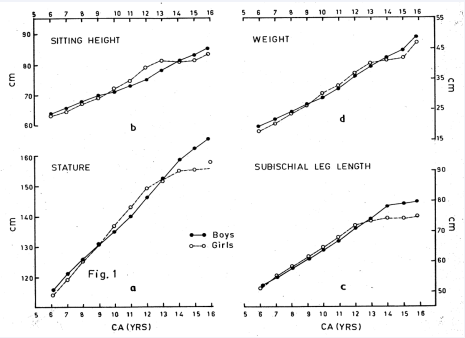
Figure 1 Chronological age based attained means of Stature (a), Sitting height (b), Subischial leg length (c) and Weight (d) well-off NW Indian children.
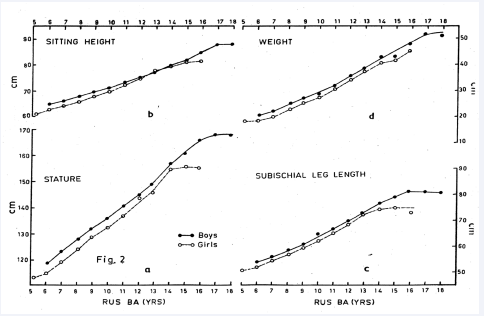
Figure 2 Bone age based attained means of Stature (a), Sitting height (b), Subischial leg length (c) and Weight (d) of well-off NW Indian children.
In girls the slowing down of growth in HT and SH based on their CA starts taking place at about 14 years onwards which is also supported by their very low 1-year velocities in these dimensions around this period (Figures 3a-d).
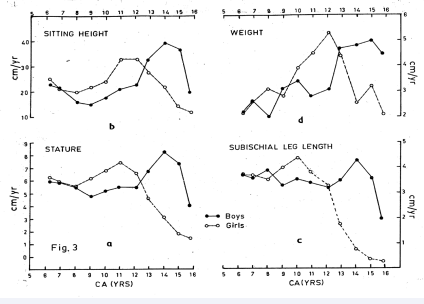
Figure 3 Chronological age based tempo unconditional 1-year velocities of (a) Stature, (b) Sitting height, (c) Subischial leg length and (d) Weight of well-off NW Indian children.
The same in SLL occurs by about 2 years earlier, at 12 years. The CA based attained means growth curves of the general body dimensions of the boys however, do not show any plateau till 16 years CA and their CA based 1-year velocities also are high – about 2-4 cm/yr. during this period. In boys, the attained mean height based on CA and RUS BA are more or less similar till 15 years, thereafter, for the next two Bone Age years, the attained means based on RUS BA increase and cease to go further – meaning that among the chronologically 16 years old boys, there are some early maturing ones who attain the final height of about 168cm. at 16.9 years RUS BA which could not be ascertained in the classification based on these children’s CA (Figures 4 a-d).
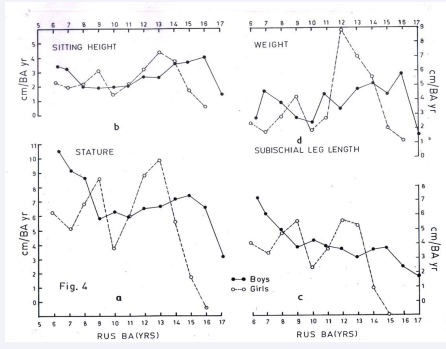
Figure 4 Bone age based tempo unconditional 1-year velocities of (a) Stature, (b) Sitting height, (c) Subischial leg length and (d) Weight of well- off NW Indian children.
The same is also true for the growth in trunk height, which attains the adult value of 88cm. at 17 years RUS BA – the same time they attain the adult mean height. It is also worthwhile to note that according to ICMR [22] the Class I Indian boys’ attained mean height and sitting height is about 168cm. and 88cm. respectively.
DISCUSSION
1-Year Velocities
The RUS BA based tempo unconditional 1-year velocities of HT, SH, SLL and WT are compared with Chronological Age based velocity data of these very children (Figures 3a-d, 4a-d). The pattern revealed by the former is very distinct, especially in girls (Figure 4a). Among them, apart from a baffling early peak, the adolescent spurt is sharp, narrow and high as it would be due to the reduced phase differences. In CA based velocities because of the larger variations in the tempo of individuals, particularly during the adolescent period the curve of the adolescent spurt is low and broad. Although tempo conditional velocities are more precise in estimating the adolescent peak, the situation improves even if tempo unconditional velocities are used more so when they are based on Bone age. Girls’ one-year height velocity curve based on RUS BA is shifted to the right side on the time axis by
two years. This can be accounted for by the advanced skeletal maturity revealed by this sample. The tempo of bone maturity in these children was comparatively faster than the British standards especially in girls [23-26]. Therefore, the peak height velocity (9.8cm. /BA yr.) occurs later by about 2 years – at 13 years RUS BA than it does on Chronological Age basis - at 11 years and so is the ‘take-off’ at 9.8 years RUS BA compared to 8 years on CA basis.
Boys’ one year velocities of HT based on RUS BA (Figure 4a) do not give rise to a sharp, narrow and high adolescent spurt. In contrast, the peak is rather flattened, much broader and the PHV, 7.3cm/BA Yr. is not as high as that of girls and that of their own based on their CA. The take-off velocity at 11 years RUS BA is higher than the same based on their CA. And it is evident that the velocity curve is shifted by about one BA year to the right on the time axis. This agrees with their tempo of skeletal maturation. Even though they are advanced compared to the British standards relatively, their tempo is not as fast as that of the girls. As a result, among the boys, the peak in height based on RUS BA appears a year later than that based on their CA. But a standard difference of 2 years is still maintained between the adolescent peaks of girls and boys.
At the younger ages, the CA based 1-year velocities of boys and girls are more or less same (Figure 3a-d). However, in terms of RUS BA, the Boys’ 1-year velocities are considerably high during this period – a reason for their larger attained means at the younger ages (Figure 3, 4 a-d). The rise in their RUS BA based HT velocities during the early part of their adolescent spurt is delayed. In fact, the 1-year HT velocities of their adolescent period, from 11 to 16 years RUS BA remains around 6-7. 5cm. / Yr., - a reason clear enough for causing broad and low adolescent spurt (Figure 4a).
Sitting Height (SH)
The pattern of RUS BA based tempo unconditional 1-year velocities of SH of boys and girls (Figures 3b, 4b) differs somewhat from that of HT in that the magnitude of adolescent spurt in SH of both the sexes is similar with same peak velocities. The girls experience their adolescent peak in SH at the same time they do so in HT.
Subischial Leg Length (SLL)
It is interesting to note the contrasting patterns of the 1-year velocities in the two sexes. The general pattern of the velocities of SLL of the girls is similar to that of their tempo unconditional 1-year velocities of HT and SH based on RUS BA, with a narrow and high adolescent spurt, but with the peak a year earlier than in HT and SH. The RUS BA based 1-year velocities of SLL of boys do not show any such marked adolescent spurt (Figure 4c). While no definite cause could be identified at present for this pattern, this itself may perhaps be the reason why boys failed to show a high, narrow and sharp adolescent peak in their height velocity based on RUS BA, for PHV occurs when the sum of SH and SLL velocities is maximum.
Weight (WT)
The general pattern revealed by the tempo unconditional 1-year velocities of weight are also similar, girls with a sharp, narrow and high peak and boys displaying a broader and rather flattened curve (Figures 3d, 4d).
Mid-growth spurt
The velocity curves of HT, SH, SLL and WT exhibit an unexplained peak earlier than the take-off point of the respective adolescent spurts, particularly in girls. If these are adjusted for CA then this peak should occur at around 7 years. This is the time when a pre-adolescent (mid growth) spurt – a short-lived acceleration in the rate of various dimensions has been observed by a number of workers [27,28]. If this is a ‘mid growth spurt’ then a prominent wave like this one should also be seen in the RUS BA based 1-year velocities of height in boys.
The falling high 1- year velocities in boys observed at 6-8 years RUS BA (i.e., 5-7 years CA) may probably be the descending part of the ‘mid growth spurt’ even though it seems to occur a little earlier than that of the girls. There is no apparent reason for considerably high velocities noted during this period. This is further supported by the fact that higher velocities are also noted in SH and SLL of boys during this time and the presence of a prominent spurt with a peak at about at about 7 years RUS BA in their 1-year velocities of WT. The early peak in the velocity in height, at 9 years RUS BA in girls and the falling high velocities in boys may indeed be the ‘mid growth spurt’, as reported in various other populations [28-33]. This coincides with the reported CA 7 Years at which this spurt occurs. A similar acceleration has also been observed between 8 and 10 years of RUS BA velocities (i.e., BA yr. /CA yr.) with a peak at 9 years (Pathmanathan 1989). There is little doubt, therefore that these spurts actually are the ‘mid growth spurts’ in bone age and general body dimensions.
As discussed in detail [28] the occurrence of this spurt in growth was first reported by Backman (1934) that confirmed the existence of this in some boys of certain cross-sectional series belonging to 1879-1919 period. Later in 1942, a similar spurt was observed in girls of the same series (Grubb 1942). Several other authors have reported the occurrence of this spurt not only in HT but also in several other body measurements. This short-lived acceleration in the velocity of limb circumferences, biepicondylar diameters and in transverse diameters of hip and chest was observed in various mixed longitudinal data [29-34]. After reanalysing the mixed longitudinal data of British Foundation Studies the existence of such a spurt was also accepted in girls [35,36]. According to this report that this is “more marked in breadth than in length measurements”. Infact, the author is doubtful regarding the existence of the same in arm, leg and trunk lengths. In the 1-year velocities of the 1966-67 L.C.C Survey a clear mid growth spurt in WT, arm and calf circumferences, and in triceps and Subscapular skinfolds was observed [28].
In a report of synchronization of mid childhood growth spurts, three clearly defined growth spurts in HT, SH, and leg
length have been identified in a longitudinal sample [30]. First, the Preschool spurt that occurs around 4.5 to 5 years (CA); second, the Mid childhood spurt (between 6.5 and 7.0 years CA) and the third, Late childhood spurt (between 8.5 and 9.2 years CA). The absence of such a spurt in most cross-sectional surveys is largely due to the phase difference [28]. In fact, except a few earlier ones, all other reports regarding mid growth spurt are based on mixed longitudinal data. In cross sectional data the spurt gets diminished if the variation in tempo between the individuals is larger. Moreover, this spurt does not seem to occur in all individuals [27-32]. Visual examination of Harpenden data showed clear mid-growth spurt in about half of the children [28]. This non-occurrence of the spurt in a proportion of children may further diminish the spurt.
In 1-year velocities each yearly velocity is independent of the rest. In such data, therefore, even smaller fluctuations such as ‘mid-growth spurt’ if they occur in most individuals and at almost same ages should show up [28]. As it is seen in the present study, situation further improves due to reduction of the phase differences by considering the bone age instead of the chronological age [33]. Rudlin [32] developed a technique for the ‘three dimensional representation of linear growth and skeletal maturation’ that clarify such phenomena as the mid-growth spurt.
In the present sample, in girls, the mid-growth spurt in each of the dimensions studied appears 7 and 10 years RUSBA, i.e., between 5 and 8 years with a peak at 7 years of comparable CA (Figures 3a-d,4a-d). In boys it seems to occur earlier than the girls! Why? In this respect longitudinal study involving endocrine response of the growth cartilage plate activity could prove fruitful. Till such time as pure longitudinal data become available, the data presented here can be gainfully used in diagnosis and treatment of various growth disorders including constitutional short stature and several syndromes/chromosomal abnormalities.
REFERENCES
- Tanner JM, Whitehouse RH, Marshall WA, Healy, MJR, Goldstein, H. Assessment of skeletal maturity and prediction of adult height (TW2 method).London: Academic. 1978.
- Tanner JM. Foetus into man. London: Open books publishing Ltd. 1978.
- Tanner JM. Education and physical growth. Implications of the study of children’s growth for educational theory and practice. London: Hodder and Stoughton. 1978.
- Takai S. Sexual dimorphism in somatic growth viewed from skeletal maturation. Igaku Kenkyu (Acta Medica).1981; 51: 225-237.
- Lee MM, Garn SM, Rohmann CG, McPhaden PW. The clustering phenomenon and group-sequence of hand-wrist ossification centers, as illustrated by Chinese children from Hong Kong. Hum Biol. 1968; 40: 345-362. PMID: 5722016.
- Malina R. Skeletal maturation rate in North American Negro and White children. Nature. 1969; 223: 1075.
- Malina RM. Skeletal maturation studied longitudinally over one year in American Whites and Negroes six though thirteen years of age. Hum Biol. 1970; 42: 377-390. PMID: 4322976.
- Levine E. The skeletal development of children of four South African populations. Hum Biol. 1972; 44: 399-412. PMID: 5079947.
- Kimura K. Skeletal maturity of the hand and wrist in Japanese children by the TW2 method. Ann Hum Biol. 1977; 4: 353-356. doi: 10.1080/03014467700002281. PMID: 201213.
- Kimura K. Skeletal maturity of the hand and wrist in Japanese children in Sapporo by the TW2 method. Ann Hum Biol. 1977; 4: 449-453. doi: 10.1080/03014467700002431. PMID: 203219.
- Takai S, Akiyoshi T. Skeletal maturity of Japanese children in Western Kyushu. Am J Phys Anthropol. 1983; 62: 199-1204. doi: 10.1002/ ajpa.1330620209. PMID: 6650680.
- Waterlow JC, Buzina R, Keller W, Lane JM, Nichaman MZ, Tanner JM. The presentation and use of height and weight data for comparing the nutritional status of groups of children under the age of 10 years. Bull World Health Organ. 1977; 55: 489-498. PMID: 304391; PMCID: PMC2366685.
- Hauspie RC, Das SR, Preece MA, Tanner JM. A longitudinal study of the growth in height of boys and girls of West Bengal (India) aged six months of 20 years. Ann Hum Biol. 1980; 7: 429-440. doi:0.1080/03014468000004541. PMID: 7235623.
- Billewicz WZ, Thomson AM, Fellowes HM. Weight-for- height in adolescence. Ann Hum Biol. 1983; 10: 119-124. doi: 10.1080/03014468300006261. PMID: 6838160.
- Billewicz WZ, Thomson AM, Fellowes HM. A longitudinal study of growth in Newcastle upon Tyne adolescents. Ann Hum Biol. 1983; 10: 125-133. doi: 10.1080/03014468300006271. PMID: 6838161.
- LOW WD, CHAN ST, CHANG KS, LEE MM. SKELETAL MATURATION OF SOUTHERN CHINESE CHILDREN. Child Dev. 1964; 35: 1313-1336. doi: 10.1111/j.1467-8624.1964.tb05270.x. PMID: 14251377.
- Frisancho AR, Garn SM, Ascoli W. Childhood retardation resulting in reduction of adult body size due to lesser adolescent skeletal delay. Am J Phys Anthropol. 1970; 33: 325-336. doi: 10.1002/ ajpa.1330330306. PMID: 5490180.
- Prakash S, Cameron N. Skeletal maturity of well-off children in Chandigarh, North India. Ann Hum Biol. 1981; 8: 175-180. doi: 10.1080/03014468100004921. PMID: 7247347.
- Singer R, Kimura K. Body height, weight, and skeletal maturation in Hottentot (Khoikhoi) children. Am J Phys Anthropol. 1981; 54: 401-413. doi: 10.1002/ajpa.1330540314. PMID: 7234987.
- Pathmanathan G, Prakash S. Height growth based on (TW2) 20 bone age in well-off N-W Indian children. Ind. J. Phys. Anthrop. & Hum. Genet. 1991a; 17: 155-161.
- Cameron N. The methods of Auxological Anthropometry. In: Falkner F, Tanner JM, editors. Human Growth. Vol. 3. New York: Plenum Publishing Corporation.pp. 1986; 3-43.
- Indian Council of Medical research, technical report, Series No. 18. Growth and Physical Development of Indian infants and children. 1984; 176.
- Pathmanathan G, Prakash S. Pattern of skeletal maturity in well-off N-W Indian children. Ind. J. Phys. Anthrop. & Hum. Genet. 1991b; 17: 175-194.
- Pathmanathan G, Prakash S. Growth of sitting height, subischial leg length and weight in well-off northwestern Indian children. Ann Hum Biol. 1994; 21: 325-334. doi: 10.1080/03014469400003332. PMID: 080234.
- Prakash S, Pathmanathan G. Tempo-unconditional 1-year bone score velocities in well-off north-west Indian children. Ann Hum Biol. 1991; 18: 303-310. doi: 10.1080/03014469100001622. PMID: 1750752.
- Prakash S, Pathmanathan G. Differences in adult height between well- off north-west Indians and Britains as a product of lower height gain per unit bone maturity advance during the adolescent years. Ann Hum Biol. 1992; 19: 125-132. doi: 10.1080/03014469200002002.PMID: 1580537.
- Bock RD, Thissen D. Statistical problems of fitting individual growth curves. In: Johnson FE, Roche AF, Sussane C, editors. Human Physical Growth and Maturation, Methodologies and Factors. New York: Plenum. 1980: 265.
- Tanner JM, Cameron N. Investigation of the mid-growth spurt in height, weight and limb circumferences in single-year velocity data from the London, 1966-67 growth survey. Ann Hum Biol. 1980; 7: 565-577. doi: 10.1080/03014468000004681. PMID: 7212642.
- Meredith HV, Boynton B. The transverse growth of extremities: An analysis of girth measurements for arm, fore-arm, thigh, and leg taken on Iowa City White children. Hum. Biol. 1937; 9: 366-403.
- Butler GE, McKie M, Ratcliffe SG. The cyclical nature of prepubertal growth. Ann Hum Biol. 1990; 17: 177-198. doi:10.1080/03014469000000952. PMID: 2337324.
- Molinari L, Largo RH, Prader A. Analysis of the growth spurt at age seven (mid-growth spurt). Helv Paediatr Acta. 1980; 35: 325-334.PMID: 7451236.
- Stützle W, Gasser T, Molinari L, Largo RH, Prader A, Huber PJ. Shape- invariant modelling of human growth. Ann Hum Biol. 1980; 7: 507-528. doi: 10.1080/03014468000004641. PMID: 7212638.
- Rudlin CR. A three-dimensional representation of linear growth and skeletal maturation. Acta Paediatr Scand Suppl. 1989; 356: 46-50; discussion 51. doi: 10.1111/j.1651-2227.1989.tb11240.x. PMID: 2816357.
- Meredith HV. The rhythm of physical growth. University of Iowa studies in child welfare. 1935; 11: 124.
- Tanner JM. The Morphological Level of Personality. Proc R Soc Med. 1947; 40: 301-308. PMID: 19993549; PMCID: PMC2183337.
- Count EW. Growth patterns of the human physique: An approach to kinetic anthropometry. Hum.Biol. 1943; 15: 1-32.


