Research on the Evaluation of Emergency Response ability of Logistics Personnel in Colleges and Universities
- 1. School of Safety and Emergency Management Engineering, Taiyuan University of Technology, China
Citation
Xuefeng W, Jiahuan M, \Zeyu F, Xin K (2025) Research on the Evaluation of Emergency Response ability of Logistics Personnel in Colleges and Universities. Ann Public Health Res 12(1): 1138.
QUOTE
For a long time, Chinese universities have been focusing on teaching, scientific research and innovation, but the construction and research of emergency management system is still very weak now. Emergencies in colleges and universities refer to events that happen suddenly in institutions of higher education, are unpredictable and urgent, and cause or may cause serious social harm to campus safety, the life and property safety of students and staff, and normal learning and life order [1].
These events include but are not limited to natural disasters, campus violence, public health incidents, network security incidents, etc [2]. Natural disasters, such as earthquake and flood, may damage campus buildings and kill teachers and students, thus directly affecting the normal development of teaching activities [3]. Campus violence, including conflicts between students and interference from external personnel, not only endangers the personal safety of teachers and students, but also may lead to psychological trauma, which in turn affects students’ study and quality of life [3]. Public health events, such as disease outbreaks, can spread quickly, affecting the health of teachers and students but also interfering with teaching plans and making school management more difficult [3]. While cyber security issues, such as data leaks and cyberattacks, may pose a threat to the security of school teaching resources and personal information, affecting the normal operation of the school [3]. The occurrence of these emergencies will not only bring direct harm to individuals, but also cause a series of chain reactions, thus affecting the stability and reputation of the entire campus. This requires colleges and universities to establish a sound emergency management system to improve individual ability to deal with emergencies, so as to ensure the safety of teachers and students and the stability of teaching order.
The prevention and treatment of emergencies in colleges and universities is related to the safety of the school and the stability of the whole society. College students come from all over the country, with a large number, strong mobility and complex composition, and their safety has been highly concerned [4]. At present, most of the researches on individual emergency response ability in universities are aimed at college students. As a school three subsystems (teaching, research system, ideological and political work system, logistics management system), logistics management system also plays an important role [4]. The logistics work of the university is for the whole school, it involves catering, property, greening, dormitory management, maintenance, water and electricity operation and medical treatment and other aspects, covering every corner of the school, the purpose is to ensure that all students work, study and life [5]. When an emergency occurs on campus, whether the logistics personnel can organize and coordinate in the first time and actively respond to it is the key to reduce the damage and loss of the emergency. Therefore, to evaluate and study the emergency response ability of college logistics personnel, to better complete the selection and allocation of personnel, so that they can better meet the safety requirements of the post, for preventing accidents, reducing accident injuries and losses, plays a very important role.
As for the evaluation of individual emergency response ability, there have been a large numb er of studies at home and abroad. Hsu DJ et al., measured the work fatigue level and physiological response of high-rise construction personnel by studying the environmental factors in which they work, including physiological indicators such as lower limb circumference, blood pressure, heart rate, flash integration degree and intensity. To study the subjective fatigue performance and physiological response of workers at different heights. It was found that strength test could not be used as an effective measure of subjective fatigue in high-rise working environment, and the visual sensitivity of workers would be affected by the change of height when workers were working at higher levels [6]. Sirotic AC et al., measured the physiological response and performance index of group sports by simulating group activities on A non-motorized track. Eleven team athletes first did a test of the fastest sprint speed, and then did a simulation of group sports for 30 minutes on an unpowered treadmill. By testing the subjects’ overall running distance, total distance at all speeds, total load, high-intensity activities, average maximum running speed, maximum explosive power, etc., as well as physiological indicators (heart rate and blood pressure), a reliable means was provided for evaluating and monitoring the physiological response and performance indicators of the subjects [7]. Wang Yuniu and Luo Yuejia (2003), proposed that people would have a series of irrational emotions and behaviors in the face of emergencies, and summarized them into hypochondriac psychology, panic psychology, anxiety psychology, depression psychology, obsessive psychology and supplementary psychology.
In this paper, he discussed and analyzed these six aspects of psychological characteristics in detail. This paper provides some reference for emotional coping in emergencies in the future [8]. Wang Yu et al., studied the emergency response ability of controllers under emergency situations and found that 5 physiological parameters such as mean heart rate, SDNN (Standard deviation of all sinus intervals), PNN50 (Proportion of NN50 divided by total number of NN (R-R) intervals), tension EDA (Electrodermal Activity, EDA) and phase EDA had significant changes [9]. It can be seen that using the physiological information changes of human body in emergencies to evaluate the emergency response ability is a commonly used evaluation method at present.
EXPERIMENTAL DESIGN AND PROCESS
Experimental Principles
Behavioral science theory [10], showed that your emotions have a direct impact on your ability to act. In the absence of preparedness, emergency situations can cause people to produce fear, panic, despair and other emotions, and these emotions will stimulate the sympathetic nervous system activity. Nerve fibers travel from the spinal cord to the sympathetic ganglia and then disperse to organs such as the internal organs, pancreas and cardiovascular system, triggering nerve excitation and different responses throughout the body. At this point, the body may experience dilated pupils, increased heart rate, skin and internal muscle tension, increased sweat secretion, disturbed breathing rhythm, increased blood pressure, airway dilation, muscle contraction in the sexually excited area and other reactions. When the body is calm again, the function of the sympathetic nervous system is weakened, the function of the vagus nerve is enhanced, the pupil is relaxed, the heart rate is slowed, the skin and internal organs are dilated, the blood pressure is lowered, the breathing becomes smooth, the small bronchi contract, and the excretory muscles are relaxed. The physiological response caused by this emotion is known as the “psychophysiological response”. Many experts at home and abroad have explored the connection between psychological and physiological responses. James Lange’s view of emotions holds that emotions are actually mental and physical responses caused by environmental stimuli, and all emotional stimuli are associated with physical behavioral responses, accompanied by changes in physiological indicators [11]. On this basis, this paper selects the appropriate physiological indicators for testing, analyzes the changes of these physiological indicators before and after the occurrence of emergencies, and evaluates the ability of logistics personnel to cope with emergencies according to the changes of these physiological indicators
Experimental Design
The experiment was divided into three stages: baseline period, event period and recovery period. In terms of the selection of physiological indicators, physiological parameters such as skin conductance, muscle electrical activity, heart rate, heart rate variability, respiratory rate, blood pressure, body temperature, blood volume, electroencephalogram, sweat secretion and oxygen consumption usually selected when physiological experiments are used to study emergency ability in emergencies at home and abroad [12]. According to the research of Wang Qi et al., physiological parameters such as heart rate, skin conductance, respiratory sinus arrhythmia, pre-ejection period and low frequency/high frequency ratio can partly reflect the emergency response ability [13]. Previous studies have pointed out that negative emotions such as fear, anxiety and nervousness may cause changes [14]. In order to study the physiological changes of college logistics personnel in emergency situations, this study will collect the data of six physiological indicators, including respiration, heart rate, diastolic blood pressure, systolic blood pressure, LF/HF (Parameters reflecting changes in cardiac autonomic function in the first 5 min of an arrhythmia, i.e. indicators of sympathetic-vagal dynamic balance )and NN50(Number of beats in which the difference between adjacent NN intervals is greater than 50 across all NN intervals).
Experimental Subjects and Environment
The experimental site is the virtual reality laboratory in the school, and the virtual reality environment is used to simulate the emergencies that occur in the school. The participants in the emergency simulation experiment were 40 employees of the school’s logistics department, including 21 men and 19 women, aged 36 to 57. All the participants were in good health without any history of mental illness or drug abuse. Before the start of the experiment, the participants were told not to do high-intensity exercise on the day of the experiment, not to take drugs that may affect the function of cardiovascular and cerebrovascular vessels, not to drink coffee and other energy drinks, and not to stay up late. In order to better ensure the experimental effect, all subjects were informed about the VR equipment used in the experiment in advance, and were familiar with the experimental procedure and operation.
Experiment Process
Strictly screening the two periods of similar fluctuations in the human physiological cycle, respectively, from 9 am to 12 pm and 14 pm to 17 pm, the physiological activities of the human body in these two periods are relatively stable, which can minimize the influence of external interference factors on the experimental results [15]. Before the formal start of the experiment, each subject was required to fill in a number of professional scales and questionnaires, including the “Big Five personality Test Scale”, “Anxiety Self-rating Scale” and “Emergency Knowledge and skills Questionnaire”, etc., in order to fully understand the key information of the subjects’ personality characteristics, psychological state and emergency handling skills. The experimental scheme was explained to the subjects to ensure that they fully understood the experimental operation, and began the experiment after proper practice.
The subjects were fitted with sensors, pulse data were collected by clamps fixed on their fingers (heart rate, NN50 and LF/HF measurements could be seen on the monitor), and respiratory rate was monitored by elastic bands fixed on the upper abdomen. The physio lab polygraph is activated to collect physiological information during the baseline resting phase (about 5 minutes), and then the subject is brought into a virtual reality environment, where they wear VR glasses and hold a stick to make sure their vision is properly adjusted, and then the experiment is formally conducted. To collect physiological information about the subjects in the virtual environment of the emergency (in the event phase). The physiological signals of the subjects were measured continuously for a period of time after exiting the VR scene (recovery period). Blood pressure was measured by an electronic sphygmomanometer over three periods. After the data collection of one subject is completed, the next data collection process continues until the data collection of all subjects is completed.
DATA ANALYSIS
The experiment collected the data of 40 subjects, and compared the data of 6 physiological indicators between the baseline and the event period. The results showed that the change trend of these indicators was the same, and the data in the event period was greater than that in the baseline period. SPSS25.0 was used to perform sample t test on the data, and then the data were processed without dimensionality. The evaluation index f of emergency response capability was used to evaluate each data, and the data samples were classified according to cluster analysis and questionnaire survey results.
Analysis of Changes in Physiological Indicators
The data of the subjects in the baseline stage and the event stage were monitored in real time using the physiological polyconducter. In order to facilitate statistics, 40 subjects were numbered, and the change rates of 6 physiological indicators of 40 logistics personnel during the baseline period and the event period were statistically analyzed. Meanwhile, sample T-test was conducted on the two groups of data. The measurement data of 6 physiological indicators are shown in Figure 1,
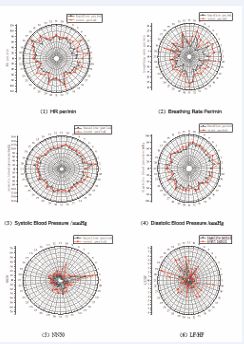
Figure 1 Measurement results of physiological indicators before and after the experiment
and the rate of change is shown in Table 1.
Table 1: Changes in data for 6 types of physiological indicators.
|
Subject No. |
HR Change Rate |
Rate Of Breathing Change Rate |
Systolic Blood Pressure Change Rate |
Diastolic Blood Pressure Change Rate |
NN50 Change Rate |
LF/HF Change Rate |
|
|
0.2838 |
0.1053 |
0.0275 |
0.0548 |
0.4783 |
1.2500 |
|
|
0.5455 |
0.7333 |
0.1377 |
0.1628 |
0.4200 |
2.2500 |
|
|
0.3607 |
0.7857 |
0.0707 |
0.1528 |
0.3636 |
1.2727 |
|
|
0.1733 |
0.2273 |
0.1132 |
0.1579 |
4.2500 |
0.6667 |
|
|
0.7538 |
1.0909 |
0.0841 |
0.0986 |
1.8571 |
1.7500 |
|
|
0.1316 |
0.4444 |
0.1078 |
0.0845 |
0.1429 |
4.5000 |
|
|
0.1486 |
0.5385 |
0.0364 |
0.0270 |
3.0000 |
0.2000 |
|
|
0.0617 |
0.2222 |
0.0467 |
0.0526 |
4.0000 |
0.5556 |
|
|
0.0390 |
0.2381 |
0.0631 |
0.0822 |
3.0000 |
1.1429 |
|
|
0.0972 |
1.0000 |
0.0163 |
0.0506 |
2.7143 |
0.4000 |
|
|
0.0357 |
0.1818 |
0.0455 |
0.0694 |
0.2727 |
1.2381 |
|
|
0.0533 |
0.1429 |
0.0381 |
0.1186 |
0.6250 |
0.2609 |
|
|
0.0435 |
0.0870 |
0.0463 |
0.1290 |
0.6923 |
1.3333 |
|
|
0.0506 |
0.1333 |
0.0467 |
0.1379 |
0.6667 |
1.3750 |
|
|
0.0196 |
0.0909 |
0.0286 |
0.0656 |
0.4167 |
0.4651 |
|
|
0.2192 |
0.3846 |
0.0808 |
0.0448 |
1.0000 |
1.1250 |
|
|
0.0550 |
0.1000 |
0.0182 |
0.0133 |
0.2143 |
0.3333 |
|
|
0.0753 |
0.2000 |
0.1150 |
0.0441 |
0.5333 |
2.6000 |
|
|
0.0230 |
0.3500 |
0.1300 |
0.1017 |
1.2727 |
2.0000 |
|
|
0.1067 |
0.2000 |
-0.1210 |
-0.1316 |
-0.2609 |
2.3125 |
|
|
0.0750 |
0.3636 |
0.0472 |
0.0845 |
0.3571 |
1.4000 |
|
|
0.0857 |
0.1111 |
0.0286 |
0.2105 |
0.2308 |
3.3333 |
|
|
0.0169 |
0.1538 |
0.0294 |
0.0377 |
0.2353 |
0.0455 |
|
|
0.0411 |
0.2667 |
0.0625 |
0.0822 |
0.2308 |
2.7500 |
|
|
0.3582 |
0.1667 |
0.0879 |
0.0893 |
0.5556 |
3.6250 |
|
|
0.1765 |
0.3846 |
0.0761 |
0.1379 |
0.4167 |
2.0000 |
|
|
0.1774 |
0.7000 |
0.0660 |
0.0533 |
0.8000 |
1.8333 |
|
|
0.0345 |
0.2353 |
0.1042 |
0.1724 |
1.0909 |
0.1667 |
|
|
0.0889 |
0.2143 |
0.0345 |
0.1129 |
0.3750 |
0.5556 |
|
|
0.0267 |
0.4706 |
0.0472 |
0.0455 |
1.1538 |
1.6250 |
|
|
0.0411 |
0.1154 |
0.0980 |
0.2885 |
1.3333 |
0.7500 |
|
|
0.0366 |
-0.0800 |
-0.0180 |
-0.0333 |
-0.0968 |
2.3333 |
|
|
0.1020 |
0.3846 |
0.0439 |
0.0735 |
0.2857 |
3.7500 |
|
|
0.0333 |
0.2000 |
0.0196 |
0.0290 |
0.4211 |
1.1429 |
|
|
0.1475 |
0.6154 |
0.1134 |
0.0926 |
0.6154 |
1.3333 |
|
|
0.0411 |
0.2500 |
0.0510 |
0.0484 |
1.0000 |
1.3750 |
|
|
0.1333 |
0.3333 |
0.0654 |
0.0704 |
0.5833 |
2.5000 |
|
|
0.1067 |
0.3750 |
0.1165 |
0.1077 |
0.4118 |
1.4000 |
|
|
0.1609 |
0.3636 |
0.1792 |
0.0946 |
0.6250 |
1.0000 |
|
|
0.0750 |
0.2857 |
0.0909 |
0.1159 |
0.7333 |
3.1875 |
|
average |
0.1309 |
0.3291 |
0.0619 |
0.0858 |
0.9254 |
1.5784 |
It can be seen from the data in Table 1 that, except for some special circumstances, the 6 physiological data of 40 subjects all increased in the event period compared with the base period, and the change rates of NN50 and LF/HF were the largest. SPSS25.0 was used to conduct sample t test on 6 physiological indicators before and after the experiment to verify the reliability of the test results. The test results were shown in Table 2.
Table 2: Paired samples t-test before and after the test for the 6 categories of indicators.
|
Physiological Indicators |
Pairing Difference |
t |
df |
Sig. |
||||
|
Average |
Standard Deviation |
Standard Error of the Average |
Difference 95% Confidence Interval |
|||||
|
Floor |
Upper Limit |
|||||||
|
HR |
-9.525 |
10.127 |
1.601 |
-12.764 |
-6.286 |
-5.948 |
39 |
0.000 |
|
Rate Of Breathing |
-4.525 |
2.996 |
0.474 |
-5.483 |
-3.567 |
-9.553 |
39 |
0.000 |
|
Systolic Blood Pressure |
-6.475 |
5.598 |
0.885 |
-8.265 |
-4.685 |
-7.316 |
39 |
0.000 |
|
Diastolic Blood Pressure |
-5.575 |
4.314 |
0.682 |
-6.955 |
-4.195 |
-8.173 |
39 |
0.000 |
|
NN50 |
-8.400 |
6.242 |
0.987 |
-10.396 |
-6.404 |
-8.511 |
39 |
0.000 |
|
LF/HF |
-1.628 |
1.267 |
0.200 |
-2.033 |
-1.222 |
-8.122 |
39 |
0.000 |
According to the statistical analysis in Table 2, among the measured physiological indicators, heart rate, respiratory rate, systolic blood pressure, diastolic blood pressure, NN50 and LF/HF showed significant significance in the paired sample t test, that is, P<0.05, indicating that the above physiological indicators data had significant changes before and after the test. The average growth rates of the six physiological indicators of heart rate, respiratory rate, systolic blood pressure, diastolic blood pressure, NN50 and LF/HF reached 13.09%, 32.91%, 6.19%, 8.58%, 92.54% and 157.84%. Therefore, we can evaluate the emergency response ability of logistics personnel according to these 6 physiological indicators. Before and after the experiment, the one with the lowest change rate of various physiological parameters has the best ability to respond to emergencies.
Evaluation of Emergency Response Ability
Through the statistical analysis of 2.1, it is found that 6 physiological indicators have obvious changes before and after the experiment, so these 6 physiological indicators can be selected as parameters to establish the emergency response ability index f [16-18] f is a dimensionless value, calculated by the following formula:
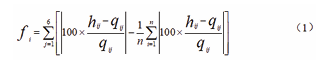
In the formula, qij is the physiological index value of each subject in the baseline period, hij is the physiological index value of each subject in the event period, n is the total number of subjects, n =40. j is the number of physiological indicators measured, j= 1,2,3,4,5,6. According to the calculated value of F-index, draw a line chart of emergency response ability index, as shown in Figure 2
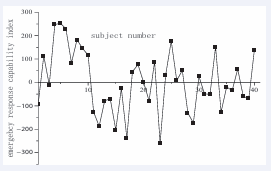
Figure 2 Distribution of emergency response capacity index f
As can be seen from figure 2, f value represents the difference between the amplitude and the average value of various physiological indicators of an individual from the baseline period to the event, which can be used to measure an individual’s emergency response capacity to emergency events. Taking 0 as the average and f as a positive number indicates that the volatility of relevant physiological indicators of the subject is higher than the average, that is, the subject’s emergency response ability is low in emergency situations. The higher the value of f, the greater the change of the physiological parameter value of the subject in the emergency, and the weaker the ability to cope with emergencies. On the contrary, if f value is negative, it indicates that the corresponding physiological indicators have less fluctuation, that is, the ability to cope with emergencies is strong.
The lower f value, it indicates that the corresponding physiological indicators have less change, reflecting the stronger the individual’s emergency response ability to emergencies. From the distribution of f value in the figure, it can be seen that the f value of most people is in the range of -200 to 200, which can be considered as the normal range of physiological indicators. For people who are not in the [-200, 200] range, the range of physiological changes is too large or too small. F > 200 means that physiological parameters are more volatile, and f < -200 means that physiological indicators are less volatile. In this principle, the emergency response ability index of 40 subjects can be divided into three different levels, where f < -200 indicates that the subjects ha ve good emergency response ability; -200 ≤ f ≤ 200, indicating that the subjects’ ability to respond to emergencies is at a medium level; f > 200 indicates poor coping ability to emergencies.
As can be seen from Figure 2, subjects No. 4, 5, and 6 all had F-scores above 200, indicating that these three support personnel were weak in responding to emergencies. Subject 15, 17 and 23 had an F-value of less than -200, indicating that the 3 logistician had good coping ability in emergency situations. The relevant information of the above 6 subjects was obtained through the questionnaire, as shown in Table 3
Table 3: Basic information of the subjects.
|
Subject Number |
The Number of F |
Gender |
SAS Score |
Emergency Knowledge Score Situation |
|
4 |
247.6831 |
female |
43 |
1 |
|
5 |
252.3058 |
male |
79 |
1 |
|
6 |
229.9687 |
female |
55 |
1 |
|
15 |
-202.5099 |
male |
36 |
3 |
|
17 |
-237.7364 |
female |
43 |
1 |
|
23 |
-259.2852 |
male |
47 |
3 |
(the failing score of the emergency knowledge questionnaire was 1, the passing score was 2, and the excellent score was 3). There was no obvious pattern in the gender of the subjects, and the scores of the anxiety Self-rating scale (SAS) of the subjects No. 4, 5, and 6 were high, while the scores of the emergency knowledge questionnaire were low. Subjects No. 15, No. 17 and No. 23 had low scores on the Anxiety Self-Rating Scale (SAS), but high scores on the emergency knowledge questionnaire. According to the basic data of these 6 research subjects, there is a certain degree of correlation between the level of their emergency response ability index, their understanding of emergency rescue knowledge and their psychological state.
Cluster Analysis of Emergency Response Ability
Cluster analysis is an unsupervised learning method used to divide the objects (or observations) in the data set into several disjoint subsets (or clusters), so that the objects within the same cluster are as similar as possible, while the objects between different clusters are as different as possible. The clustering results can usually be visualized by graphs or charts to facilitate intuitive understanding of the data distribution and clustering effect [19]. Cluster analysis was performed on physiological parameters of 40 subjects, and similar samples were grouped using systematic clustering method [20] to verify the accuracy of F-value in section 2.2. See Figure 3 for the overall clustering tree diagram.
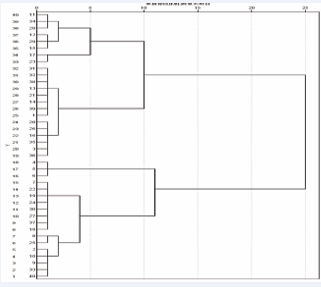
Figure 3 Overall cluster analysis dendrogram.
According to the tree diagram of the overall cluster analysis, the study objects are divided into four groups. By comparing the absolute values off of the subjects in different groups and their emergency response ability, it is found that the absolute values off of the same group are very similar. This conclusion is consistent with the conclusions of the existing studies, indicating that f value can be used to evaluate the emergency response ability of college logistics personnel under emergencies.
CONCLUSION
1) This study took 40 university logistics staff as the research objects. 6 physiological parameters were measured in the baseline period and the event period, respectively. The sample T-test showed that 6 physiological parameters (heart rate, respiratory rate, systolic blood pressure, diastolic blood pressure, NN50, LF/HF) had significant differences compared with the baseline period.
2) Construct the emergency response index f of college logistic staff under emergencies, and use cluster analysis to verify the index. According to the experimental results, the f value of logistics personnel in emergencies can be divided into three intervals for evaluation: f < -200, -200≤f≤200, f > 200, indicating that their emergency response ability is excellent, good and poor respectively. On campus, according to the f value of the logistics personnel, the staff with different emergency response ability can be classified, so as to properly assign different positions according to the needs, or provide targeted training for the logistics personnel.
3) The basic information such as working years, educational level, psychological state and emergency knowledge reserve obtained by questionnaire survey was compared with the physiological index data obtained in the experiment. It was found that the people with mental health, more emergency knowledge reserve and longer working years had a lower f index, indicating that they had a higher emergency response ability. At the same time, it also provides a theoretical basis for the school to select and train logistics personnel.
REFERENCES
- Liu Haiyan. Research on University Emergency Management System. Nankai University. 2010.
- He Xin. Research on Collaborative Mechanism of Emergency Management in Chinese universities. University of Electronic Science and Technology of China. 2024.
- School of Medicine, Shanghai Jiao Tong University. The common emergency response and disposal [EB/OL]. 2015.
- Cao Lei. Reflections on Logistics Management and Emergency Prevention and Control in Colleges and Universities. Talent. 2021; 000: 104-107.
- Gao Jianjun. The key and difficult work in college logistics security in the post epidemic period. College logistics Res. 2020; 3.
- Hsu DJ, Sun YM, Chuang KH, Juang YJ, Chang FL. Effect of elevation change on work fatigue and physiological symptoms for high-rise building construction workers. Safety Sci. 2008; 46: 833-843.
- Sirotic AC, Coutts A J .The reliability of physiological and performance measures during simulated team-sport running on a non-motorised treadmill. J Sci Med Sport. 2008; 11: 500-509.
- WANG Yiniu, LUO Yuejia. Characteristics of mood disorders and responses to public health emergencies. Adv Psychol Sci. 2003; 11: 387-392.
- WANG Yu, WANG Jianxin. Measurement of controller safety behaviour ability in emergency situations based on physiological characteristics. Microcomputer Information. 2018; 141: 137-138.
- LIU Jiyun, SUN Shaorong. A review of behavioural science theory research. Exp Financial Theory. 2005; 36-37.
- Kazuo O, Mami K, Takashi N, Nakamiya T, Williams RE, Horvath SM. Individual differences in physiological responses and type A behavior pattern. Appl Human Sci. 1999; 18: 101.
- Chen Na. Experimental Research on behavioral ability in Coal mine emergency Scenario. China University of Mining and Technology (Beijing). 2010.
- Wang Qi. Research on College Students’ Emergency Ability Based on Physiological Experimental Measurement. Xi ‘an University of Science and Technology. 2024.
- Li Ying. Experimental Research on Students’ Emergency Ability in Virtual Situation of University Emergency. Taiyuan University of Technology. 2023.
- Zou Yangyang. Experimental Research on Comprehensive Evaluation Index of Driver Fatigue based on Physiological Signals. Henan Polytechnic University. 2014.
- Wang Jianhao, Ma Huaibin, Long Long. Study on changes of individual physiological indexes under emergency scenario. China Work Safety Science and Technology. 2014; 10: 5.
- Chen Na, Jiang Zhengbiao, Li Xinjian. Virtual fire scene construction and individual stress physiological response evaluation. Fire Science and Technology. 2018; 37: 5.
- Zhang Jiangshi, Fu GUI, Chen Na. Research on evaluation method of miners’ emergency handling ability. J China Coal Society. 2012; 37: 5.
- Fang Kaitai. Cluster Analysis (I). Mathematics in Practice and Cognition, 1978; 1: 55-63.
- Fu deyin. Statistical Testing in Q-type system Cluster Analysis. Statistics and Information Forum. 2007; 22: 5.


