How to Assess an Economic Paradox of Respiratory Infectious Diseases in Ageing Adults, an Exploratory Exercise
- 1*. Department of Care and Ethics, University of Hasselt, Belgium
- 2. Digital Health Outcome, Ukraine
- 3. Department of Public Health, Epidemiology & Health Economics, University of Liège, Belgium
- 4. Department of Care and Ethics, University of Hasselt, Diepenbeek, Belgium
- 5. Primary Healthcare and Population Health, University of Antwerp, Belgium
- 6. Primary Healthcare and Population Health, University of Antwerp, Belgium
Abstract
Background: Older adults aged 65 years and above have declines in their health status, being exposed to more diseases including infections with more severe cases at older age.
Aim: Current disease management strategy against respiratory infection is investigated to identify and measure the economic paradox of more infection, more cost, less health gain in the more aged people.
Method: Modelling considers the heterogenous condition of the ageing population related to demography age, sex), health condition, place of living, exposure to respiratory infection, care given, cost, and quality health lost. Outcome is expressed as a cost, a Quality Adjusted Life Year (QALY)-loss, a Cost/ QALY-loss (C/Q), and an economic paradox index being the ratio of C/Q for a specific subgroup over a reference group. Sensitivity analysis assesses the paradox level through changes in specific mortality, infection rate, disease duration, and cost.
Results: A 1-year population model, called the AMAI-model, for the year 2023 of the Flemish County is built with all the characteristics known of the aging population (65y+, n = 1 430 423). The model illustrates the paradox of technical inefficiency that is essentially driven by 2 variables: specific mortality rate at younger age causing critical survival loss and the high cost of hospitalisation in the very aged population (Cost/QALY-loss: 11,327€ and 106,498€ respectively for Young and Old age-groups). The paradox index goes up to 9.4 for the Old age-group compared to the Young aged group. Changing survival loss to no specific deaths leads to the disappearing of the paradox, while increasing the infection rate (+5%) and hospital cost (+20%) marginally accentuate the paradox.
Conclusion: An economic paradox of respiratory infection exposure is likely to be present in ageing adults in the Flanders. It will be accentuated over time without specific new intervention as the 65y+ population is naturally growing in ageing.
Keywords
- Ageing
- Infection
- Economic Paradox
- Total Healthcare
Citation
Standaert B, Topachevskyi O, Ethgen O, Schrooten W, Van Hal G, et al. (2026) How to Assess an Economic Paradox of Respiratory Infectious Diseases in Ageing Adults, an Exploratory Exercise. Ann Public Health Res 13(1): 1143.
INTRODUCTION
Ageing populations increase in size and proportion, while their overall health status declines and their immune function weakens [1]. The consequences are that despite their growth in overall numbers, ageing adults are exposed to more chronic diseases and infections [2-5]. This creates an apparent paradox: increasing longevity is accompanied by a growing burden of frailty, multimorbidity and disability [6,7]. Consequently, the demand for healthcare services continues to increase. Healthcare expenditure increases markedly with advancing age and accumulates towards the end of life [8-10].
With these expenditure increases with ageing, it becomes essential to determine whether these additional investments continue to translate into meaningful health gains. More healthcare expenditure without proportional health gains raises the question whether the resources continue to be used with the same level of technical efficiency across the ageing population.
Ageing populations are commonly evaluated as if they are homogeneous groups [11]. This may obscure clinically important differences between subgroups with the associated differences between healthcare expenditure and health outcomes. Previous research has demonstrated that the composition and the effect of the disease and the intervention outcome may vary substantially across age, sex, and health status in the group [12]. Relying on measuring average cost and health loss for the group could then be inappropriate. Such average values mask extreme conditions under its umbrella, making false deductions for the whole group. Moreover, the healthcare offering is large and diverse in cost and effort. We need to capture all the different types of services present because they don’t function in silos [13]. Measuring the heterogeneity of the group is critical with a focus on the whole healthcare system because there are intricate links between the services. Preserving this heterogeneity is therefore a prerequisite for evaluating technical efficiency across the healthcare system.
that the composition and the effect of the disease and the intervention outcome may vary substantially across age, sex, and health status in the group [12]. Relying on measuring average cost and health loss for the group could then be inappropriate. Such average values mask extreme conditions under its umbrella, making false deductions for the whole group. Moreover, the healthcare offering is large and diverse in cost and effort. We need to capture all the different types of services present because they don’t function in silos [13]. Measuring the heterogeneity of the group is critical with a focus on the whole healthcare system because there are intricate links between the services. Preserving this heterogeneity is therefore a prerequisite for evaluating technical efficiency across the healthcare system.
The proposed analysis method follows a multi-step approach. The first step consists in the construction of disease models that preserve population and disease heterogeneity in cost spending and health loss [16,17]. They are measured in a well-defined geographical entity for a well-defined study period of one year. The next steps evaluate the relationship between healthcare expenditure and health outcomes while preserving this heterogeneity, allowing the presence and magnitude of an economic paradox to be quantified through an index.
This framework subsequently enables the evaluation of alternative intervention strategies to identify more efficient management of respiratory infections in ageing populations [18].
MATERIALS AND METHODS
General
The objective of this exploratory study is to estimate the full healthcare cost and health loss associated with respiratory infectious diseases in the Flemish population aged 65 years and older during the year 2023. The evaluation preserves population heterogeneity throughout the analysis to investigate whether differences in healthcare expenditure and health outcomes reveal an economic paradox and to quantify its magnitude.
An internal Delphi panel selected the study process, data sources and assumptions, resulting in a four-step framework as shown in (Figure 1).
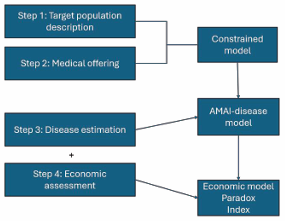
Figure 1 A: Structure of the project in 4 steps.
Step 1 defines the data that describe the target population in its demographic composition, place of living, and health condition status.
Step 2 inventories the medical offering in the region (type, quantity, and cost).
Step 3 estimates the disease frequencies based on studies undertaken in hospital care in the region, other data from the region, and a recent literature search. The estimates are defined with assumptions endorsed by the Delphi group.
Step 4 develops the economic evaluation with 3 models:
-The constrained model defines the logistics of place and medical services used by the people having the disease with the time (days) of disease exposure. It is an epidemiologic assessment linked to available care constraints. That information helps to validate the disease model. Numbers measured by the disease model can’t exceed those of the constrained model.
-The disease model identifies the disease events in function of sex, age-group, and health condition group at the different locations and medical services consulted. For each event a cost and a health-loss is measured. It accumulates the events, cost, and health-loss, including survival time loss, for the whole group over one year.
-The economic model uses stratification by which the possibilities to identify and compare subgroups are evaluated relevant to the assessment of the economic paradox hypothesis. Sensitivity analysis on presence/ absence of survival-loss, change in unit costs, disease duration, and infection rates tackle the hypothesis.
The only economic perspective considered in the project is the payer of medical reimbursement in managing the infectious disease. The clinical health loss is the one experienced by the patient only.
A common framework defines the locations and healthcare services used throughout all evaluations. Figure 1B shows per location (blue colour) the health condition (orange colour) expressed by the dominant MPI score group (good/zero, low, moderate, severe/high (see further)), the type of medical care service people may get (green colour), and the advanced care of hospitalisation (yellow colour) [16]. No transition probabilities are specified in that scheme between the different places or services where people may move around. Only proportions of people being at the different places and getting the specific services are measured and reported.
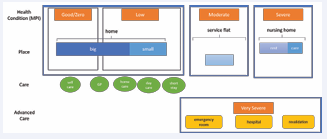
Figure 1 B: Specifying location of living related to the health condition score, and the type of care delivered when an infectious disease occurs.
The models developed look at the 3 places of living (home, service flat, nursing home) and 7 of the 9 services: self-care, General Practitioner (GP), home care, emergency room, hospital care, revalidation, and specific care in nursing home. In a service flat the inhabitants receive the same care as at home but with higher frequency of care visits by nurse and/or GP. Many people are getting home care with nurses visiting them. The frequency of the visits is sex, age, and disease severity (=duration) specific [14, 17, 19].
DATA
Step 1: Target Population Description
The demographic data are obtained through the STABEL-database (see Table 1). The spread of the people by location are deducted by the numbers obtained from the Flemish administration of Department ‘Zorg’ (Table 1). The data of the health condition status of the people are obtained through the studies of Pilotto and his team about the use of the Multidimensional Prognostic Index (MPI) tool [20-22]. The MPI-score groups capture the heterogeneity status related to their health condition. The categorisation splits the group in 3 age-groups (Young (65-74y), Middle (75-84y), 0ld (85y+)), 2 gender (Male, Female), and the 4 MPI score groups that use 3 criteria defining its classification: co-morbidity (no, minor, major), frailty (no, prefrail, frail), and disability (no, yes). The literature reports a risk increase for infection with worse MPI-scores [22,23].
Table 1: Constrained data available for the Flemish County.
|
Variable |
Numbers |
Source |
|
Demographic composition of 65+ in the Flanders by age and sex |
2023: 779 017 (F); 651 406 (M); 1 430 423 (O); |
(25) |
|
Number of hospital beds available in hospital care in the Flanders |
2022: 7 272 (C); 7 491 (D); 1 638 (E); 4 591 (G); |
(26) |
|
Number of geriatric beds available in the Flanders |
4 591 (G) |
(26) |
|
Number of nursing home beds available in the Flanders |
52 966 (6% of 65+) |
(27) |
|
Number of service flats available in the Flanders |
33 767 service flats |
(28) |
|
Number of geriatricians in Flanders |
2022: 151 FTE or 1.58/10 000 |
(29) |
|
Number of GPs in the Flanders |
2018: 9 267 |
(30) |
|
Numbers of infections in hospital care in geriatric wards |
52% |
(24) |
|
Proportion of respiratory infections among the infections reported in hospital geriatric ward |
60% |
(24) |
|
Bed occupancy rate in geriatric wards |
86% |
(24) |
|
Home care nurses in the Flanders |
Total nurses FTE practicing: 63 977 Hospital care: 38 680 Nursing home: 11 175 Home care: 11 798 Social welfare: 2 277 |
(29) |
However, the % MPI-split by age-group and MPI-score group is arbitrary chosen by the Delphi panel. It must comply with the assumption that worst scores are more seen in the more aged group, while at the same time a reduction of the best scores is observed in the same age group. Figure 2 shows the % distribution introduced by gender, age-group, and MPI score group. The distribution is slightly different by gender explained by more women live longer and the burden difference observed in hospital care [24]. The Delphi panel suggests starting with 50% of the young-aged men having a zero MPI-score followed by a substantial progressive decrease in each subsequent age group. The numbers were tested in a sensitivity analysis on QALY-loss scores and costs. The MPI-score groups also help to clarify the change in QALY-scores by age and gender as a correlation has been measured between the two measures [20]. Appendix A reports the proportional numbers used for the MPI-score groups and indicates the QALY-scores status of the people by age-group and sex as reported for the Belgian situation.
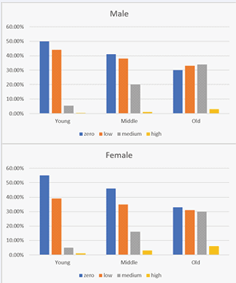
Figure 2: % distribution of the 4 MPI-score groups by age and gender.
Step 2: Medical Offering
Getting the constrained data on services is by having access to real-life information about the target group selected. Table 1 listed the available data with references. Cost information (the reimbursement prices for the year 2023) is presented in (Table 2) with a proposal for a maximum value to be tested in sensitivity analysis.
Table 2: List of items with reimbursement cost and maximum price to be charged in the year 2023 with a suggested maximum price (31).
|
Resource use |
Unit cost (€) |
Maximum price (€) |
|
General Practitioner (GP) |
25 |
30 |
|
Emergency Room (ER) (/day) |
252 |
302 |
|
Hospitalisation (/day) |
700 |
840 |
|
Revalidation (/day) |
350 |
420 |
|
Home care (fee nurse per visit) |
22 |
26 |
|
Nursing home (GP visit) |
32 |
38 |
|
Nursing home shift |
175 |
210 |
|
Home service (logistic) |
22 |
26 |
|
Service Flat (GP visit + nurse visit) |
49 |
58 |
|
Lab test |
22 |
26 |
|
ABX (12 d) |
22 |
26 |
|
Anti-inflammatory drug(12d) |
11 |
14 |
GP: General Practitioner; ABX: Anti-Biotics; ER: Emergency Room
Step 3: Disease Estimation
Respiratory Infection Data: The 4 most prevalent respiratory infections in ageing adults are influenza, COVID-19, pneumococcal, and RSV [32-35]. Very precise numbers about the overall infectious disease prevalence are absent because there is no systematic registration in place across the different locations and medical services offered. There is however a new, local initiative taken that could help in obtaining better evaluations soon [36].Based on a recent paper, the Delphi panel opts for a 40% prevalence rate to start with overall that must be adjusted by age and location [32]. The numbers are however also impacted by the demographic composition and the MPI group scores by age-category to be demonstrated in the result section.
Hospital Data
There is a limited number of beds available for ageing people in Flanders at around 4,500 geriatric beds delimited by age (>=75y) (Table 1). Hospital care also includes in addition recovery or revalidation (+10 days). Geriatric wards have a higher reimbursement cost with a longer average duration compared with non-geriatric beds which is a constraint in the logistics of health care delivery for the group. If no geriatric hospital bed is available, patients are staying home [37-39].
QALYs
The QALY-loss is expressed as a negative score per day (between 0 and -1) for the duration of the disease. That day score is transformed to year units by dividing the sum value by 365 days. The estimated QALY loss per day (=QALD) could be very limited in low level sickness (-0.02) to very extended for very severe situations estimated at -0.45 [40, 41]. The QALY-score loss is also linked to the MPI-score groups [42-44]. No discount is applied on quality health changes [45].
Duration
The infectious disease defines two critical aspects of the health and healthcare problem: frequency and severity [46]. The latter is expressed by its duration. Each subgroup identified has a different rate of respiratory disease infection. The average duration depends on the type of healthcare service received [47]. The data, here shown in Table 3, are based on local assessment of hospital care [24] and GP interviews [14]. Consequently, people reaching a revalidation service has the longest cumulative disease duration for which a different QALY-loss must be 30 302 840 420 26 38 210 26 58 26 26 14 accounted for each service received. (Table 3) indicates the baseline duration (days) for the QALY-loss and the Cost [24]. The data in Table 3 are adjusted in function of age (Young (baseline), Middle (+3 days), Old (+4days)), and of the health condition (MPI Zero (0); Low (+1 day); Moderate (+2 days); High (+3 days).
Table 3: Disease duration for different places and services related to the QALY-loss and the Cost under baseline conditions.
|
Duration |
QALY |
Cost |
|||||||||||||||||
|
|
|
|
|
Normal |
GP |
Nurse HC |
NHS |
ER |
Hosp |
Rev |
Post Recov |
Total |
GP |
Nurse HC |
NHS |
ER |
Hosp |
Rev |
Total |
|
Selfcare |
|
|
|
7 |
|
|
|
|
|
|
|
7 |
|
|
|
|
|
|
|
|
GP |
|
|
|
7 |
3 |
|
|
|
|
|
2 |
12 |
3 |
|
|
|
|
|
3 |
|
Home Care |
|
|
|
7 |
1 |
4 |
|
|
|
|
2 |
14 |
1 |
4 |
|
|
|
|
5 |
|
SF |
|
|
|
9 |
2 |
|
|
|
|
|
1 |
12 |
2 |
4 |
|
|
|
|
6 |
|
Nursing H |
|
|
|
9 |
1 |
|
|
|
|
|
|
10 |
1 |
|
|
|
|
|
1 |
|
Nursing HS |
|
|
|
10 |
1 |
|
4 |
|
|
|
2 |
17 |
1 |
|
4 |
|
|
|
5 |
|
ER |
|
|
|
10 |
1 |
|
|
1 |
|
|
2 |
14 |
1 |
|
|
1 |
|
|
2 |
|
Hospital |
|
|
|
|
|
|
|
|
|
|
|
|
|
|
|
|
|||
|
|
Known |
|
|
7 |
2 |
|
|
1 |
13 |
|
2 |
25 |
2 |
|
|
1 |
13 |
|
16 |
|
|
Primary |
|
7 |
2 |
|
|
1 |
13 |
|
2 |
25 |
2 |
|
|
1 |
13 |
|
16 |
|
|
|
|
Revalidation |
7 |
2 |
|
|
1 |
13 |
10 |
2 |
35 |
2 |
|
|
1 |
13 |
10 |
26 |
|
|
|
Secondary |
|
7 |
3 |
|
|
1 |
17 |
|
|
28 |
3 |
|
|
1 |
17 |
|
21 |
|
|
|
+ nosocomial |
|
7 |
3 |
|
|
1 |
19 |
|
|
30 |
3 |
|
|
1 |
19 |
|
23 |
|
|
|
Nosocomial |
|
7 |
3 |
|
|
1 |
18 |
|
|
29 |
3 |
|
|
1 |
18 |
|
22 |
|
|
|
|
Revalidation |
7 |
3 |
|
|
1 |
17 |
9 |
|
37 |
3 |
|
|
1 |
17 |
9 |
30 |
|
|
Unknown |
|
|
7 |
3 |
|
|
1 |
18 |
|
4 |
33 |
3 |
|
|
1 |
18 |
|
22 |
|
|
|
Secondary |
|
7 |
3 |
|
|
1 |
18 |
|
4 |
33 |
3 |
|
|
1 |
18 |
|
22 |
|
|
|
|
Nosocomial |
|
7 |
3 |
|
|
1 |
20 |
|
4 |
35 |
3 |
|
|
1 |
20 |
|
24 |
|
|
|
|
Revalidation |
7 |
3 |
|
|
1 |
18 |
10 |
4 |
43 |
3 |
|
|
1 |
18 |
10 |
32 |
GP: General Practitioner, SF: Service Flat, H: Home, HS: Home Service; ER: Emergency Room, Rev: Revalidation, Recov: Recovery
Mortality
Specific mortality data for respiratory infectious disease by age- and sex-group have been recently analysed based on COVID-19 and influenza data [48]. This recent paper suggests an exponential increase with ageing which we introduce at a starting rate of 0.007 for the young age group in the zero MPI score group up to 0.02 for the old age-group of the high MPI-score group (see Figure 3). There was no difference in gender proposed. The graph was subject to a sensitivity analysis given the critical value on life expectancy related to age. Deaths are expressed in QALY-years lost in function of the life expectancy expected at the age of dying. A man dying in the age-group of 65 to 74y, still has a life expectancy of 15y on average with a QALY-value estimated at 0.80 for that age. In contrast, a man dying in the age-group of 85+, has a life expectancy of 1y with a QALY-value estimated at 0.55 [25].
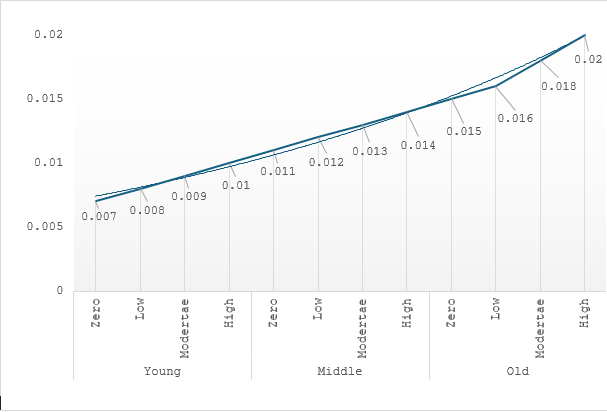
Figure 3: Specific mortality rate by age-group and MPI-score group.
Step 4: Economic Assessment
Constrained model: The constrained model determines the maximum number of disease events that can occur within the available healthcare capacity. The calculations are illustrated using geriatric hospital beds as an example. Given the number of geriatric hospital beds available in the county, it shows the number and timing of respiratory events to be managed per year, given its average duration. The numbers specified in Table 4 indicate what can’t be exceeded by the disease model. The constrained model provides therefore an internal validation by ensuring that disease events cannot exceed available healthcare capacity. This assessment also highlights, given the fixed numbers of services available and people exposed, the proportion of people not receiving or getting medical support, focussing on self-care. That proportion is also much depended on the proportion of people getting the disease overall (Table 4).
Table 4: Evaluating the disease numbers to be assessed at a hospital level.
|
Definition |
Calculation |
65-74y Value |
Calculation |
75y+ Value |
Calculation |
Total Value |
|
Total Flemish population above 65+ |
|
737,769 |
|
692,654 |
|
1,430,423 |
|
Two age-groups |
|
|
|
|
|
|
|
Geriatric beds |
|
|
|
4,591 |
|
|
|
Beds needed (1/4 of geriatric beds) |
|
1,148 |
|
|
|
|
|
Bed days/y |
1148*365 |
419,020 |
4591*365 |
1,675,715.0 |
|
|
|
Average duration per stay (days) |
|
7 |
|
15 |
|
|
|
Total number of stays per year |
419020/7 |
59,860 |
1675715/15 |
111,714 |
|
|
|
Infection% amongst the stays |
|
35% |
|
52% |
|
|
|
Respiratory infections among the infections |
|
40% |
|
60% |
|
|
|
Infection hospital stay |
59847*35% |
20,951 |
103339*52% |
58,091 |
|
79,042 |
|
Respiratory hospital stays |
59847*35%*40% |
8,380 |
103339*52%*60% |
34,855 |
|
43,235 |
|
% of subgroup |
8379/737769 |
1.14% |
|
32242/692654 |
|
3.0% |
|
Bed days occupied for respiratory infection |
|
58,663 |
|
522,823 |
|
581,486 |
|
% bed days occupied for respiratory infection |
|
14% |
|
31% |
|
28% |
|
Total respiratory hospital stays for 65+ |
|
|
|
|
(7714+32242)/1430423 |
3.02% |
Results are expressed as relative values because respiratory infections occupy only a small proportion of the total person-time observed during one year. Confidence Intervals (95% CI) on the % estimates are measured assuming normal distribution in the numbers.
The AMAI-Disease model: The disease model, which is called the Ageing Model about Infection (AMAI), captures all aspects presented above through stratification. The most basic unit of the stratification process has a within homogeneity of cost and clinical health loss related to the infectious disease and its management. The model type selected is a 1-year population assessment presented as a point prevalence [49]. It allows for adequate control and validation of the input data. With a limited number of assumptions to test, it facilitates the interpretation of the sensitivity analysis. The model is accessible and downloadable on the Digital Health Outcome platform: https://hebo.digitalho.app/iframe/scenario/692d65db0b bd2fc2353120bb.
The denominator of the analysis is the entire time lived by the target population. It allows that each person in the group accumulates days of disease suffering, receiving different health services at a different cost with different QALY-losses at different locations. The health condition is measured, as mentioned above, with the MPI-tool [23]. It allows to make a link with QALYs [50, 51]. High scores lead to a high QALY-loss situation. The AMAI model provides granularity in disease-specific cost and QALY-loss that is critical to test the potential presence of an economic paradox hypothesis [52]. Four Figures are presented as summary descriptive results: the combination of the demographic age-composition and the 4 clusters of MPI health condition; the distribution by gender of the different events observed by location/service; the QALY-loss related to the disease by location/service split by gender; the cost data by location/service split by gender. This type of overview helps specifying where and when the health loss could be seen at what cost. The full presentation of the output as a dashboard, is presented in Appendix B and is also available in the downloadable model (Dashboard sheet).
Economic Model
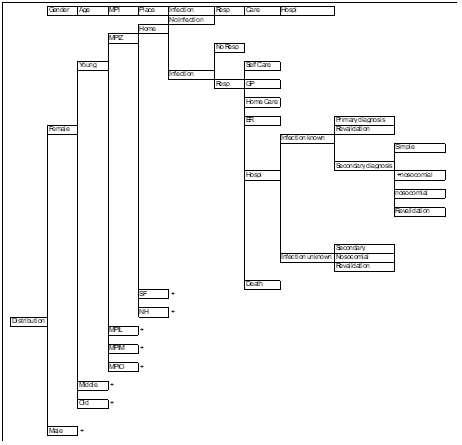
The economic model aggregates the AMAI outputs into 24 analytical subgroups used to quantify the economic paradox. Table 5 illustrates as an example a part of the total summary table. The total decision tree of the model is presented in (Appendix C).
Table 5: Example of a variable list (n = 56 units) defining the input values (events) by end-location (Home), the different medical services, the MPI categories (Zero, Low, Moderate, High), and the age-group (Young) for one sex-group.
|
Female |
Young |
|||||||||
|
End-location |
Medical Services |
Events |
Cost |
QALY-loss |
||||||
|
|
Zero |
Low |
Moderate |
High |
|
|||||
|
Home |
Alive |
Self Care |
|
|
|
|
|
|
||
|
GP |
|
|
|
|
|
|
||||
|
Home Care |
|
|
|
|
|
|
||||
|
Nursing Home |
|
|
|
|
|
|
||||
|
Emergency room |
|
|
|
|
|
|
||||
|
Hospitalisation |
Known |
Primary |
|
|
|
|
|
|
||
|
Revalidation P |
|
|
|
|
|
|
||||
|
Secondary |
|
|
|
|
|
|
||||
|
+Nosocomial |
|
|
|
|
|
|
||||
|
Nosocomial |
|
|
|
|
|
|
||||
|
Revalidation S |
|
|
|
|
|
|
||||
|
Unknown |
Secondary |
|
|
|
|
|
|
|||
|
Nosocomial |
|
|
|
|
|
|
||||
|
Revalidation U |
|
|
|
|
|
|
||||
|
Death |
|
|
|
|
|
|
|
|
|
|
The economic value is assessed through a cost/QALY loss per unit. That measure is also quantified as a sum per age-group, sex, and as a function of the MPI-health condition. The results indicate the cost paid for the QALY loss to be recovered. An economic paradox is seen when a too high cost is paid for a too marginal QALY-loss to be recovered. The paradox index is the calculation of the ratio of a cost/QALY for a specific subgroup over a reference group. The latter is the one considered having the right balance between the cost paid for the QALYs lost to be recovered, being a straight diagonal line: the QALY-loss increase is linked to a justified cost increase.
The assessment allows the identification of where potential care bottlenecks may appear when changing some of the variables that introduce a new policy to reduce a too high paradox level that may appear. The sensitivity analyses, performed on the 24 units, may indicate by when the paradox may manifest itself at most or at its lowest level by changing some assumptions on specific mortality rate, infection rate, disease duration, and cost of care. Also, altering the infection rate across the target population should affect the incremental cost and the QALY-loss in a different way across ages and genders. Potential discrepancy between young-aged group versus old-age group, is reported through the correlation-value measured between the cost difference and the QALY-loss difference across the 24 units when ranking on a Y and X-axis by increasing the infection rate up to 5%. With no paradox, a straight diagonal line must be seen between the two variables over the whole evaluation scheme.
These types of analysis are done in univariate evaluations. No multivariate nor probabilistic sensitivity assessments are made as that may complexify the assessment without being able to identify very precisely which precise impact is caused by which specific variable. Together, these three models provide a sequential framework that progresses from healthcare capacity constraints to disease burden estimation and finally to the economic assessment of the paradox.
RESULTS
Descriptive Evaluation
The Constrained Model: When adjusted to its demographic composition with the spread of the health condition by age and sex, 33.5% (95% CI: 24.24%-42.75%) of the total target group is exposed to a respiratory infectious disease during 2023. Confirmed by the constrained model, most of those events (> 70%, ((8.8% +8.3% + 6.7%)/33.5%) could be observed among people living at home. Hospital care represents only 10% of all respiratory infectious disease events (3.5%/33.5%). More than ¼ of the diseases (8.8%/33.5%) are to be seen among people who do not seek professional care (see Figure 4). The % sum of all the orange bars, being the proportions of people having the disease, is 33.5% as indicated by the Total bar. The % sum of all the blue bars is 100% and represents the total group.
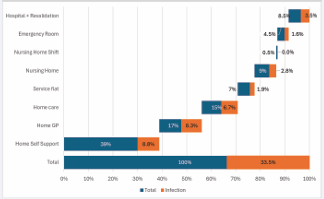
Figure 4: Estimated % distribution of people with a respiratory infection event per different location or service (blue bars represents the % of the total number of people linked to a specific location or service; the orange bars is the relative distribution of the infectious disease across the different locations/services).
Although one third of the population experiences a respiratory infection, the cumulative disease time represents only a very small fraction of the total lifetime observed, confirming the acute nature of respiratory infections (1.5% time of disease exposure (=7,348,973/522,104,395 days) (95%CI: 0.01%-3.8%). As shown in Figure 5, the % distribution in time (days) of respiratory infectious diseases in the different locations, is monopolized again by the home situation (62% of the 7,348,973 days of time loss).
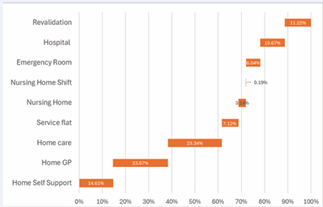
Figure 5: Estimated % distribution of respiratory infection time (days) per different location/services for the population of 65+ during one year.
The % of the disease time duration in the self-support condition (14.61%) is much smaller compared with the % of the people suffering in that situation (26.3% = 8.8%/33.5%) (see previous graph). That difference is explained by the small average duration assigned for the disease under the condition of self-support (~ 7 days) as compared with the durations for the other situations (see also Table 3).
The AMAI-model: The AMAI model demonstrates that preserving heterogeneity reveals substantial differences in healthcare utilization, costs, and health loss across demographic and health-status subgroups (see Figure 6). In Figure 6A there is no gradual decline shown in the numbers by age which explains the disease spread of 33.5% in the group instead of 40% as proposed by the Delphi panel. A high concentration of GP and home care services is seen in Figure 6B. The QALY-loss and cost are respectively reported in Figures 6C and 6D which show a high focus on hospitalisation and revalidation. Finally, the last two Figures (6E &6F) show the increase in cost by age group despite the decrease in individual numbers (Figure 6A) mainly driven by the high hospital cost.
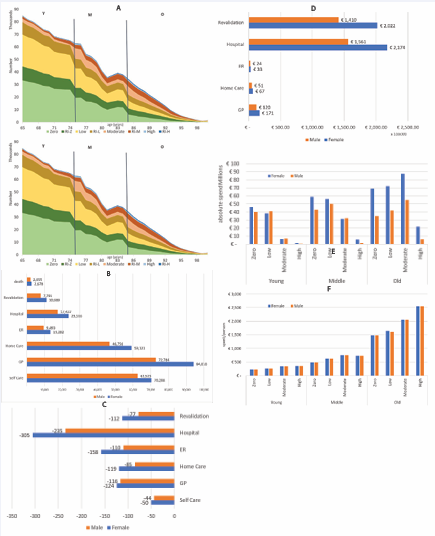
Figure 6 A: demographic age composition and the different MPI-score cohorts split by the numbers having a respiratory infection (RI); B: absolute numbers of events by location/service split by gender (red: male, blue: female); C: QALY-loss by gender and location/service; D: cost estimates by gender and location/service; E: absolute cost by age-group and gender; F: cost spent by individual per gender and age-group.
A total presentation of the Dashboard with the disease infection rates introduced by age is presented in Appendix B and is also available in the downloadable model presentation. The graphs in Figure 6 reveal the gender differences regarding health care consumption, QALY loss, and costs explained by the presence of more female than male patients. An unexpected finding is the high QALY loss at the level of ER. This could be explained by the many old people going to ER after already a long period of being sick. They don’t stay in the hospital because of the limited number of beds available.
Overall, the observed patterns are consistent with the expected distribution of healthcare utilisation and costs: high cost in hospital and revalidation care, much lower cost for GP and home care; high QALY-loss related to the deaths to be avoided (not shown, but in the range -15,000/ gender), more QALY-loss with hospitalisation than with revalidation because recovery may occur in the latter. The data about service flats and nursing home are too small to consider them separately in those figures. They are regrouped into the options of GP, home care, ER, hospital care, and revalidation.
ECONOMIC EVALUATION
Paradox in the AMAI-model
The economic evaluation demonstrates a progressive loss of proportionality between healthcare expenditure and recoverable health loss with increasing age. The model works with the 3 age-groups (Young, Middle, Old) and the cost per QALY-loss that is also detailed for the units of the 4 MPI-score groups. The results combine the data of both sexes. A pattern of a much higher cost paid by aging age-group is observed while the QALY-loss per age group follows the opposite direction, indicating therefore the presence of an economic paradox (Figure 7A). The paradox is however best illustrated in Figure 7B with the exponential increase in cost/QALY-loss for the Older age group. Figure 7C has in addition the MPI-scores included. An additional peak (red cycle) for the unit of O-Zero is appearing. That peak is explained by the high shift in that age-group from home to nursing home (higher cost) with no much of extra QALY-loss. The AMAI model therefore allows to identify, through its granularity, causes of bizarre shifts in the data.
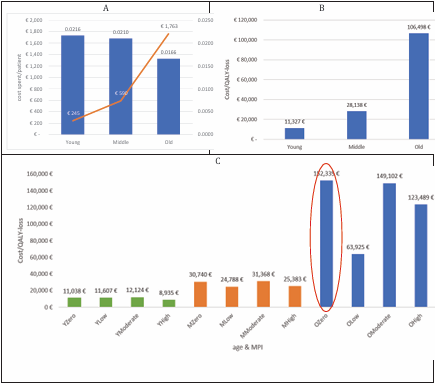
Figure 7: A (Cost and QALY-loss per age-group), B (Cost per QALY-loss for 12 summary units), C (Cost per QALY loss for Age- and MPI-group).
If we look at the paradox index by comparing the two older age-groups to the reference group being the Young age-group, we measure a value of 2.5 for the Middle age group and 9.4 for the Old age-group. For the Old age-group we therefore spend 9 times more per QALY-loss to be recovered as compared with the Young age-group. That value is substantial in extra cost spending for no much of a substantial health-loss to be recovered.
SENSITIVITY ANALYSIS
Survival Time & Hospital Cost
Removing survival loss and reducing hospital costs substantially alters the age-specific cost–QALY relationship, indicating that these two variables drive the observed paradox. If in the model the survival-loss is much reduced because of no deaths and the hospital cost is decreased by half its price, an inverse QALY-loss picture by age-group is observed. The new graphs in Figure 8 illustrate that point. The cost still increases with age but has a dramatic reduction in total cost as compared with Figure 7A (see Figure 8A). Also important to note is the reduced scaling of QALY-loss for the Young age-group as compared with Figure 7A. As expected, the results of the cost/QALY loss by age-group show a different design that doesn’t support the paradox anymore (no gradual increase in the ratio by age-group) (Figure 8B). However, the ratios of the cost/QALY as indicated in the Y-axis are much higher than in Figure 7B and C, indicating that the investment or the spending is very high for the very marginal QALY-loss to recover when there is no survival loss at stake. The analysis indicates to be very precise on mortality rates and survival gains measured across the group as these variables heavily impact the paradox result.
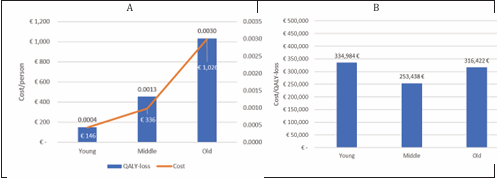
Figure 8: A (Cost and QALY-loss per age-group), B (Cost per QALY-loss for 12 summary units) when deleting the deaths caused by respiratory infection.
Infection Rate
Increasing infection rates progressively uncouple healthcare expenditure from recoverable health loss. In Figure 9 the QALY-loss differences per subgroup (sex, age, MPI score group) are listed from high to low on the X-axis with the cost differences per subgroup on the Y-axis from high to low. If no paradox should be present in the data, all the dots should be clustered on a diagonal line from left under to the right upper corner as it is the case when the QALY-loss and the cost differences are both low (right upper corner). This is however not the case when the differences are getting larger, meaning that the correlation is anymore strong between a high QALY-loss linked to a high cost when the amount difference is increasing by increasing rate of infection. That lack of correlation in that area is explained by the change in demographic composition of the group (more aged), linked to a higher risk for more severe infection. While ageing induces a higher care cost, the QALY-loss to be recovered does not dramatically increase. Measuring the correlation of the dots in the right upper corner (n = 9), a value of 0.926 is obtained. Making the same calculation in the left lower corner (n = 13), a correlation value of -0.016 is measured. There is therefore a disconnect between investment cost versus potential health gain to be seen with ageing regarding the management of respiratory infectious diseases when they increase.
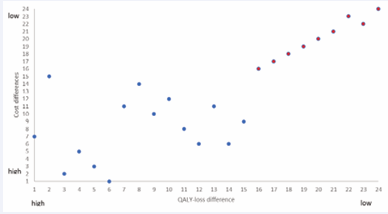
Figure 9: QALY-loss differences and cost differences in function of infection change with 5%.
Cost Change Overall
When increasing each unit cost with 20% as indicated in Table 2 with the maximum price proposal, as expected, hospitalisation and revalidation costs have the biggest impact on the net cost increase of the program (see Figure 10). Overall, the sensitivity analyses consistently indicate that the economic paradox results from the interaction between survival-related QALY gains in younger individuals and increasing hospital costs in older adults.
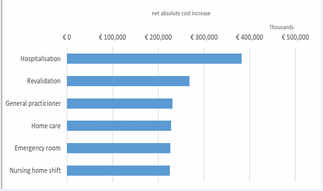
Figure 10: Sensitivity analysis on cost increase with 20% of each unit cost.
DISCUSSION
An extended modelling exercise has been developed to capture comprehensively the total burden (QALY loss and extra cost) of respiratory infectious diseases in older adults aged 65 years and above across the whole healthcare system for the Flemish County of Belgium in the year 2023. The literature on respiratory infections in older adults identifies the main causes but provides limited information on where infections mostly occur across the healthcare system [32, 34]. Additionally, an in-depth economic evaluation of the medical services used is often lacking. This modelling exercise addresses these gaps and makes two principal methodological contributions.
The first contribution confirms previous observations on the importance of preserving population heterogeneity [12]. To adequately assess the infection problem in that age-group, stratification into different layers is needed because the demography and the infection risk are not uniformly distributed in the group, and the care supply becomes increasingly costly with higher disease severity levels with increasing age [53]. The second methodological contribution is that with this heterogeneous approach of the problem a more precise view is obtained about the economic assessment of managing infectious diseases. Economic paradoxes can then be identified more readily about technical efficiency of care given. It is then quantified using the paradox value index [54].
Although respiratory infectious diseases served here as a demonstration case, the designed framework is also applicable to other diseases requiring an economic evaluation in a heterogeneous ageing population.
The analysis also identified additional findings including the high % of self-care people, the substantial workload for GPs and homecare nurses, the large cost differences between medical services offered, and the bottlenecks being present in healthcare delivery [33, 46, 55-57].
The analysis demonstrates what was known about the cost of healthcare delivery in ageing adults. It heavily accumulates with ageing. However, the issue needs to be investigated in detail to provide greater insight into what is happening. The study quantifies the extent to which high healthcare expenditure may be associated with relatively limited health gain under specific conditions. When population heterogeneity is substantial, preserving this heterogeneity allows healthcare delivery to be evaluated more accurately and facilitates the identification of economic paradoxes. That is the strength of this evaluation for being an elegant process of investigation that hasn’t been explored enough in healthcare assessment [8, 10, 54, 58]. There is therefore a need to become very specific and detailed in the evaluation as there are so many different forces (ageing, infection risk, complexity of the treatment, healthcare offering, cost) that operate within that specific age-group into different directions. Once these detailed assessments are done, the identification of an economic paradox is therefore not unexpected. It rather helps to avoid using average values for the group as a basic assumption. The latter could be a valid approach if homogeneity is present, but in ageing adults this is not the case.
Some critical issues remain when performing such an exploratory modelling exercise. First is the uncertainty on the selected values entered into the model that might stress the model acceptability with the assumptions made. A way to properly cope with this situation is on the one hand to work with a group of experts to obtain consensus on data input in the model when having the information collected from different sources. On the other hand, is to apply the appropriate sensitivity analysis. We have handled this uncertainty problem here following both strategies. A second data issue is about the precise values on the health condition of the target group for which we used literature information obtained about the MPI tool. The data are therefore indicative. It would have been better to obtain that information directly from the group under study. Doing so is however difficult in a retrospective study design we have here. Moreover, the sensitivity analysis (not shown in the paper) indicated that getting very precise MPI information doesn’t affect substantially the outcomes of the analysis because the model is constructed under the constraints of demographic constellation and healthcare facilities which heavily restrict the flexibility to be seen in outcome results. A third effort is about external validation of the approach that needs confirmation with real-world data evaluation. The model as presented here must be considered a baseline exercise on which to build and to adjust with more precision through a plan and time schedule in testing the assessments made. When those 3 issues (data selection, data acquirement, validation) are adequately tackled, the approach here proposed could become a standard method of evaluation for other diseases that have limited information.
A final point of concern about the model presentation is the question who may gain from such an evaluation [59]. At least, two groups could be identified. One is the reimbursement authorities who may evaluate with this tool whether new interventions have an economic benefit as predicted, where, and when knowing that the environment is not homogeneous. Another group could be the local healthcare coordinators to improve efficiency in their delivery with the support of the model output. The model needs therefore to be adaptable to numbers and structures of local healthcare settings. Our objective is to do so for local programs on prevention in ageing adults in the region of Antwerp, Belgium.
The economic paradox observed in this exercise could be reduced with prevention adapted to age-specific groups and their health condition. The focus of prevention can be on different options like hospitalisation, bottleneck conditions in care delivery, strengthening primary care, or even the potential reduction of Anti-Microbial Resistance (AMR) with more vaccination. The point to highlight here is, given the heterogeneity of the situation, prevention strategies should be adjusted to that condition to be able to evaluate correctly the health gain obtained for the investment made. We should avoid mixing too much too many different options if they are not well focused and well specified [60, 61]. Often hospitalisation is a primary goal, but a silo view should be avoided for not being a reality assessment. Reducing hospital cost by reducing its access may cause healthcare problems elsewhere such as in homecare, ER, and the GPs. A model, such as the one presented here, is therefore helpful to indicate what may happen if the management scenario is changing the current way of handling. It may demonstrate better approaches of overall management with all the different delivery players involved.
SUMMARY
The main contribution of this exploratory modelling exercise is that it enables the joint evaluation of healthcare costs and QALY loss while preserving the heterogeneity of ageing populations. If that is well investigated at the levels of group composition, disease spread, and care delivery, it then allows to identify economic paradoxes of care if present which is a more delicate way to perform the economic analysis. The paradox index will then be helpful for decision makers to assess the right intervention strategy or combination of strategies in moving the paradox values to some target levels.
Author Contributions: Conceptualization: Baudouin Standaert and Anne-Marie De Cock; Methodology: Baudouin Standaert, Oleks Topachevskyi and Olivier Ethgen; Software: Baudouin Standaert and Oleks Topachevskyi; Validation: Ward Schrooten, Guido Van Hal and Anne-Marie De Cock; Formal Analysis: Baudouin Standaert and Oleks Topachevskyi; Investigation: Baudouin Standaert; Resources: Baudouin Standaert; Writing—Original Draft Preparation: Baudouin Standaert; Writing—Review and Editing: Ward Schrooten and Guido Van Hal; Visualization: Baudouin Standaert; Supervision: Anne-Marie De Cock; Project Administration: Baudouin Standaert.
All authors have read and agreed to the published version of the manuscript.
Funding: This research received no external funding.
Institutional Review Board Statement: Not applicable
Informed Consent Statement: Not applicable as it is a modelling study.
Data Availability Statement: Model developed is available and downloadable at https://hebo.digitalho. app/iframe/scenario/692d65db0bbd2fc2353120bb
Acknowledgments: The authors acknowledge the use of OpenAI’s ChatGPT as an editorial assistant during the revision of the manuscript. The tool was used to improve clarity, logical flow, and language. All scientific concepts, analyses, interpretations, and final manuscript content remain the responsibility of the authors.
Conflicts of Interest: Author Oleksandr Topachveskyi is employed by the company Digital Health Outcome. He participates in reviewing and designing the study. The company has no involvement in the study. The remaining authors declare that the research is conducted in the absence of any commercial or financial relationships that could be construed as a potential conflict of interest.
REFERENCES
- https://www.who.int/news-room/fact-sheets/detail/ageing-and-health].
- Sun X, Li X. Editorial: Aging and chronic disease: public health challenge and education reform. Front Public Health. 2023; 11: 1175898.
- Atella V, Piano Mortari A, Kopinska J, Belotti F, Lapi F, Cricelli C, et al. Trends in age-related disease burden and healthcare utilization. Aging Cell. 2019; 18: e12861.
- Quiros-Roldan E, Sottini A, Natali PG, Imberti L. The Impact of Immune System Aging on Infectious Diseases. Microorganisms. 2024; 12: 775.
- Weyand CM, Goronzy JJ. Aging of the Immune System. Mechanisms and Therapeutic Targets. Ann Am Thorac Soc. 2016; 13: S422–S428.
- Falcone M, Bauer M, Ferrer R, Gavazzi G, Gonzalez Del Castillo J, Pilotto A, et al. Biomarkers for risk stratification and antibiotic stewardship in elderly patients. Aging Clin Exp Res. 2023; 35: 925–935.
- Ragusa FS, Solimando L, Mandala C, Masnata R, Ciulla G, Ciriminna S, et al. Association between multidimensional prognostic index (MPI) and infections in a population of older people affected by COVID-19. Aging Clin Exp Res. 2023; 35: 1139–1143.
- Lee R, Mason A. Cost of Aging. Finance Dev. 2017; 54: 7–9.
- Yang Z, Norton EC, Stearns SC. Longevity and health care expenditures: the real reasons older people spend more. J Gerontol B Psychol Sci Soc Sci. 2003; 58: S2–S10.
- Jayawardhana T, Jayathilaka R, Nimnadi T, Anuththara S, Karadanaarachchi R, Galappaththi K, et al. The cost of aging: Economic growth perspectives for Europe. PLoS One. 2023; 18: e0287207.
- Tenhumberg B. Ignoring population structure can lead to erroneous predictions of future population size. Nature Education Knowledge. 2010; 3: 2.
- Standaert B, De Cock AM Do We Over - Or Underestimate the Overall Cost Burden of Infectious Diseases in Aging Adults?. Ann Public Health Res.2024; 11; 1129.
- OECD. The economic benefit of prooting healthy ageing and community care. Paris, France: OECD Publishing; 2025.
- Van Dorst P, Veijer C, Van der Velden A, Harper E, Butler C, Postma M, et al. From individual to public health impact: the burden of acute respiratory tratc infections. ISPOR EU; Barcelona, Spain: Value in Health; 2024; 27; S516.
- Van Baarle D, Bollaerts K, Del Giudice G, Lockhart S, Luxemburger C, Postma MJ, et al. Preventing infectious diseases for healthy ageing: The VITAL public-private partnership project. Vaccine. 2020; 38: 5896–5904.
- FOD B. For a healthy Belgium. 2023. [Available from: www. healthybelgium.be/en/]
- Bronselaer J, Demeyer B, Vandezande V, Vanden Boer L. Wat weten we (niet) over informele zorg in Vlaanderen? ; 2018.
- Tang B, Li Z, Hu S, Xiong J. Economic Implications of Health Care Burden for Elderly Population. Inquiry. 2022; 59: 469580221121511.
- Polniaszek S, Walsh E, Wiener J. Hospitalisations of nursing home residents: background and options. Washington, DC, USA: US DH&HS; 2011.
- Sancarlo D, Pilotto A, Panza F, Copetti M, Longo MG, D’Ambrosio P, et al. A Multidimensional Prognostic Index (MPI) based on a comprehensive geriatric assessment predicts short- and long-term all-cause mortality in older hospitalized patients with transient ischemic attack. J Neurol. 2012; 259: 670–678.
- Pilotto A, Cella A, Pilotto A, Daragjati J, Veronese N, Musacchio C, et al. Three Decades of Comprehensive Geriatric Assessment: Evidence Coming From Different Healthcare Settings and Specific Clinical Conditions. J Am Med Dir Assoc. 2017; 18: 192 e1– e11.
- Zora S, Leslie K, Guerrero Q, Veronese N, Ferri A, Boone ALD, et al. Implementation of the Selfy-MPI in 5 European countries: a multicenter international feasability study. Geriatric Care. 2019; 5: 8502.
- Pilotto A, Veronese N, Quispe Guerrero KL, Zora S, Boone ALD, Puntoni M, et al. Development and Validation of a Self-Administered Multidimensional Prognostic Index to Predict Negative Health Outcomes in Community-Dwelling Persons. Rejuvenation Res. 2019; 22: 299–305.
- De Cock AM, Strens D, Van Osta P, Standaert B. Infections and hospital bed-days among aging adults: A five-year retrospective study in a Belgian general hospital. Front Med Technol. 2022; 4: 912469.
- STATBEL. Belgium in figures. 2023. [Available from: statbe.fgov. be/en/themes/population/mortality-life-expectancy-and-causes-death/life-expectancy-and-life-tables#figures].
- Facon P. Blikvanger gezondheidszorg Algemene Ziekenhuizen. 2019. [Available from: https://www.health.belgium.be/sites/default/files/ uploads/fields/fpshealth_theme_file/blikvanger_gezondheidszorg_ az_v10.pdf.]
- Devos CC A, Lefevre M, Obyn C, Renard F. Performance of the Belgian health system, report 2019. Health Services research; 2019.
- Crevits H. Assistentiewoningen -evolutie vrg 534. In: Welzijn v, & gezin, editor. Brussels, Belgium: Vlaams Parlement; 2023.
- Gerkens S, Lefèvre M, Bouckaert N, Levy M, Maertens de Noordhout C, Obyn C, et al. Performantie van het Belgische gezondheidssysteem: rapport 2024. Brussles, Belgium: KCE; 2024.
- Stordeur S. Jaarstatistieken met betrekking tot de beoefenaars van gezondheidszorgberoepen in België. Brussles, Belgium: FOD; 2025.
- RIZIV I. Nomenclatuur van de geneeskundige verstrekkingen. 2023. [Available from: https://www.riziv.fgov.be/nl/nomenclatuur.]
- Hader A, Kose-Vogel N, Schulz L, Mlynska L, Hornung F, Hagel S, et al. Respiratory Infections in the Aging Lung: Implications for Diagnosis, Therapy, and Prevention. Aging Dis. 2023; 14: 1091–104.
- Zhang S, Wahi-Singh P, Wahi-Singh B, Chisholm A, Keeling P, Nair H, et al. Costs of management of acute respiratory infections in older adults: A systematic review and meta-analysis. J Glob Health. 2022; 12: 04096.
- Watson A, Wilkinson TMA. Respiratory viral infections in the elderly. Ther Adv Respir Dis. 2021; 15: 1753466621995050.
- Levine S, Marciniuk D. The global impact of respiratory disease. FIRS;2021.
- De Muylder G, Couvreur S, Stefani G, Brugerolles C, Dockx Y, Callies M, et al. Respi-Radar: a tool to monitor respiratory infections, Belgium, winter season 2023/24. Euro Surveill. 2025; 30; 2400756.
- Gerkens S, Lefèvre M, Bouckaert N, Levy M, Maertens de Noordhout C, Obyn C, et al. Performance of the Belgian Health System: report 2024. KCE; 2024: 376C.
- Charafeddine R, Demarest S, Drieskends F, Berete F. Gezondheidsenquête 2018: opname in het ziekenhuis. . Sciensano; 2020; Contract No: D/2020/14.440/10.
- DGGS-Gezondheidszorg. Ziekenhuisverblijven van patiënten van 65 jaar en ouder in 2019. Brussels, Belgium: FOD; 2020; 14.
- Mao Z, Li X, Korsten K, Bont L, Butler C, Wildenbeest J, et al. Economic Burden and Health-Related Quality of Life of Respiratory Syncytial Virus and Influenza Infection in European Community-Dwelling Older Adults. J Infect Dis. 2022; 226: S87–S94.
- Li X, Willem L, Johannesen CK, Urchueguia-Fornes A, Lehtonen T, Osei-Yeboah R, et al. Influential drivers of the cost-effectiveness of respiratory syncytial virus vaccination in European older adults: a multi-country analysis. BMC Med. 2025; 23: 170.
- Veronese N, Noale M, Cella A, Custodero C, Smith L, Barbagelata M, et al. Multidimensional frailty and quality of life: data from the English Longitudinal Study of Ageing. Qual Life Res. 2022; 31:2985–2993.
- Mattace-Raso F, Pilotto A. The challenge of the multifaceted prognosis in the older people and the Multidimensional Prognostic Index. Eur Geriatr Med. 2021; 12: 223–226.
- Pilotto A VN, Daragjati J, Cruz-Jentoft AJ, Polidori MC, Mattace-Raso F, Paccalin M, et al. MPI_AGE Investigators. Using the Multidimensional Prognostic Index to Predict Clinical Outcomes of Hospitalized Older Persons: A Prospective, Multicenter, International Study. J Gerontol A Biol Sci Med Sci. 2019; 74: 1643–1649.
- Standaert B, Ethgen O. Discounting health gain: a different view. J Mark Access Health Policy. 2023; 11: 2275350.
- Moore A, McKelvie S, Glogowska M, Lasserson D, Hayward G. Infection in older adults: a qualitative study of patient experience. Br J Gen Pract. 2020; 70: e312–e321.
- Terns Riera M, Prato R, Perez-Rubio A, Echave-Sustaeta JM, Verelst F, Gawade S, et al. Burden of Respiratory Syncytial Virus Among Older Adults With an Acute Respiratory Infection: A Prospective Study in Six European Countries. Clin Infect Dis. 2026; 82: e1266–e1276.
- Mogelmose S, Neels K, Beutels P, Hens N. Exploring the impact of population ageing on the spread of emerging respiratory infections and the associated burden of mortality. BMC Infect Dis. 2023; 23; 767
- Ethgen O, Standaert B. Population- versus cohort-based modelling approaches. Pharmacoeconomics. 2012; 30: 171–181.
- Bakas AT, Sewnaik A, van Straaten J, Baatenburg de Jong RJ, Mattace-Raso FUS, Polinder-Bos HA. The Multidimensional Prognostic Index as a Measure of Frailty in Elderly Patients with Head and Neck Cancer. Clin Interv Aging. 2021; 16: 1679–1689.
- Cruz-Jentoft AJ, Daragjati J, Fratiglioni L, Maggi S, Mangoni AA, Mattace-Raso F, et al. Using the Multidimensional Prognostic Index (MPI) to improve cost-effectiveness of interventions in multimorbid frail older persons: results and final recommendations from the MPI_ AGE European Project. Aging Clin Exp Res. 2020; 32: 861–868.
- Mindmanager. Guide to understanding tree diagrams 2025. [Available from: https://www.mindmanager.com/en/features/tree-diagram/]
- Jones CH, Dolsten M. Healthcare on the brink: navigating the challenges of an aging society in the United States. NPJ Aging. 2024; 10: 25.
- Abma LC, Timmermans RA, Yonker JE. Health congruence paradox in older adults: Contribution of cognition and relational visits. Geriatr Nurs. 2021; 42: 708–713.
- McKelvie S, Moore A, Croxson C, Lasserson DS, Hayward GN. Challenges and strategies for general practitioners diagnosing serious infections in older adults: a UK qualitative interview study. BMC Fam Pract. 2019; 20: 56.
- Schlepper LED. What has happened to state funded social care for older people?. 2023.
- Gonzalez-Gonzalez E, Requena C. Practices of Self-Care in Healthy Old Age: A Field Study. Geriatrics (Basel). 2023; 8; 54
- Kallestrup-Lamb M, Marin A, Menon S, Sogaard J. Aging populations and expenditures on health. The Journalof the economics of Ageing. 2024; 29: 100518.
- Shanmugam R. Why models are important in Healthcare. In: Shanmugan R, editor. Data-guided healthcare decision-making. Cambridge University Press: Cambridge University Press; 2023. 156–187.
- Standaert B, Rappuoli R. Towards a more comprehensive approach for a total economic assessment of vaccines?: 1. The building blocks for a health economic assessment of vaccination. J Mark Access Health Policy. 2017; 5: 1335162.
- Van Wilder L, Charafeddine R, Beutels P, Bruyndonckx R, Cleemput I, Demarest S, et al. Belgian population norms for the EQ-5D-5L, 2018. Qual Life Res. 2022; 31: 527–537.
APPENDIX A: DEMOGRAPHIC COMPOSITION WITH MPI-SCORES AND QALY VALUES
The table is split into 3 parts.
The first part indicates the demographic composition of the people in the Flemish County for the year 2023 by age-group, overall and by sex. It shows the higher proportion of women in the highest age-group which explains the higher longevity of women.
The second part indicates the proportional distribution by age and sex of the 4 MPI-groups (Zero(Z), Low (L), Moderate (M), High (H)). We arbitrary select the first number of 50% in men (internal consensus) and followed the assumption that the oldest age-group should have the highest proportion of H MPI scores. This classification helps to indicate the level of heterogeneity in the health condition by age and sex. The higher the MPI-score the higher the risk for infection with increased severity and disease duration.
The last part of the table indicates the base-line QALY-scores by age and sex as measured and reported by the KCE-study in 2018 (61).
|
Age-group |
Overall |
% |
Women |
% |
Men |
% |
|
|
A Young |
65-74 |
737,769 |
55% |
377,725 |
52% |
360,044 |
55% |
|
B Middle |
75-84 |
472,485 |
33% |
259,694 |
33% |
212,791 |
33% |
|
C Old |
85+ |
220,169 |
12% |
141,598 |
15% |
78,571 |
12% |
|
Total |
|
1,430,423 |
100% |
779,017 |
100% |
651,406 |
100% |
|
|
Male |
|
|
|
|
|
|
|
|
|
|
M MPI-Z |
M MPI L |
M MPI M |
M MPI H |
|
||||
|
|
No Com/No Frail/No disability |
Comorbid Minor/Prefrail/No disability |
Comorbid Major/Prefrail/ Disability |
Comorbid Major/Frail/ Disability |
|
||||
|
Age-group |
% |
N |
% |
N |
% |
N |
% |
N |
Sum |
|
Young |
50.00% |
180,022 |
44.00% |
158,419 |
5.50% |
19,802 |
0.50% |
1,800 |
360,044 |
|
Middle |
41.00% |
87,244 |
38.00% |
80,861 |
20.00% |
42,558 |
1.00% |
2,128 |
212,791 |
|
Old |
30.00% |
23,571 |
33.00% |
25,928 |
34.00% |
26,714 |
3.00% |
2,357 |
78,571 |
|
Total |
|
290,838 |
|
265,208 |
|
89,075 |
|
6,285 |
651,406 |
|
|
|
|
|
|
|
|
|
|
|
|
|
Female |
|
|
|
|
|
|
|
|
|
|
F MPI Z |
F MPI L |
F MPI M |
F MPI H |
|
||||
|
Young |
55.00% |
207,749 |
39.00% |
147,313 |
5.00% |
18,886 |
1.00% |
3,777 |
377,725 |
|
Middle |
46.00% |
119,459 |
35.00% |
90,893 |
16.00% |
41,551 |
3.00% |
7,791 |
259,694 |
|
Old |
33.00% |
46,727 |
31.00% |
43,895 |
30.00% |
42,479 |
6.00% |
8,496 |
141,598 |
|
Total |
|
373,935 |
|
282,101 |
|
102,917 |
|
20,064 |
779,017 |
|
|
|
|
|
|
|
|
|
|
|
|
|
Overall |
|
|
|
|
|
|
|
|
|
|
O MPI Z |
O MPI L |
O MPI M |
O MPI H |
|
||||
|
Young |
52.56% |
387,771 |
41.44% |
305,732 |
5.24% |
38,689 |
0.76% |
5,577 |
737,769 |
|
Middle |
43.75% |
206,704 |
36.35% |
171,753 |
17.80% |
84,109 |
2.10% |
9,919 |
472,485 |
|
Old |
31.93% |
70,299 |
31.71% |
69,824 |
31.43% |
69,194 |
4.93% |
10,853 |
220,169 |
|
Total |
46.47% |
664,773 |
38.26% |
547,309 |
13.42% |
191,991 |
1.84% |
26,349 |
1,430,423 |
|
|
QALY Health State |
Male |
|
||
|
|
MPI Z |
MPI L |
MPI M |
MPI H |
|
|
A |
0.89 |
0.87 |
0.86 |
0.85 |
|
|
B |
0.77 |
0.73 |
0.71 |
0.69 |
|
|
C |
0.68 |
0.62 |
0.59 |
0.56 |
|
|
|
|
|
|
|
|
|
|
QALY Health State |
Female |
|
||
|
|
MPI Z |
MPI L |
MPI M |
MPI H |
|
|
A |
0.84 |
0.82 |
0.81 |
0.80 |
|
|
B |
0.73 |
0.69 |
0.67 |
0.65 |
|
|
C |
0.65 |
0.59 |
0.56 |
0.53 |
|
|
|
|
|
|
|
|
APPENDIX B: COMPOSITION OF THE DASHBOARD
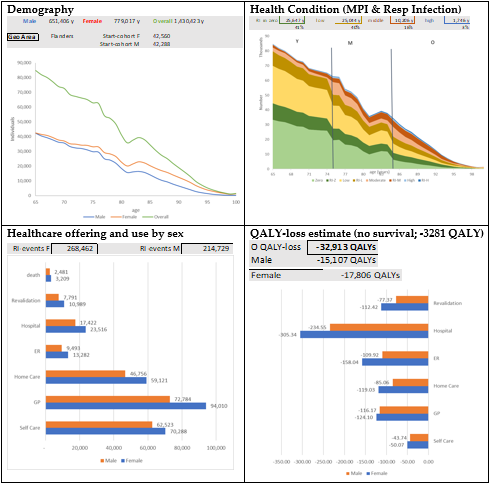
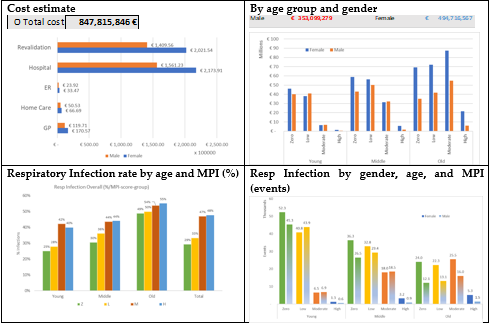
The dashboard is part of the AMAI-model. It regroups the essential descriptive information collected through the AMAI-disease model into different outcomes that help to understand the total disease burden of respiratory infection in the Flanders for the year 2023. We have the demography (age, sex, overall), the MPI-health condition, the resource use, the cost, and the QALY loss (excluding the survival impact), the disease distribution. This detailed information is also available on the downloadable website of the model:
https://hebo.digitalho.app/iframe/scenario/692d65db0bbd2fc2353120bb.
APPENDIX C: DECISION TREE USED PER PLACE, MPI-GROUP, AGE-GROUP, SEX.