Dynamics of Extracellular Polymeric Substances (EPS) Derived from Biofilm in On-Site Wastewater Filtration Reactors
- 1. Centre Scientifique et Technique du Bâtiment, Université de Limoges, France
- 2. Groupement de Recherche Eau, Sol et Environnement (GRESE), Université de Limoges, France
- 3. Centre Scientifique et Technique du Bâtiment, France
ABSTRACT
Extracellular polymeric substances (EPS) from biofilters (packed with river sand (RS) and crushed aggregate (CA)) set in on-site wastewater treatment systems are characterized over 360 days within bed thickness to investigate its correlation with the enrichment process. Biochemical component contents are monitored. Moreover, humic and protein-like compounds are characterized by means of Size Exclusion Chromatography (SEC) coupled with fluorescence. During the biomass enrichment phase, EPS biochemical components increase at the top of the biofilter (protein enrichment factor >70%). The protein-like components exhibit a very high MW fraction (apparent molecular weight (aMW) >1,000kDa), which may contribute to cell aggregation. Humic-like substances show similar SEC fingerprints to those of the feed water (aMW<6kDa) and are perhaps being metabolized at around Day 210 (as evidenced by a lower aMW). Only the dynamic polysaccharide partition in EPS differs between biofilters, with an increase for CA and a decrease for RS. Within the filtration bed thickness, lower biomass with a higher EPS content is observed, and the polysaccharide fraction increases by a factor of 2. Protein-like components exhibit a very high MW fraction at a lower magnitude. The clogging risk due to the presence of polysaccharides or their combination with high aMW extracellular proteins should be considered for alternative materials for onsite wastewater filtration system.
KEYWORDS
Packed bed filtration; Biofilm; EPS; Proteins; Humic-like substances; SEC; Fluorescence.
CITATION
Wang C, Bourven I, Baudu M, Lakel A (2018) Dynamics of Extracellular Polymeric Substances (EPS) Derived from Biofilm in On-Site Wastewater Filtration Reactors. Chem Eng Process Tech 4(2): 1055.
INTRODUCTION
The extracellular matrix of biofilm contains a "gel-like" structure. It is composed of major biochemical components which are either tightly or loosely bound to the cells, such as proteins, polysaccharides, humic-like substances [1,2], metabolic wastes, and absorbed substrates and minerals [3-5]. It is conceivable that intracellular material excretion is a survival mechanism under unfavorable conditions, such as enhanced extracellular enzymatic activity and/or other mechanisms which facilitate cell aggregation or surface attachment [6-8].
Protein and polysaccharide EPS contents had been tracked as potential indicators of the state of the biofilm: protein content increases with the formation and stability of aerobic granules [9], whereas Ahimou et al. [10], showed that the level of biofilm cohesive energy is strongly correlated with polysaccharide content. The humic-like substances (HS-like) are believed to be exogenous compounds captured in the biofilm before undergoing repolymerization [11]. However, Guo et al. [12], found that humic acid-like substances detected through three-dimensional spectrofluorimetry appear during aerobic granulation. Some authors have pointed out that these HS-like can form through another pathway: following the degradation of macromolecules under microbial attack (such as carbohydrates and proteins), the refractory compounds or biopolymers are selectively transformed to produce the high MW precursor of humin. The molecules then become smaller during the additional oxidation process [13].
In this study we want especially to follow the humic like substance and protein evolution of EPS component from biofilm involved in wastewater biotreatment and whose increase stops the bioprocess. In this we chose biofilm of biofilter from “on-site wastewater treatment systems” (OWTS) [14]. The structural characteristics of biofilm (i.e. the EPS matrix) take into account the environment of a porous medium and tend to further reduce the limited space between pores, until biofilm development reaches stabilization, which may "clog" porous media provided by river sand or other materials, e.g. polysaccharides [15,16].
Previous research on biofilms extracted from filtration reactors has mainly dealt with the biological clogging tied to biomass expansion and with the microbial community on the filter medium, i.e. total organic accumulation [15,17], including the main biofilm components. Proteins and polysaccharides exhibit a linear correlation with operating time and a decreasing abundance with depth [18]. It appears that among these organic compounds, the loose "slime-like" exopolymers may cause the observed drop in hydraulic conductivity, while the cells exert no visible effect on clogging [19,20]. From our knowledge, no studies have ever covered the evolution of EPS and especially humic substance), during long term (360 days) performance of filtration reactors, necessary period to exceed stationary state (after 210 days) regarding purification performance.
This study considered especially the evolution and stabilization of humic-like substances which are one of the major components of biofilm, but not always investigated in long term functioning of bioreactors, for wastewater treatment. For this study, two types of packing materials were used, river sand and crushed aggregate.
MATERIALS AND METHODS
Batch experiments (cylindrical filtration reactors)
Two filtration reactors, 70 cm high and 30 cm in diameter with sampling ports, were packed with river sand and crushed aggregate, respectively (Figure 1).

Figure 1: Filtration reactor with sampling ports
Septic effluent stored in a mixed tank with replenishment every 7 days was then fed to the reactors. These reactors were fed discontinuously, at a hydraulic loading rate of 12 cm/day in 10 daily batches. The feed-rest condition induces liquid passage, which may involve varying the O2 level. An optical oxygen sensor was used to estimate the O2 gas variations in each reactor (OXROB10, Fire Sting O2 , with Pyroscience sensor technology). A saturated/unsaturated gas phase alternation was found with the river sand reactor. However, the variation in oxygen gas was lower for the reactor with crushed aggregate.
Packing material characteristics The filter materials were analyzed before column packing, given that the river sand and crushed aggregate differed in composition and that they involved distinct treatment processes at the quarries. The two materials were studied and compared in terms of their respective particle distribution, mineralogical and physical characteristics. Their hydraulic and hydrodynamic properties were assessed using two post-packing filtration reactors [21] (Table 1).
Table 1: Characteristics of river sand (RS) and crushed aggregate (CA) when used as the main packing material.
|
Material |
River Sand (RS) |
Crushed aggregate (CA) |
|
Particle size distribution characteristics |
||
|
Effective size D10 (mm) |
0.38 |
0.17 |
|
Average diameter Dm (mm) |
0.82 |
1.36 |
|
Uniformity coefficient (D60/D10) |
2.8 |
10 |
|
Fine particles % (<0.08 mm %) |
0.40% |
5.00% |
|
Physical and chemical characteristics (average values; n=5) |
||
|
Real density (kg/m3) |
2525 (± 42) |
2438 (± 111) |
|
Porosity (%) [min; max] |
[30%; 33%] (± 1.5%) |
[38%; 41%] (± 1.7%) |
|
Specific surface area (m2/kg) |
4.04 |
2.78 |
|
Hydraulic characteristics (average values; n=5) |
||
|
Estimated hydraulic conductivity (m/s) [min, max] |
[8.25~9.53] × 10-4 |
[2.79~2.88] × 10-4 |
|
Water retention capacity after drainage (static water %) |
8.40% |
12.70% |
|
Hydraulic Residence Time (hours) (n=1) |
35 |
93 |
|
Variation of O2 gas level at 10 cm |
[11, 20]% |
[19.2, 19.8]% |
|
[min, max%] |
||
|
Mineralogical composition (mg/kg of material) |
||
|
Ca |
<5 |
795 |
|
Mg |
74 |
1535 |
|
Na |
<5 |
295 |
|
K |
1370 |
2356 |
Feed water: Septic effluent characteristics The feed water was collected from the septic effluent settling tank. All its major features were monitored throughout the operating period. The average and extreme values of each characteristic are reported in Table 2.
Table 2: Feed water characteristics.
|
Parameter |
Average value |
[min; max] |
|
pH (n=5) |
7.1 (± 0.3) |
[6.6; 7.5] |
|
TSS (mg/L, n=18) |
39 (± 11) |
[20; 66] |
|
VSS (mg/L, n=1) |
23 |
- |
|
COD (mgO/L, n=18) |
372 (± 100) |
[231; 572] |
Total biomass and EPS extraction
Three samplings and extractions were carried out on Days 60, 210 and 360 for the top layer of the medium. At the end of the operating period (i.e. 360 days), extractions were also performed on the various layers in the two filtration reactors (5 cm, 10-15 cm and 30 cm). The total biomass was extracted as quickly as possible (<24 h) both by heating to 80°C during 30 minutes for the colorimetric analysis (proteins, HS-like, polysaccharides and nucleic acids) and by sonication at 4°C during 60 minutes for the Size Exclusion Chromatography (SEC) fingerprint analysis [9,22]. The EPS was extracted by sonication at 4°C over 5 minutes for both the colorimetric and SEC fingerprint analyses. The nucleic acids were assessed with a series of increasingly long ultrasound extractions: after 5 minutes, the nucleic acid contents exhibited a significant increase within the filter media samples.
Total biomass, feed water and EPS characterization
The biochemical components of biomass, EPS and feed water were quantified through the colorimetric methods: proteins and humic-like (HS-like) substances using the modified Lowry method in introducing Folin's reagent [1]; polysaccharides using Dubois' method; and nucleic acids using Burton's method [23,24]. Nucleic acids are present to control EPS extraction (Liu et al., 2004). The EPS extracted during this study exhibited a relatively weak nucleic acid content, which suggests that this EPS was not contaminated by significant amounts of intracellular materials [25].
The apparent molecular weight (aMW) distributions of biomass proteins and humic substances were analyzed with High Pressure Size Exclusion Chromatography (HPSEC) (Merck Hitachi LA Chrom Chromatograph), coupled with fluorescence detection. The high molecular weight separation was performed with the Agilent column (BioSec, 300A, 5-1,250 kDa), while the low MW separation was executed with the BioSec 100A Agilent column (0.1-100kDa). All columns were placed in series for the separation improvement step [26]. The mobile phase was composed of a 150 mM NaCl and 50 mM phosphate buffer at pH 7.0. The MW were calibrated with six proteins or amino acids, with MW values of: 440000, 155000, 69323, 5777, 670, 362 and 181Da (matching respectively ferritine (Sigma), immunoglobulin G from human serum (Sigma), albumin from bovine serum (Sigma), insulin from porcine pancreas (Fluka), thyroglobulin, thyrotropin-releasing hormone (Fluka), and tyrosine (Fluka)). The logarithm of molecular mass (Log (MW)) was plotted as a function of the elution volume (mL) for the mass calibration curves, i.e.:
Log (MW) = -0.3164 Ve + 9.4676 (R2 = 0.982)
Where, MW is the molecular weight (Da), and Ve is the elution volume (mL). The permeation volume determined with NaN3 equaled 22 mL. The Excitation/Emission (Ex/Em) wavelength fluorescence detection for protein-like (protein tryptophanlike) substances was found to be 222/330 nm, while the value for humic-like substances (HS-like) reached 350/460 nm. These wavelengths were derived with the Shimadzu RF-5301 PC spectrofluorometer. The two coupled Ex/Em wavelengths corresponded to the maximal fluorescence in the protein tryptophan-like and HS-like, as defined by Chen et al. [27].
The chromatograms were established from both fluorescent intensity (volts) and elution volume (mL). Several fractions were identified as the elution volume interval (e.g. 12~18 mL). The fractional area percentage calculation was based on the ratio of the chromatogram area of one fraction to the total chromatogram area. This calculation was performed using the Origin 6.0 software package. The fractional (F) area percentage is defined as follows:
F% = 100 × Area of fraction/Total area of chromatogram
RESULTS AND DISCUSSION
Evolution of EPS biochemical characteristics vs. operating time
Biochemical composition: The evolution of EPS percentages in the biomass extracted from the top layer of each filtration reactor on Days 60, 210 and 360 is presented in Table 3 (Part 1).
Table 3: Biomass evolution and EPS percentages in the biomass extracted from
the top layer of each filtration reactor on Days 60, 210 and 360 (Part 1) and extracted from bed thicknesses on Days 360 (Part 2).
Part 1: Evolution of biomass and EPS% from biomass extracted from the top layer of each filtration reactor on Days 60, 210 and 360
|
Material |
River sand (RS) - top layer |
Crushed aggregate (CA) - top layer |
||||
|
Time |
60 days |
210 days |
360 days |
60 days |
210 days |
360 days |
|
Biomass (mg/kg) |
96 |
238 |
303 |
123 |
141 |
251 |
|
EPS% |
16 |
9 |
30 |
21 |
17 |
32 |
During the implementation process, total biomass increased in the two materials, by factors of 3 and 2 for RS and CA respectively. It is noticed that stationary state of the biomass growth is not achieved yet for two reactors and especially for CA (slowdown state for RS) (Figure 2).

Figure 2: Evolution in biochemical component quantities of biomass and extracted EPS vs. time in both river sand (RS) and crushed aggregate (CA)
This biomass is mostly correlated with protein content: r2 are0.97 and 0.94 for RS and CA, respectively (and only 0.96 and 0.75 for humic substance; 0.81 and 0.83 for polysaccharides). According to Di Iaconi et al. [28], protein serves as the biomass activity indicator. Nevertheless Regusa et al. [18], shown that polysaccharides also exhibit a linear correlation (r2 =0.99) under operating time of only 120 days in subsurface wetland reactors fed with fill and draw cyclic sequence. EPS % increases with time to reach around 30 % of the total biomass at day 360 for the two biofilters. There is no correlation with biomass increase (lower EPS% at Day 210 than at Day 60) during the 360 days (Table 3, Part 1). Whether EPS production reflects higher or lower microbial activity is still open to debate, although it is usually reported that during the exponential growth phase, EPS content increases with time and yet decreases once the stationary phase has been reached [29]. Previous studies also pointed out that the presence of extracellular macromolecules engaged in the process of cell adhesions onto the mineral surface by involving much more complex adhesion behavior [7]. Both EPS percentages exhibit a slight decrease between Days 60 and 210 (Table 3, Part 1).This decrease is simply due to the drop in HS-like substances (Figure 2) from 7.1 to 5.9 mg/kg material in RS and from 15.1 to 7.1 mg/kg material in CA. Humic substances, which are generated from effluent, do not get synthesized The hypothesis may thus be advanced that biofilm selectively adsorbed humic-like compounds from the feed water which is mostly composed with humic substance (21, 62 and 17 % of protein, humic substance and polysaccharides) at a different developmental state, and/or that the HS-like degradation (catabolism) took place in the biofilm not yet at stationary state (at day 210) [13,30].
Nonetheless, the biomass EPS percentage remains somewhat higher for CA, especially at the beginning of the implementation process (Table 3, Part 1). At this same time, a higher biomass increase for RS than for CA is unveiled. The biomass content evolution could be due to a specific surface area higher for RS than for CA (Table 1) or to a higher speed of development. As observed in the material characteristics (Table 1), the CA reactor displays an extended hydraulic residence time and water retention capacity, both of which may due to its fine particle content. The static liquid phase may lead to microenvironments with a weak renewal of nutrients and/or accumulated residues. The hydraulic and hydrodynamic variations could result in low biomass activity (i.e. total protein content in CA) but in a high proportion of EPS in the reduced biomass (as is the case with CA). This low substrate content could favor EPS synthesis [31,32]. Starvation would be the preferred hypothesis over hydrodynamic influence for the increase in EPS content from aerobic granules growing on a zeolite material biofilter [28]. Moreover, changes in environmental conditions could induce a shift in microbial community and/or activity and, subsequently, more EPS-producing content [6,31]. Throughout the entirety of the process, total -N removal (%) was greater for RS than for CA (by a factor of 1.5), which means that denitrifying bacteria are less active or less numerous in the CA biofilter. Previous study concluded that the bacterial retention in saturated porous media is the combined results of various factors, such as solution ionic strength, flow velocity, grain size and surface roughness [33].
The evolution in biochemical component quantities of extracted EPS and biomass over time in both river sand (RS) and crushed aggregate (CA) suggests that the evolution in extracellular biochemical components undergoes the same process for both materials. Enrichments were pointed in: PN (proteins)-like (with growth factors of 19 and 3 for RS and CA, respectively), HSlike (by factors of 5 and 2 for RS and CA, respectively), and PS (factors of 3 and 5, respectively). The majority of organic matter in an extracellular matrix is composed of proteins and humic compounds which are found in greater proportions in active sludge [1]. Zhang et al. [9], observed that the stability of aerobic granules during biofilm granulation is mediated by PN, while for Ahimou et al. [10], cohesiveness is correlated with PS.
When comparing the evolution of proportions in biochemical components, this same trend is identified with increasing PN percentages (RS: 10~33%; CA: 24~31%) and decreasing HS like (RS: 47~43%; CA: 50~33%). Zhang et al. [9], described such enrichment in PN of EPS content during the formation of aerobic granules and suggested that an increase in PN might enhance neighboring microbial cells and form a cross-linked network by attracting organic and inorganic material [6]. However, the percentage of PS (polysaccharides) becomes inverted, with an increase (18~33%) and decrease (30~18%) for CA and RS, respectively. Hence it follows that, EPS in biofilm does not necessarily develop similarly on two different filter materials, this is especially detectable after long time of process (360 days). The difference in EPS biochemical composition may be explained by the differing conditions generated in the materials, i.e. porosity (both external and internal), fine particle contents and reactor hydrodynamics. Moreover, the mineralogical composition (Table 1) differs substantially with crushed aggregate: higher calcium content leads to a greater presence of divalent cations at the material surface, with the possibility that divalent cations bind with extracellular PS-alginate-like via an ionic link, thus resulting in a complex "egg-box" configuration [34,35]. Stabilized PS are less influenced by effluent and/or less metabolized.
Studies showed that proteins possessed high molecular weights (45-670 kDa) and may be associated with other macromolecules, such as polysaccharides [26,36], which has been reported causing the clogging in pilot study of sand filter during 95 days of operating [37], and in real scale study of a septic system during 10 months [20]. As mentioned above, the polysaccharides proportion in EPS was enhanced in CA biofilter. Thus a hypothesis may be dawn that with the presence of high aMW proteins-like macromolecules and polysaccharides, the porous media constructed by such filter material might be exposed to the clogging risk for long term operating periods.
In light of the above discussion, similar trends can be observed for PN- and HS-like, as recorded in both materials. A follow-up qualitative comparison of PN-like and HS-like substances was conducted by examining the MW distribution.
Protein and HS-like HPSEC fingerprints: In examining the major biofilm components, a further qualitative study on the apparent molecular weight (MW) distribution by HPSEC fingerprints of protein-like substances between filter materials will be described, and the chromatogram displayed in Supplementary data (S1).
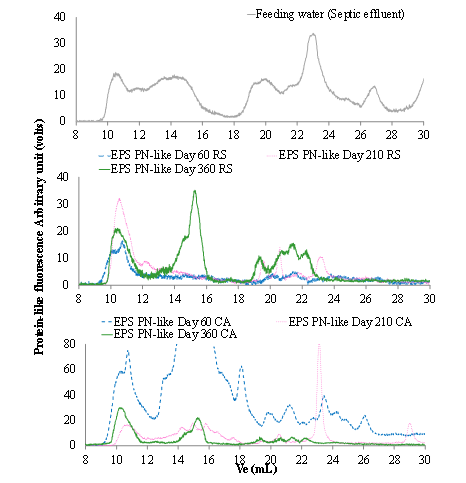
S1: HPSEC fingerprints of protein-like substances of extracted EPS from filter materials vs. time, comparing to protein-like substances extracted from feed water
Moreover, the fractional area percentages are presented in Figure 3.

Figure 3: Percentage of areas for PN-like fingerprint fractions of the EPS extractedfrom RS and CA during the operating period.
As observed in the PN-like fingerprints their peak number and elution volume differ with incubation time, as well as with the one of feed water PN-like compounds. This finding indicates that various molecular structures have developed as a result of biomass enrichment. Similarly, in Figure 3, the increase in the very high MW (VHMW, aMW ≥ 1000kDa) fraction and decrease in the very low MW (VLMW, aMW<6 kDa) fraction of PN-like fingerprints were noted in both filter materials after 60 days of operations. This MW distribution shift may be due to the production of new PN-like and their polymerization with other organic molecules during the enrichment step [38]. Since extracellular proteins contain a considerable amount of enzymes, it is assumed that the extracellular enzymatic activity might change with the increased biofilm implementation activity. This increase in the VHMW fraction may be correlated with the aggregation of bacteria in biofilm during biomass enrichment.
The RS showed a relatively stable evolution in fractional area percentages from Day 60 to Day 210. A decrease in the VHMW fractional proportion, coupled with an increase in the low MW (LMW, 25 kDa
Thus the presence of, very high or low aMW proteinslike macromolecules have been confirmed for both materials. However along with the increasing polysaccharides proportion in EPS, such as the case of CA, might be an indication of further clogging development risk for long term operating biofilters.
The HS-like fingerprints of the EPS extracted from the two materials were also described from Day 60 to Day 360 (Figure 4).
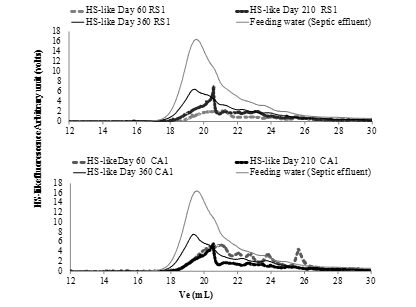
Figure 4: Evolution in HS-like fingerprints of extracted EPS and biomass vs. timein both river sand (RS) and crushed aggregate (CA).
As mentioned in the previous section, it was confirmed that HS-like possessed weak MW (<6 kDa) on Day 360 in both materials. The majority fraction (i.e. major peak) varied similarly between the two filter materials over the operating period. The small peaks located between 20 and 22 mL on Day 60 had moved to between 20 and 21 mL by Day 210 and were positioned at 20 mL on Day 360. It must be noted, however, that for CA in particular, the area under peak evolution exhibited the same trend as the HSlike content observed in Figure 4 over time. During this process, the aMW of HS-like increased. As previously stated, it is possible that the HS-like first absorbed in the biofilm might thus be the humic compounds of very weak MW or the HS-like modified by the biofilm. Furthermore, the HS-like fingerprints of EPS in both materials were similar to those of the feed water. During the first process interval, either: i) in considering the hypothesis of selective adsorption of HS-like from the effluent, smaller molecules are perhaps more easily and quickly adsorbed onto the biofilm; or ii) in considering the hypothesis of metabolism of HS-like by cells, HS-like from the environment are no longer used after implementation (hence they are no longer being degraded).
Evolution of EPS biochemical composition with bed thickness
To observe the impact of packing materials on biofilm evolution in the deeper sections of the filtration reactors, (i.e. where the environment differs from that of the top layer and is less rich in substrates), a follow-up study of the vertical EPS distribution in filtration beds with different filter materials was conducted after 360 days of operations, using the same analytical tools.
Biochemical composition: The evolution of biomass and EPS percentages in the biomass extracted from layers 0-2 cm, 5 cm, 10-15 cm and 30 cm in each biofilter on Day 360 (as calculated from the data available in Figure 5)

Figure 5: Biochemical composition of the biomass and EPS extracted from RS and CA in different filtration bed layers.
is shown in Table 3 (Part 2).
Part 2: Evolution of biomass and EPS% from biomass extracted
over the depth of each reactor at Day 360
|
Material |
River sand (RS) on Day 360 |
Crushed aggregate (CA) on Day 360 |
||||||
|
Depth (cm) |
0-2 cm |
5 cm |
10-15 cm |
30 cm |
0-2 cm |
5 cm |
10-15 cm |
30 cm |
|
Biomass (mg/kg) |
303 |
169 |
125 |
45 |
251 |
166 |
71 |
63 |
|
EPS% |
30 |
25 |
27 |
39 |
32 |
30 |
44 |
37 |
The biomass in both materials decreased with filter medium depth. Moreover, a higher biomass in RS from the top to the 10-15 cm layer and a lower biomass at 30 cm compared to CA were observed. This same trend had been identified for both types of material packing: increasing EPS percentage in biomass, coupled with a declining biomass over the depth. The EPS percentage remained constant in the same layer and on the same order of magnitude for both materials: about 30% for the top and increasing with depth (up to 38%).
The biomass also decreased with depth due to the presence of fewer cells when a smaller portion of the substrate had penetrated into the depth. As per the previous study (EPS vs. time of evolution process), total biomass components appeared in higher contents from the top to the 10-15 cm layer in RS than in CA. EPS components showed a similar scale, except with a slightly greater number of polysaccharides in CA. Above this level, the increase in EPS percentage compared to its total biomass over the filter medium depth could be due to: i) the downward shift through the depth of the weakly bound soluble EPS; ii) the reduced substrate and/or bacteria community shift (more nitrifying bacteria, which are autotrophic); and iii) a new C/N ratio over the deeper part of the beds. Gao et al. [31], also described how nitrifiers (which appeared due to the new C/N ratio) tend to produce more EPS than heterotrophs within the upper media of an aerobic biofilter. Moreover, as is expected with depth in our study, a low C/N ratio was reported by Durmaz et al. [39], to induce a low EPS content when compared with a ratio of 40. The fine particles in CA should be more noticeable over the depth than in the top layer, which may also lead to a higher EPS percentage by structurally influencing the biofilm [40].
There were modifications in biochemical component proportions in the deeper part of the filtration beds (Figure 6, 30 cm).
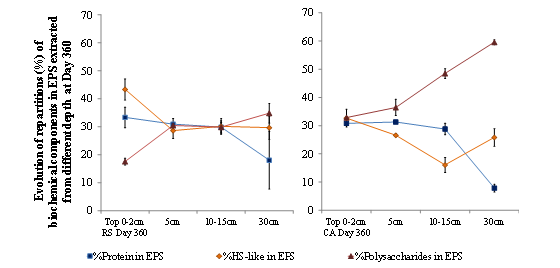
Figure 6: Biochemical component proportions of the EPS extracted from RS and CA in different filtration bed layers at Day 360.
CA revealed lower quantities of EPS in proteins than in polysaccharides (in both absolute and relative fractions), with the PN/PS ratio decreasing from 1 in the top layer to 0.1 at 30 cm. For the RS material, PN/PS ratios were typically higher, with a value of 2 in the top layer, around 1 from 5 to 15 cm and 0.5 at 30 cm. In deeper parts of the filtration beds, bacteria feature less substrate. Furthermore, the proportions of polysaccharides in EPS, which increase with medium depth in CA and RS, might be due to the lower accessibility of nutrients (starvation)or to the change in bacterial community, for example, the nitrifying bacteria are considered more in the lower part of filter where the COD is less concentrated, or also to a new C/N ratio in the substrate, or yet to various physical environments [6,28,41]. However, Durmaz et al. [39], demonstrated that a lower C/N ratio induces an increase in PN content and a decrease in PS content.
Vertical evolution of proteins and HS-like fingerprints: The MW evolution of PN-like compounds in the 10-15 cm and 30 cm depths was also studied by means of HPSEC fingerprints. Presented in Supplementary data (S2),

S2: HPSEC fingerprints of protein-like substances of extracted EPS from filter materials vs. bed thickness.
these results show similar fractions of PN-like EPS to those in the top layer. Moreover, the four major fractions were identified as in Figure 3. The corresponding fractional percentage calculations are shown in Figure 7.

Figure 7: Area percentages of PN-like fingerprint fractions of the EPS extracted from RS and CA over the various filtration bed depths.
For both materials, the 10-15 cm and 30 cm layers exhibited a lower percentage of VHMW and HMW fractions, and yet it also showed a higher percentage of LMW and VLMW fractions, which indicates that fewer high MW PN-like polymers were formed in the lower part of the filters. These low aMW compounds (<6 kDa) may be amino acid-like, small peptide-like or molecules of similar configurations conveyed by the feed water, and then transported and absorbed onto the deep medium. The LMW and VLMW fractions may also be associated with low MW PN-like molecules, resulting from substrate degradation through the metabolism of microorganisms [42].
The HS-like fingerprint evolution over the depth of two materials was also compared and summarized in Figure 8.

Figure 8: HS-like HPSEC fingerprints of EPS extracted from RS and CA at various depths on Day 360, and the HS-like fingerprint of feed water.
These fingerprint chromatograms reveal shapes similar to the two filter materials and feed water which suggests that, HS-like compounds stem from the retention of exogenic organic matter. The HS-like fingerprints also display overlapping peaks with the 10-15 cm and 30 cm samples of both materials. Moreover, they indicate that HS-like may be captured from the feed water and distributed relatively homogeneously inside the filter medium, despite the fact that the types of filter materials and these exogenic HS-like compounds possess similar and low MW (< 6 kDa).
CONCLUSION
This paper has sought to provide in-depth information regarding the EPS extracted from a biofilter at various enrichment stages during a 360-dayperiod and for different bed thicknesses. Two types of packing materials were used (river sand and crushed aggregate) and a series of quantitative and qualitative analysis were conducted to investigate the differences in EPS characteristics especially for proteins-like and humic substanceslike components. The following conclusions could be drawn:
Overall, the percentages of EPS in biomass increase with biomass enrichment, despite a decrease due to humic-like substances from Day 210. Even though the stationary state of purification performance was reached for both biofilters, the biomass evolved with changing repartitions of proteins, humic substances and polysaccharides in EPS till the end of the operating. During biomass enrichment, the humic-like substance/ protein ratio decreases. Meanwhile, within the bed thickness, the polysaccharide/protein ratio rises by Day 360. Moreover, a correlation between the higher percentage of polysaccharide in EPS and an environment less favorable for microorganisms potentially found in the CA biofilter was proposed. The packing material mineral characteristics do affect polysaccharide implementation in EPS, considering that divalent cations were released with CA
A clear difference was noticed in the SEC protein-like fingerprints during biomass enrichment, in terms of both intensity and numbers of peaks. This finding indicates that diverse molecular structures have developed as a result of the enrichment process. A variation was also shown in the four fractional distributions (i.e. very high: aMW ≥ 1000 kDa; high: 109 kDa<aMW<1000 kDa; low: 25 kDa<aMW<109 kDa and very low MW: <6 kDa). While decreasing, the high MW fraction can reveal bacterial growth and aggregation in the biofilm. An increase in the very high MW fraction may be correlated with bacterial adhesion onto mineral surface, which might lead to the clogging of pores due to the accumulation of extracellular macromolecules. Within the bed depths, the very high MW fraction decreases, thus suggesting less aggregation. This fraction decreases after Day 210, but only for the RS material, which is perhaps connected to a more mature biofilm.
The SEC fingerprint applied with detection for HS-like also provided valuable information. It was shown that the HS-like from EPS have weak MW and result from the adsorption of feed water, perhaps initiated either by the preference for smaller humic molecules (aMW<720 Da) or by an HS-like molecule being metabolized by biofilm cells at the beginning of the process (up to 210 days). On Day 360, HS-like SEC fingerprints are the same as those from the feed water (aMW<6 kDa) in the biofilter.
The clogging risk, also have been noticed for crushed aggregates with the increasing polysaccharides proportion in EPS and the presence of high aMW proteins-like macromolecules. The application of this type of material for long term biofilters should consider the biochemical formation characteristics besides the physical characteristics of materials, such as the effective size or uniform coefficient.
REFERENCES
- Frølund B, Palmgren R, Keiding K, Nielsen PH. Extraction of extracellular polymers from activated sludge using a cation exchange resin. Water Res. 1996; 30: 1749-1758.
- Flemming HC, Wingender J. Relevance of microbial extracellular polymeric substances (EPSs)--Part I: Structural and ecological aspects. Water Sci Technol. 2001; 43: 1-8.
- Wingender J, Neu TR, Flemming HC. Microbial extracellular polymeric substances: characterization, structure, and function. Springer Science & Business Media. 1999.
- Tsai BN, Chang CH, Lee DJ. Fractionation of soluble microbial products (SMP) and soluble extracellular polymeric substances (EPS) from wastewater sludge. Environ Technol. 2008; 29: 1127-1138.
- D’Abzac P, Bordas F, Joussein E, Van Hullebuch E, Lens PNL, Guibaud G. Characterization of the mineral fraction associated to extracellular polymeric substances (EPS) in anaerobic granular sludges. Environ Sci Technol. 2010b; 44: 412-418.
- Liu YQ, Liu Y, Tay JH. The effects of extracellular polymeric substances on the formation and stability of biogranules. Appl Microbiol Biotechnol. 2004; 65: 143-148.
- Kim HN, Hong Y, Lee I, Bradford SA, Walker SL. Surface characteristics and adhesion behavior of Escherichia coli O157:H7: role of extracellular macromolecules. Biomacromolecules. 2009; 10: 2556-2564.
- Kim HN, Walker SL, Bradford SA. Macromolecule mediated transport and retention of Escherichia coli O157:H7 in saturated porous media. Water Res. 2010; 44: 1082-1093.
- Zhang L, Feng X, Zhu N, Chen J. Role of extracellular protein in the formation and stability of aerobic granules. Enzyme Microb Technol. 2007; 41: 551-557.
- Ahimou F, Semmens MJ, Haugstad G, Navak PJ. Effect of Protein, Polysaccharide, and Oxygen Concentration Pro?leson Bio?lm Cohesiveness. Appl Environ Microbiol. 2007; 73: 2905-2910.
- Francioso O, Sánchez-Cortés S, Casarini D, Garcia-Ramos JV, Ciavatta C, Gessa C. Spectroscopic study of humic acids fractionated by means of tangential ultrafiltration. J Mol Struc. 2002; 609: 137-147.
- Guo F, Zhang SH, Yu X, Wei Bo. Variations of both bacterial community and extracellular polymers: the inducement of increase of cell hydrophobicity from biofloc to aerobic sludge. Bioresour Technol. 2011; 102: 6421-6428.
- VanLoon GW, Duffy SJ. Environmental Chemistry: a Global Perspective. Oxford University Press. 2005; 258-259.
- Donlan RM, Costerton JW. Biofilms: survival mechanisms of clinically relevant microorganisms. Clin Microbiol Rev. 2002; 15: 167-193.
- Zhao L, Zhu W, Tong W. Clogging processes caused by biofilm growth and organic particle accumulation in lab-scale vertical flow constructed wetlands. J Environ Sci (China). 2009; 21: 750-757.
- Kim JW, Choi H, Pachepsky YA. Biofilm morphology as related to the porous media clogging. Water Res. 2010; 44: 1193-1201.
- Campos LC, Su MF, Graham NJ, Smith SR. Biomass development in slow sand filters. Water Res. 2002; 36: 4543-4551.
- Ragusa SR, McNevin D, Qasem S, Mitchell C. Indicators of biofilm development and activity in constructed wetlands microcosms. Water Res. 2004; 38: 2865-2873.
- Vandevivere P, Baveye P. Effect of bacterial extracellular polymers on the saturated hydraulic conductivity of sand columns. Appl Environ Microbiol. 1992; 58: 1690-1698.
- Ronner BA, Lee Wong AC. Characterization of microbial clogging in wastewater infiltration systems. The On-site wastewater treatment proceedings of the 8th national symposium on individual and small community sewage systems. 1998.
- Liénard A, Guellaf H, Boutin C. Choice of the sand for sand filters used for secondary treatment of wastewater. Water Sci Technol. 2001; 44: 189-196.
- Bhatia D, Bourven I, Simon S, Bordas F, van Hullebusch ED, Rossano S, et al. Fluorescence detection to determine proteins and humic-like substances fingerprints of exopolymeric substances (EPS) from biological sludges performed by size exclusion chromatography (SEC). Bioresour Technol. 2013; 131: 159-165.
- Burton K. A study of the conditions and mechanism of the diphenylamine reaction for the colorimetric estimation of deoxyribonucleic acid. Biochem J. 1956; 62: 315-323.
- Dubois M, Gilles KA, Hamilton JK, Rebers Pt, Smith F. Colorimetric method for determination of sugars and related substances. Anal Chem. 1956; 28: 350-356.
- Comte S, Guibaud G, Baudu M. Extraction of extracellular polymers (EPS) from activated sludge. Part I. Comparison of eight EPS extraction methods. Enzyme Microb Tech. 2006; 38: 237-245.
- Bourven I, Simon S, Bhatia D, van Hullebusch ED, Guibaud G. Effect of various size exclusion chromatography (SEC) columns on the fingerprints of extracellular polymeric substances (EPS) extracted from biological sludge. J Taiwan Inst Chem Eng. 2015. 49: 148-155.
- Chen W, Westerhoff P, Leenheer JA, Booksh K. Fluorescence excitation-emission matrix regional integration to quantify spectra for dissolved organic matter. Environ Sci Technol. 2003; 37: 5701-5710.
- Di Iaconi C, Ramadori R, Lopez A, Passino R. In?uence of hydrodynamic shear forces on properties of granular biomass in a sequencing batch bio?lter reactor. Biochem Engineer J. 2006; 30: 152-157.
- Jia SX, Fang HH, Furumai H. Surface charge and extracellular polymer of sludge in the anaerobic degradation process. Water Sci Technol. 1996; 34: 309-316.
- Volk CJ, Volk CB, Kaplan LA. Chemical composition of biodegradable dissolved organic matter in stream water. Limnol Oceanography. 1997; 42: 39-44.
- Gao B, Zhu X, Xu C, Yue Q, Li W, Wei J. Influence or extraellular polymeric substances on microbial activity an cell hydrophobicity biofilm. J Chem Technol Biotechnol. 2008; 83: 227-232.
- Nichols CM, Garon S, Bowman JP, Raguénès G, Guézennec J. Production of exoplysaccharides by Antartic marine bacterial isolates. J Appl Microbiol. 2004; 96: 1057-1066.
- Kim HN, Walker SL, Bradford SA, Dixon D, Tufenkji N, Emelko MB. Coupled factors influencing the transport and retention of Cryptosporidium parvum oocysts in saturated porous media. Water Res. 2010; 44: 1213-1223.
- Sobeck DC, Higgins MJ. Examination of three theories for mechanisms of cation-induced bioflocculation. Water Res. 2002; 36: 527-538.
- Lin Y, De Kreuk M, van Loosdrecht MC, Adin A. Characterization of alginate-like exopolysaccharides isolated from aerobic granular sludge in pilot-plant. Water Res. 2010; 44: 3355-3364.
- Görner T, de Donato P, Ameil MH, Montarges-Pelletier E, Lartiges BS. Activated sludge exopolymers: separation and identification using size exclusion chromatography and infrared micro-spectroscopy. Water Res. 2003; 37: 2388-2393.
- Pell M, Nyberg F. Infiltration of Wastewater in a Newly Started Pilot Sand-Filter System: II. Development and Distribution of the Bacterial Populations. J Environ Qual. 1989b; 18: 457-462.
- Ras M, Lefebvre D, Derlon N, Paul E, Girbal-Neuhauser E. Extracellular polymeric substances diversity of biofilms grown under contrasted environmental conditions. Water Res. 2011; 45: 1529-1538.
- Durmaz B, Sani SD. Effect of carbon to nitrogen ratio on the composition of microbial extracellular polymers in activated sludge. Water Sci Technol. 2001; 44: 221-229.
- Vieira MJ, Melo LF. Effect of clay particles on the behavior of biofilms formed by Pseudomonas fluorescence. Water Sci Technol. 1995; 32: 45-52.
- Tian HL, Zhao JY, Zhang HY, Chi CQ, Li BA, Wu XL. Bacterial community shift along with the changes in operational conditions in a membrane-aerated biofilm reactor. Appl Microbiol Biotechnol. 2015; 99: 3279-3290.
- Ni JB, Rittmann BE, Yu HQ. Soluble microbial products and their implications in mixed culture biotechnology. Trends Biotechnol. 2011; 29: 454-463.


