Estimation of Activated Carbon Fiber (ACF) Adsorption Capacity and Breakthrough Times using a Predictive Model
- 1. Industrial Hygienist/Project Manager, HGS Engineering Inc, USA
- 2. Department of Environmental Health Sciences, University of Alabama at Birmingham, USA
ABSTRACT
Activated Carbon Fiber (ACF) has properties that make it a great candidate as a sorbent in respirators against Volatile Organic Compounds (VOCs). Adsorption properties of ACF relevant for the determination of the potential service life, such as breakthrough time and adsorption capacity have been determined experimentally for a number of commercially available ACFs and selected sorbates. However, in order to reduce time and labor intensive testing, we examined here if inputs from an adsorption isotherm equation (Dubinin-Radushkevich or D-R) can be used to predict ACF adsorption capacity and breakthrough time without performing breakthrough experiments. Two rayon-derived ACFs [ACFF 1800 and ACFF 2000] were assessed in this study using toluene, hexane and methyl ethyl ketone (MEK) as adsorbates. Theoretical breakthrough times obtained from D-R isotherm inputs and applying the Wheeler-Jonas equation were obtained and compared with experimental breakthrough times. In general, breakthrough time predictions aligned well with our experimental results. Our data shows that 10% calculated breakthrough times exceeded experimental data in all but three instances. However, the differences between these times were lower than 4.2 minutes and 9.3 minutes for ACFF 1800 and ACFF 2000, respectively when challenged by all three adsorbates. Further research would ideally look at a greater range of concentrations and adsorbate classes and develop necessary correction factors.
KEYWORDS
Activated Carbon Fiber; Volatile Organic Compounds; Adsorption
CITATION
Osterbind MS, Oh J, Lungu CT (2023) Estimation of Activated Carbon Fiber (ACF) Adsorption Capacity and Breakthrough Times using a Predictive Model. Chem Eng Process Tech 8(1): 1073.
INTRODUCTION
Activated carbon in the granular form is the most common adsorbent for vapor phase volatile organic compounds (VOCs) in respirator cartridges [1]. However, activated carbon in the fiber form (ACF) has properties that make it a potential alternative adsorbent in the context of worker respiratory protection. Unlike a loose, granular adsorbent, ACF is easy to contain and is less prone to dust attrition than granular activated carbon (GAC) [2]. ACF is made from polymer fibers that have been carbonized at high temperatures and activated with carbon dioxide or steam [3] . ACF is highly porous and derives a large proportion of its internal surface area from micropores. ACF microporosity is also concentrated at the fiber surface, shortening gas diffusion distances and promoting rapid adsorption [4]. Several studies have investigated the properties of ACF relevant to respiratory protection applications [5-8]. In these studies experimental breakthrough concentration curves were obtained for various sorbate/sorbent pairs to obtain adsorption capacity of commercially available ACF types. However, experimental determination of breakthrough time, as a measures of respirator service life is labor intensive and time consuming. Alternatively, an adsorption isotherm model, which describes the equilibrium behavior of the adsorbent/adsorbate can be employed to estimate the capacity of a microporous sorbent for a particular adsorbate without experimental data.
The Dubinin-Radushkevich (D-R) isotherm equation is the most widely used model for predicting adsorption capacities of granular activated carbons (GAC) used in organic vapor respirator cartridges[9],and it can be used in conjunction with the Wheeler-Jonas equation[10] to estimate respirator service life. In previously published work by our laboratory, breakthrough data was used to determine capacity by testing ACF at successive bed depths. In this paper, we examined the applicability of the D-R equation to predict ACF adsorption capacity and breakthrough times without performing breakthrough experiments.
METHODS
ACF Media and Adsorbates
Two rayon-derived ACFs [ACFF 1800 and ACFF 2000; Bonding Chemical Co., Katy, TX.] were assessed in this study. The numbers 1800 and 2000 refer to the surface area of each material in m2 / gram, as reported by the manufacturer and as characterized by our laboratory using the BET method (1541.34±96.13 m2 /g and 1903.71±65 m2 /g, respectively). ACFF 1800 and 2000 have bulk densities of 0.0785±0.0053 g/cm3 and 0.00673 ± 0.0024 g/cm3 , respectively; they are similar in thickness (0.3 cm) and appearance, and are derived from the same precursor material. Toluene, hexane, and MEK adsorbates were used in breakthrough testing as representatives of aromatic, aliphatic, and polar hydrocarbons, respectively.
Breakthrough Testing
Experimental 10% breakthrough times (tb 10%) were determined for each ACF to allow for comparison with predicted values. The experimental set-up used to test ACF breakthrough time has been described previously [8].In short, ACF samples were placed in the test chamber and challenged with a VOC-containing airstream at a set concentration (200 ppm). Downstream challenge concentrations were monitored with a photoionization detector and the time at (breakthrough concentration of 10%) was recorded. The ACFs were tested separately against three adsorbates (toluene, hexane, MEK) and for at least three bed depths, each corresponding to consecutive ACF layers. Test conditions were maintained at 25 ?C and relative humidity of 30% by an ambient air-conditioning system (Assay Technology, Livermore, CA), which provided clean conditioned air to the test rig at a flow rate of 7.5 LPM for all experiments. This flow rate corresponds to a face velocity of 10 cm/s at the test media surface. This face velocity was selected because it approximates the face velocity experienced by a filtering facepiece respirator (FFR) with an average surface area of 100 cm2 when subjected to moderate airflow (64 LPM). Flow rate was monitored in realtime with a downstream mass flow meter. tb 10% results and corresponding bed weights were tabulated for comparison with predicted tb 10%, as described below.
Adsorption Data In the absence of experimental data, two carbon parameters (limiting micropore volume, Wo (cm3 /g); and characteristic energy of adsorption, Eo (kJ/mol)) can be used to calculate an equilibrium adsorption capacity in accordance with the D-R equation. These carbon parameters can be obtained from nitrogen adsorption isotherms. Each ACF media underwent nitrogen adsorption (n=3 trials) at 77K using a Micromeritics® ASAP 2020 Physisorption Analyzer (Micromeritics Corp, Norcross, GA). To determine the limiting micropore volume and energy of adsorption, a D-R transform of the N2 isotherm data was plotted on a logarithmic scale using Micromeritics® MicroActive Reporting software. A linear regression of these data was used to extract Wo and Eo based on the intercept and slope of the regression line, respectively.
Equilibrium Adsorption Capacity for Toluene, Hexane, and MEK
The D-R equation can be extended to many different adsorbates through the addition of an affinity coefficient (β): the ratio of an adsorbate’s molecular polarizability to that of a reference adsorbate, most often benzene [ 11]. We used the D-R equation to calculate the ACFF’s equilibrium adsorption capacity at 200 ppm and 298K for each of the three adsorbates (toluene, hexane, MEK) using the carbon parameters Wo and E0 as determined above [15]. Input parameters used in our calculations (to include affinity coefficients for each adsorbate) are provided in Table 1.
Table 1: Input Parameters used to calculate ACFF 1800 and ACFF 200 equilibrium adsorption capacities for toluene, n-hexane, and MEK
|
Adsorbate |
|
Toluene |
n-Hexane |
MEK |
|
Molecular weight (g/mol) |
92.14 |
86.16 |
72.11 |
|
|
Liquid Density (g/cm3) |
|
0.8669 |
0.6603 |
0.8054 |
|
Benzene Molecular Polarizability |
26.259 |
26.259 |
26.259 |
|
|
Adsorbate Molecular Polarizability |
31.054 |
29.877 |
20.681 |
|
|
β (Affinity Coefficient to Benzene) |
1.162 |
1.123 |
0.806 |
|
|
P0 in mmHg at 25 ºC |
|
21 |
124 |
78 |
Equation 1.
|
Equation 1 [11]. |
 |
|
where |
We = equilibrium adsorption capacity (g adsorbate/g carbon) Wo = limiting micropore volume (cm3/g carbon) dL = liquid density of the adsorbate (g/cm3) T= air temperature (K) R = gas constant P0=saturation pressure P=relative pressure of adsorbate T = air temperature (K) β = affinity coefficient of the adsorbate E0 = characteristic energy (kJ/mol) |
Adsorption Rate Coefficient
In order to predict breakthrough times in the absence of experimental data, some estimate of the adsorption rate coefficient must be made. For each ACF-adsorbate pair, adsorption rate coefficients were determined using the following semi-empirical relationship developed by Lodewyckx and Wood [13]:
This equation has been successfully applied to ACFs by substituting fiber diameter for particle diameter [14]. Because ACF fiber diameters are much smaller in diameter than GAC particles used in many respirator cartridges (0.10 - 0.11 cm)[15], the overall implication of this substitution is a much faster kinetic profile for ACF in comparison to a traditional granular adsorbent. To estimate fiber diameter, each ACFF was visualized at 5000X using an Apreo™ 2 Scanning Electron Microscope (Thermofisher Scientific, Waltham, MA) operated at 20 kV voltage and 0.40 nA current. Values used to calculate ACFF 1800 and ACFF 2000 adsorption rate coefficients are provided in Table 2.
Table 2. Input Parameters used to calculate ACFF 1800 and ACFF 2000 adsorption rate coefficients for toluene, n-hexane, and MEK.
|
Adsorbate |
Toluene |
n-Hexane |
MEK |
|
Molecular weight (g/mol) |
92.14 |
86.16 |
72.11 |
|
β (Affinity Coefficient to Benzene) |
1.162 |
1.123 |
0.806 |
|
Equilibrium Adsorption Capacities (g/g) |
0.346 |
0.183 |
0.135 |
|
ACFF 1800 and 2000 fiber diameter (cm) |
0.001 cm (per SEM images) |
|
|
|
Linear velocity through filter (cm/s) |
|
10 cm/s |
|
Calculation of Breakthrough Time
The Wheeler-Jonas (WJ) equation, a semi-empirical model of breakthrough time, was then used to predict ACF breakthrough times at = 0.10. The WJ equation has been successfully applied to the adsorption behavior of granular activated carbon (GAC) and ACF packed beds [10]. In our previous study, we used the Wheeler-Jonas equation to determine ACF adsorption capacity based on experimental inputs [8] table 3.
Table 3: Limiting micropore volume and characteristic energy, as obtained through N2 adsorption isotherm data.
|
Parameter |
ACFF 1800 |
ACFF 2000 |
|
Limiting Micropore Volume, Wo (cm3/g) |
0.579 ± 0.044 |
0.673 ± .023 |
|
Characteristic Energy, Eo (kJ/mol) |
17.25 ± 0.34 |
16.88 ± 0.12 |
tb = breakthrough time (min)
We = kinetic adsorption capacity (g/g)
W = weight of adsorbent (g)
C0 = inlet concentration (g/cm3 )
Cx = outlet concentration (g/cm3 )
Q = volumetric flow rate (cm3 /min)
kv = rate constant of adsorption (min-1)
ρb = density of the packed bed (g/cm3 )
To predict breakthrough time without experimental inputs, estimates of We and kv were used in Equation 3,
where  Equation 3.
along relevant experimental conditions (i.e., 200 ppm challenge concentration; 7.5 L/min flow rate, and a 10% breakthrough target) and carbon bulk properties (ACFF 1800 density 0.0785±0.0053 g/cm [3]; ACFF 2000 density 0.00673 ± 0.0024 g/cm3 ). Results were compared with experimental breakthrough times table 4.
Table 4: Toluene, Hexane, and MEK equilibrium adsorption capacities and adsorption rate coefficients for ACFF 1800 and ACFF 2000.
|
Parameter |
ACFF 1800 |
ACFF 2000 |
|
We toluene (mg/g) |
346.76 |
403.03 |
|
We n-hexane (mg/g) |
183.50 |
213.28 |
|
We n-MEK (mg/g) |
135.83 |
157.88 |
|
kv, toluene (min-1) |
9.22E+06 |
9.94E+06 |
|
kv, n-hexane (min-1) |
6.85E+06 |
7.39E+06 |
|
kv, n-MEK (min-1) |
5.71E+06 |
6.15E+06 |
RESULTS
Adsorption Data
Isotherm data indicated that ACFF 1800 had an average limiting micropore volume of 0.579 ± 0.044 cm3 /g and characteristic energy of 16.88 ± 0.023 kJ/mol. ACFF 2000 had an average limiting micropore volume of 0.673 ±0.023 cm3 /g and a characteristic energy of 17.25 ± 0.34 kJ/mol. ACFF limiting micropore volumes compare favorably with those of GAC used in commercially available OV cartridges (0.434 – 0.783 cm3 /g)[15].
Equilibrium Adsorption Capacity and Adsorption Rate Coefficients
Wo and Eo were used to determine each ACF’s equilibrium adsorption capacity for toluene, hexane, and MEK at a concentration of 200 ppm using the D-R equation. In all instances, equilibrium capacities for ACFF 2000 were higher than those of the ACFF 1800, based on lower characteristic energy and higher micropore volume input values. SEM images of the ACFs reveal an approximate range of fiber diameters between 8-10 µm, allowing for the calculation of kv using equation 2.
|
where |
kv = adsorption rate coefficient (min-1) We = equilibrium adsorption capacity (g/g), per Equation 1 vL = linear velocity through filter (cm/s) dp= fiber diameter (cm) Mw = molecular weight of adsorbate (g/mol) |
Breakthrough Time Calculation
In general, breakthrough time predictions aligned well with our experimental results [Table 5]
Table 5: Comparison of Experimental and Predicted tb 10%, with 200 ppm toluene as the adsorbate.
|
Adsorbent |
Layers |
Bed weight (g) |
Ex Experimental tb10% (min) |
Predicted tb 10% (min) |
|
|
1 |
0.204 |
10.83 |
12.69 |
|
ACFF 1800 |
2 |
0.390 |
21.83 |
24.31 |
|
|
3 |
0.591 |
32.50 |
36.73 |
|
|
4 |
0.780 |
46.50 |
48.53 |
|
|
1 |
0.204 |
10.42 |
14.60 |
|
ACFF 2000 |
2 |
0.430 |
21.42 |
30.72 |
|
|
3 |
0.585 |
34.83 |
41.77 |
|
|
4 |
0.729 |
45.67 |
52.05 |
[Table 6]
Table 6: Comparison of Experimental and Predicted tb 10%, with 200 ppm hexane as the adsorbate.
|
Adsorbent |
Layers |
Bed weight (g) |
Experimental tb10% (min) |
Predicted tb 10% (min) |
|
|
1 |
0.216 |
6.85 |
7.66 |
|
ACFF 1800 |
2 |
0.352 |
12.33 |
12.45 |
|
|
3 |
0.681 |
24.17 |
24.11 |
|
|
1 |
0.18 |
4.7 |
7.26 |
|
ACFF 2000 |
2 |
0.364 |
13 |
14.68 |
|
|
3 |
0.515 |
18.67 |
20.8 |
[Figures 1].
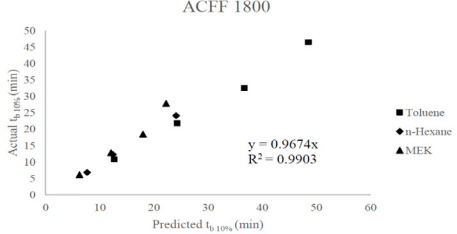
Figure 1: Predicted versus actual 10% breakthrough times for ACFF 1800. A linear least squares slope with a forced zero intercept (0.9674) and squared correlation coefficient (0.9903) has been provided.
[Table 7]
Table 7: Comparison of Experimental and Predicted tb 10%, with 200 ppm MEK as the adsorbate.
|
Adsorbent |
Layers |
Bed weight (g) |
Experimental tb10% (min) |
Predicted tb 10% (min) |
|
|
1 |
0.18 |
5.33 |
6.27 |
|
ACFF 1800 |
2 |
0.356 |
12.17 |
12.09 |
|
|
3 |
0.561 |
19.5 |
17.99 |
|
|
4 |
0.762 |
27.67 |
22.26 |
|
|
1 |
0.216 |
6.17 |
6.98 |
|
ACFF 2000 |
2 |
0.417 |
12.83 |
13.72 |
|
|
3 |
0.621 |
18.5 |
23.33 |
|
|
4 |
0.769 |
27.83 |
25.88 |
Predicted tb10% exceeded experimental tb 10% in all but three instances.
[Figures 2].
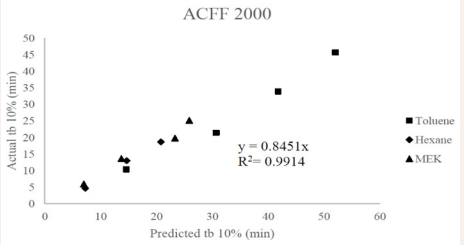
Figure 2: Predicted versus actual 10% breakthrough times for ACFF 2000. A linear least squares slope with a forced zero intercept (0.8451) and squared correlation coefficient (0.9914) have been provided.
DISCUSSION
We estimated ACFF breakthrough times for three organic vapors, using a flow rate and challenge concentration that are relevant to respiratory protection applications. Our method relied on N2 adsorption and the D-R isotherm equation to estimate a capacity term for each carbon-adsorbate system, and Lodewyckx and Wood’s extended rate coefficient equation to estimate a kinetic term (i.e., adsorption rate coefficient). Based on these inputs, the Wheeler-Jonas Equation was then used to predict breakthrough times, which compared favorably with experimental results described elsewhere [8] . This method has been applied extensively to GACs in the context of respirator service life predictions [15, 16]; however, the use of the D-R equation to predict ACF breakthrough times for respiratory protection applications is limited [17].
In most cases, we noticed that the predicted values of breakthrough time were greater than actual breakthrough time. Several exceptions were noted for ACFF 1800-MEK and ACFF 2000 MEK, and especially the predicted values of ACFF 1800-MEK were lower than the experimental values at the three layers out of four layers examined. In the context of respirator service life prediction, the opposite is generally desirable: a predictive model that underestimates service life may be more protective of worker health. The D-R equation has shown a tendency to overestimate capacity and by extension breakthrough time in previous studies: this was demonstrated through the testing of respirator cartridge breakthrough time for over 30 chemicals at concentrations between 100 and 2000 ppm at Los Alamos National Laboratory [18] . The tendency of the D-R equation to overestimate capacity is believed to be related to uncertainty in the affinity coefficient, β. Another known limitation of the D-R isotherm equation is that it does not reduce to Henry’s Law at very low concentrations. To address this concern, it would be useful to repeat the above study at nuisance-level (ppmv-ppmb) concentrations. This study was limited by lack of statistical analysis (due to the small sample size) examining the relationship between experimental and predicted breakthrough times, as presented in Tables 5-7 and Figures 1-2, although in many cases predicted vs. experimental breakthrough times for ACFF 1800 were within 2 minutes of each other. In future studies, it may be useful to set performance criteria (i.e., ±5% difference) to identify “successful” breakthrough time predictions. Determining the “success” of the predictive model may also be possible by computing the confidence interval of the slopes in Figures 1-2, with a confidence interval that bounds 1.0 indicating no significant difference between predicted and experimental values.
Future research would ideally look at attempt tb10% prediction under conditions that are more challenging (i.e., higher relative humidity and heat) and/or that encompass a greater range of concentrations (low ppmv and ppmb) and adsorbate classes.
CONCLUSION
We examined the applicability of the D-R equation to predict ACF adsorption capacity and breakthrough times Future research would ideally look at attempt tb10% prediction under conditions that are more challenging (i.e., higher relative humidity and heat) and/or that encompass a In general, breakthrough time predictions aligned well with our experimental results. Our data shows that 10% calculated breakthrough times exceeded experimental data in all but three instances. However, the differences between these times were lower than 4.2 minutes and 9.3 minutes for ACFF 1800 and ACFF 2000, respectively when challenged by all three adsorbates. Further research would ideally look at a greater range of concentrations and adsorbate classes and develop necessary correction factors greater range of concentrations (low ppmv and ppmb) and adsorbate classes.
REFERENCES
- Plog B, Niland J, Quinlan P. Fundamentals of Industrial Hygiene, 4thEdition. (National Safety Council, 1996).
- Hayes J. Activated Carbon Fibers and Textiles: Properties and Applications; American Kynol, Inc, Pleasantville, NY.1994.
- Lee T, Ooi C, Othman R, & Yeoh F. Activated Carbon Fiber - the Hybrid of Carbon Fiber and Activated Carbon. Reviews on Advanced Materials Science. 2014; 36: 118–136 .
- Webb S W. Gas Transport Mechanisms. In Gas Transport in Porous Media. 2006; 20 : 5-26.
- Balanay JAG, Crawford SA, Lungu CT. Comparison of Toluene Adsorption Among Granular Activated Carbon and Different Types of Activated Carbon Fibers (ACFs). J Occupational and Environmental Hygiene. 2021; 8: 573-579.
- Balanay JAG, Bartolucci AA, & Lungu C T. Adsorption characteristics of activated carbon fibers (ACFs) for toluene: application in respiratory protection. J Occup Environ Hyg 2014; 11: 133–143.
- Balanay JAG, Oh J. Adsorption Characteristics of Activated Carbon Fibers in Respirator Cartridges for Toluene. Int J Environ Res Public Health. 2021; 18: 8505.
- Summers M, Oh J, Lungu, C. T. Determination of Activated Carbon Fiber Adsorption Capacity for Several Common Organic Vapors: Applications for Respiratory Protection. J Air Waste Manag Assoc. 2022; 72: 570-580.
- Wood GO. Review and comparisons of D/R models of equilibrium adsorption of binary mixtures of organic vapors on activated carbons.Carbon N Y. 2002; 40: 231-238.
- Lodewyckx P, Wood GO, Ryu Sk. The Wheeler-Jonas equation a versatile tool for the prediction of carbon bed breakthrough times. Carbon N Y. 2004; 42: 1351-1355.
- Webb P, Orr C. Analytical Methods in Fine Particle Technology.(Micromeritrics Instrument Corporation, 1997).
- Wood G O, D-R Plots and Typical Parameters for Several OV and Multigas Cartridges and Cannisters. JISRP. 2009; 26.
- Wood, P Lodewyckx GO. An extended equation for rate coefficients for adsorption of organic vapors and gases on activated carbons in air- purifying respirator cartridges. Am Ind Hyg Assoc. 2003; 64, 646-650
- Tsai JH, Chiang HM, Huang GY, Chiang HL. Adsorption characteristicsof acetone, chloroform and acetonitrile on sludge-derived adsorbent,commercial granular activated carbon and activated carbon fibers. Journal of Hazardous Materials. 2008; 154: 1183-1191.
- Wood G. Correlating and Extrapolating Air Purifying Respirator Cartridge Breakthrough Times: A Review. 2015; JISRP 32.
- Wood GO. Estimating service lives of organic vapor cartridges II: a single vapor at all humidities. J Occup Environ Hyg. 2004; 1: 472-492.
- Balanay J. Adsorption Characteristics of Activated Carbon Fibers (ACF) for Toluene 2011.
- Wood GO. Reviews of models for adsorption of single vapors, mixtures of vapors, and vapors at high humidities on activated carbon for applications including predicting service lives of organic vapor respirator cartridges. Los Alamos National Laboratory LA- UR-00-1531. 2000.


