Model-Based Analysis of Microaeration for Biogas Desulfurization Using a Biomembrane
- 1. Department of Water Technology and Environmental Engineering, University of Chemistry and Technology Prague, Czech Republic
- 2. Department of Green Chemistry and Technology, Ghent University, Belgium
ABSTRACT
Hydrogen sulfide gas is an undesirable product of anaerobic treatment of sulfate-rich wastewater, which must be removed from biogas before burning the latter in a cogeneration unit. Microaeration is a biological desulfurization method, which consists in dosing small amount of air into anaerobic digester to support the growth of sulfide oxidizing bacteria (SOB) and the formation of elemental sulfur. The use of a so-called biomembrane, on which SOB grow, has recently been proposed as a promising process option that avoid biogas dilution with nitrogen from the dosed air as well as possible clogging of pipes by the elemental sulfur formed. In this study, the biomembrane-based microaeration processes was analysed through mathematical modelling and simulation. A mathematical model describing biogas desulfurization by microaeration through a biomembrane was presented for the first time. The model was validated to fit lab-scale experimental data as well as to represent a pilot-scale system. A sensitivity analysis showed that mass transfer coefficient and membrane surface area were the most important parameters in biofilm compartment affecting process kinetics. Additionally, important role of chemical oxidation of hydrogen sulfide was confirmed by the simulation results.
KEYWORDS
Biogas desulfurization; Biomembrane; Chemical sulfide oxidation; Biochemical sulfide oxidation; Microaeration; Mathematical modelling; Simulation study.
CITATION
Pokorna-Krayzelova L, Andreides M, Volcke EIP, Jení?ek P, Bartacek J (2022) Model-Based Analysis of Microaeration for Biogas Desulfurization Using a Biomembrane. Chem Eng Process Tech 7(2): 1069.
INTRODUCTION
Hydrogen sulfide (H2 S) is corrosive and toxic compound formed during the anaerobic treatment of sulfate-rich wastewater [1,2]. In gaseous and liquid form, H2 S causes many health, environmental, operational and maintenance problems and its removal from biogas is therefore necessary.
Biogas desulfurization methods can be classified into physico-chemical and biological methods. Physico-chemical desulfurization methods comprise e.g. adsorption on activated carbon or absorption in alkaline solutions. Due to the prevailing high pressures and/or temperatures, physico-chemical methods involve larger capital and operational costs compared to biological methods; they also require more chemicals and produce secondary pollutants [2-5]. Biological methods are based on the biochemical oxidation of sulfide to elemental sulfur and sulfate by sulfur oxidizing bacteria (SOB) [3,6]. Since biological methods require only air or oxygen, they result in lower operational costs, with lower or no need for chemical addition [7,8].
Microaeration is a biological method in which small amounts of air or oxygen are dosed into anaerobic digesters, which has gained attention recently [9-12]. Microaeration is highly efficient, reliable, simple and economically feasible. However, it also has some drawbacks, such as biogas dilution with nitrogen from the dosed air and sulfur deposition in biogas pipes, which can cause clogging. Microaeration through a biomembrane is a novel concept [13,14], which has been proposed to alleviate these negative effects. The biomembrane separates the air from biogas, thus decreasing biogas contamination by nitrogen. The membrane serves as a support for the biofilm-forming SOB and provides surface for sulfur precipitation, both at the biogas-side of the membrane. Previous results showed the ability of the biomembrane to desulfurize biogas in batch as well as continuous experiments with an efficiency over 99% [13]. However, the biomembrane technology is still very new and only partially explored topic and its operation has not yet been optimized. Mathematical modelling and simulation of microaeration through a biomembrane could contribute to increased process understanding, ultimately leading to improved operation and control strategies.
In this paper, a mathematical model of microaeration through a biomembrane for biogas desulfurization was set up for the first time. The biomembrane model was calibrated by fitting the labscale experimental data published by Pokorna-Krayzelova et al. [13]. Secondly, the biomembrane model was validated on the pilot-scale experimental data published by Pokorna-Krayzelova et al. [14]. A sensitivity analysis was performed for both setups, allowing the identification of key processes and process parameters.
MATERIALS AND METHODS
Lab-scale biomembrane set-up
Data from Pokorna-Krayzelova et al., [13] Were used to validate the model of hydrogen sulfide removal in a lab-scale biomembrane reactor. The biomembrane unit consisted of a plexi-glass reactor and a hollow-fibre membrane. The membrane was made from poly-dimethyl siloxane (PDMS), the inner and outer diameters were 10 and 12 mm, respectively, the length was 0.9 m, and surface area was 0.034 m2 . The volumes of the biogas side and air side were 5.27 and 1.45 L, respectively, including all tubes and connections. Synthetic biogas with volumetric composition of 64.1% of methane, 35.5% of carbon dioxide and 2.5 ? 5 mg L-1 (0.2 ? 0.4%) of hydrogen sulfide was used.
A counter-current flow configuration was established, with biogas flowing around the membrane from bottom to the top of the reactor and air inside the membrane from top to the bottom. The flow rate was 16.2 L h-1 for both sides. The changes of the concentrations of all gases on both sides of the membrane were measured in time, as the equilibrium between biogas side and air side was established.
Three separate experiments were considered: bare membrane with the simple transfer of gases through the membrane, wet membrane where membrane was submerged into water from the biogas side prior the experiment, and biomembrane where membrane was submerged into the sludge from the biogas side prior the experiment according to Pokorna-Krayzelova et al. [13].
Pilot-scale biomembrane set-up
The model calibrated for lab-scale system, was subsequently applied validated against the experimental data from PokornaKrayzelova et al. [14] for a pilot-scale biomembrane set-up. In this case, the volume of biogas side and airside was 118 and 23 L, respectively, including all tubes and connections. The membrane was a polyvinylidene fluoride (PVDF) membrane with specific area (Am) 20 m2 . The biogas composition was the same as for the lab-scale biomembrane set-up. An analogous counter-current flow configuration was used, this time with a gas flow rate of 13.2 L h-1 on both sides. The changes of the concentrations of all gases on both sides of the membrane were measured in time, as the equilibrium between biogas side and air side was established.
Three separate experiments were modelled: bare membrane, wet membrane, and biomembrane analogous to the previous experiments.
Modelling biomembrane-based microaeration
Mass transport: The membrane-based microaeration model was implemented in the Aquasim 2.0 simulation environment [15,16]. The model consisted of four compartments: air side, membrane, biofilm and biogas side (Figure 1),
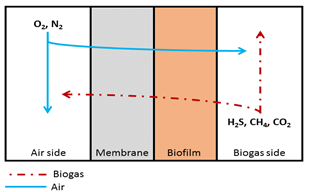
Figure 1: Schematic representation of the biomembrane reactor model. For bare membrane experiments the biofilm compartment was turned off, in case of a wet membrane, the biofilm compartment consisted only of a water layer.
which were connected with diffusive links. The air side, membrane and biogas side were implemented in Aquasim as a mixed reactor compartment, while the biofilm was implemented as a biofilm reactor compartment.
The gas transfer between air?side and membrane was calculated according to Equation 1 [17]:
(1)
where Qex is the flow through the membrane [mg h-1]; Am is the membrane area [m2 ]; Pi is the permeability of gas i [mg m m-2 h-1 bar-1]; R is the gas law constant [L bar mmol-1 K-1]; T is the temperature [K]; Lm is the membrane thickness [m]; ri,1 and ri,2 are the concentrations of gas i in compartment 1 and 2, respectively [mg L-1] and Mi is the molar weight of gas i [mg mmol1 ].
The gas-liquid transfer between the membrane/biofilm and biofilm/biogas sides was modelled through the interphase mass transport coefficient KLa with Henry´s constant (KH) used as a conversion factor [18], according to Equation 2
(2)
in which Qi,g→l denotes the transfer of component i from gas to liquid and liquid to gas [mg h-1], respectively, KL ai is the mass transport coefficient of component i [dm h-1], ri, l and ri, g are the concentrations of component i in the liquid and gas phase, respectively [mg L-1] and KH is Henry´s constant [dm3 gas dm-3 liquid]. The mass transport coefficient KL ai was estimated during model calibration.
The molecular diffusion in the wet membrane and biofilm is pre-programmed in Aquasim in the properties of dissolved variables. As for the diffusivity of gases for wet membrane, the diffusivity of gases in water was taken [19]. For the diffusivity of gases in biofilm, the diffusivity of gases in water was taken and reduced due to the presence of microbial cells, extracellular polymers, and abiotic particles or gas bubbles that are trapped in the biofilm by a factor 0.6 for light gases (e.g., oxygen, nitrogen, carbon dioxide, hydrogen sulfide or methane) according to Stewart [20].
Conversion processes: Two main sulfur conversion processes were assumed to take place in the biomembrane reactor: biochemical oxidation of hydrogen sulfide to elemental sulfur by sulfide oxidizing bacteria (SOB) (Table 1, Process 1)
Table 1: Stoichiometric matrix Aij and composition matrix for biochemical and chemical sulfide oxidation.
|
Aija |
Components i → |
1 |
2 |
3 |
4 |
5 |
Process rate ρi. |
|
Processes j ↓ |
SH S 2 |
S 2- S2O3 |
SS |
SO 2 |
XSOB |
||
|
1 |
Biological H2S oxidation |
-1 |
|
1 |
- (16 - YSOB ) 32 |
YSOB |
r = k • SH2S • SO2 •X 1 m.H2S.SOB K + S K + S SOB S.H2S.SOB H2S S.O2 .SOB O2 |
|
2 |
Chemical H2S oxidation |
-1 |
0.5 |
|
-1 |
|
r4 = kH S chem.ox •(SH S ) •(S ) a b 2 2 O2 |
|
3 |
Decay of XSOB |
|
|
|
|
-1 |
r5 = kdec.X •XSOB SOB |
|
Composition matrix |
|||||||
|
mg COD per unit component |
64 |
64 |
48 |
-32 |
1 |
|
|
|
mg S per unit component |
32 |
64 |
32 |
0 |
0 |
|
|
|
|
Hydrogen sulfide (mmole L-1) |
Thiosulfate (mmole L-1) |
Elemental sulfur (mmole L-1) |
Oxygen (mmole L-1) |
sulfide-oxidizing bacteria (mg COD L-1) |
|
|
and chemical oxidation of hydrogen sulfide to thiosulfate (Table 1, Process 2). The decay of SOB was also incorporated in the model (Table 1, Process 3). For each process, the stoichiometric coefficients were calculated closing the COD and sulfur balances (Table 1). Monod-type equations were used to describe substrate (H2 S and oxygen) limitation in the biochemical oxidation rate [21]. Chemical oxidation of H2 S to form thiosulfate (S2 O3 2-) was described by a power function [22]. Chemical oxidation of H2 S was assumed to take place on both the biogas and air side while biochemical oxidation of H2 S by SOB and the decay of SOB was assumed to take place in the biofilm.
Simulation set-up: For bare membrane modelling, only air side, membrane and biogas side compartments were considered, while the biofilm compartment was turned off. For the wet membrane model, the biofilm compartment was used; however, it contained only a water fraction to model the dilution of gases in water (a negligible value 10-9 was used for the concentration of bacteria to avoid numerical artefacts). The permeability of gases in bare membrane was then used with water layer modelled on the membrane surface.
Simulations with and without chemical sulfide oxidation were carried out for both bare and the membrane. Chemical sulfide oxidation was included in the model.
Biomembrane model: For the biomembrane model, biofilm compartment contained bacteria and biological conversion.
Biochemical sulfide oxidation and the decay of sulfide-oxidizing bacteria were included in biomembrane model besides chemical sulfide oxidation. The permeability of gases measured for bare membrane was used with biofilm modelled on the membrane surface.
The parameters used in the model are listed in Table 2.
Table 2: Parameters used in the biomembrane model.
|
Parameter |
Value |
Unit |
Description |
Reference |
|
Stoichiometric and kinetic parameters |
||||
|
|
1.1 |
- |
Reaction order (H2S) |
Pokorna-Krayzelova, Vejmelková, Selan, Jenicek, Volcke and Bartacek [42] |
|
|
0.9 |
- |
Reaction order (O2) |
Pokorna-Krayzelova, Vejmelková, Selan, Jenicek, Volcke and Bartacek [42] |
|
SS |
0.0014 |
mol L-1 bar-1 |
Henry´s coefficient (CH4) |
Wilhelm, Battino and Wilcock [43] |
|
SO 2 |
3.4e-2 |
mol L-1 bar-1 |
Henry´s coefficient (CO2) |
Wilhelm, Battino and Wilcock [43] |
|
HH 2 S |
0.105 |
mol L-1 bar-1 |
Henry´s coefficient (H2S) |
Wilhelm, Battino and Wilcock [43] |
|
HN 2 |
6.1e-4 |
mol L-1 bar-1 |
Henry´s coefficient (N2) |
Wilhelm, Battino and Wilcock [43] |
|
HO2 |
1.3e-3 |
mol L-1 bar-1 |
Henry´s coefficient (O2) |
Wilhelm, Battino and Wilcock [43] |
|
kdec,Xsob |
8.3e-4 |
h-1 |
SOB decay rate |
Pokorna-Krayzelova, Mampaey, Vannecke, Bartacek, Jenicek and Volcke [21] |
|
km,SOB |
3.43 |
mg mg-1 h-1 (S; VSS) |
Maximum SOB uptake rate |
Nishimura and Yoda [44] |
|
kS,H 2 S,SOB |
0.001 |
mmole L-1 |
Half-saturation constant of H2S uptake rate by SOB |
Pokorna-Krayzelova, Mampaey, Vannecke, Bartacek, Jenicek and Volcke [21] |
|
kS,O2,SOB |
0.032 |
mmole L-1 |
Half-saturation constant of O2 uptake rate by SOB |
Xu, Chen, Lee, Wang, Guo, Zhou, Guo, Yuan, Ren and Chang [45] |
|
kH 2 S,chemox |
0.1 |
h-1 |
Chemical H2S oxidation rate |
Pokorna-Krayzelova, Vejmelková, Selan, Jenicek, Volcke and Bartacek [42] |
|
rX |
22,200 |
mg S L-1 |
Biomass density |
Pokorna-Krayzelova, Bartacek, Vejmelkova, Alvarez, Slukova, Prochazka, Volcke and Jenicek [13] |
|
YSOB |
0.03 |
mg COD mole-1 S |
Biomass yield |
Xu, Chen, Lee, Wang, Guo, Zhou, Guo, Yuan, Ren and Chang [45] |
|
Mass transport parameters |
||||
|
D wet mem CH 4 |
0.0662 |
m2 h-1 |
diffusion coefficient (CH4) used in wet membrane |
Kaye and Laby [19] |
|
D biomem CH 4 |
0.0397 |
m2 h-1 |
diffusion coefficient (CH4) used in biomembrane |
Stewart [20] |
|
D wet mem CO2 |
0.0687 |
m2 h-1 |
diffusion coefficient (CO2) used in wet membrane |
Kaye and Laby [19] |
|
D biomem CO2 |
0.0412 |
m2 h-1 |
diffusion coefficient (CO2) used in biomembrane |
Stewart [20] |
|
D wet mem H 2 S |
0.0489 |
m2 h-1 |
diffusion coefficient (H2S) used in wet membrane |
Kaye and Laby [19] |
|
D biomem H 2 S |
0.0294 |
m2 h-1 |
diffusion coefficient (H2S) used in biomembrane |
Stewart [20] |
|
D wet mem N 2 |
0.0720 |
m2 h-1 |
diffusion coefficient (N2) used in wet membrane |
Kaye and Laby [19] |
|
D biomem N 2 |
0.0432 |
m2 h-1 |
diffusion coefficient (N2) used in biomembrane |
Stewart [20] |
|
D wet mem O2 |
0.0752 |
m2 h-1 |
diffusion coefficient (O2) used in wet membrane |
Kaye and Laby [19] |
|
D biomem O2 |
0.0523 |
m2 h-1 |
diffusion coefficient (O2) used in biomembrane |
Stewart [20] |
|
k alab L |
4.765 |
m s-1 |
Mass transfer coefficient (lab-scale bare, wet and biomembrane) |
this study |
|
k apilot L |
0.0066 |
m s-1 |
Mass transfer coefficient (pilot-scale bare and wet membrane) |
this study |
|
k apilot bio L |
0.0225 |
m s-1 |
Mass transfer coefficient (pilot-scale biomembrane) |
this study |
|
Other parameters |
||||
|
A lab m |
0.034 |
m2 |
Membrane area (lab-scale membrane) |
Pokorna-Krayzelova, Bartacek, Vejmelkova, Alvarez, Slukova, Prochazka, Volcke and Jenicek [13] |
|
A pilot m |
20 |
m2 |
Membrane area (pilot-scale membrane) |
Pokorna-Krayzelova, Bartacek, Theuri, Segura Gonzalez, Prochazka, Volcke and Jenicek [14] |
|
Lf |
1e-6 |
m |
Biofilm thickness |
Pokorna-Krayzelova, Bartacek, Vejmelkova, Alvarez, Slukova, Prochazka, Volcke and Jenicek [13] |
|
Lm |
0.001 |
m |
Membrane thickness |
Pokorna-Krayzelova, Bartacek, Vejmelkova, Alvarez, Slukova, Prochazka, Volcke and Jenicek [13] |
|
V lab a |
1.45 |
L |
Air volume (lab-scale membrane) |
Pokorna-Krayzelova, Bartacek, Vejmelkova, Alvarez, Slukova, Prochazka, Volcke and Jenicek [13] |
|
V pilot a |
|
L |
Air volume (pilot-scale membrane) |
Pokorna-Krayzelova, Bartacek, Theuri, Segura Gonzalez, Prochazka, Volcke and Jenicek [14] |
|
V lab b |
5.27 |
L |
Biogas volume (lab-scale membrane) |
Pokorna-Krayzelova, Bartacek, Vejmelkova, Alvarez, Slukova, Prochazka, Volcke and Jenicek [13] |
|
V pilot b |
|
L |
Biogas volume (pilot-scale membrane) |
Pokorna-Krayzelova, Bartacek, Theuri, Segura Gonzalez, Prochazka, Volcke and Jenicek [14] |


Initial and input conditions are listed in Supplementary materials, Table S1.1.
Sensitivity analysis In order to define the most sensitive parameters, parametric sensitivity analysis was performed. The parameters analyzed were mass transfer coefficient (kLa), biological sulfide oxidation (precisely the maximum uptake rate, km,SOB), chemical sulfide oxidation rate (kH,2S,chemox), membrane thickness (xm), membrane surface area (Am), hydrogen sulfide diffusivity (DH2S) and the concentration of sulfide?oxidizing bacteria (XSOB).
Hydrogen sulfide concentration was set as the focused variable to measure sensitivity and the sensitivity index (SI) was defined as follows:
(3)
where y is hydrogen sulfide concentration and p is the analysed parameter (kLa, km,SOB, kH2S,chmox, xm, Am, DH2S, and XSOB). SI means the absolute change in y which is needed for a 100% change in p. Positive SI indicates that parameter p correlates positively with the target variable y.
RESULTS
Lab-scale biomembrane
Bare membrane: Using experimentally determined permeability of hydrogen sulfide, methane and carbon dioxide [13] and including chemical H2 S oxidation in the model, simulated concentration of hydrogen sulfide, methane and carbon dioxide corresponded well with experimental data (Supplementary materials, Figure S2.1).
However, the permeability of nitrogen and oxygen published by Pokorna-Krayzelova et al. [13] seemed to have been underestimated and had to be adjusted (Table 3)
Table 3: Permeability of gases in bare membrane for Lab-scale and Pilot-scale biomembrane model.
|
Case |
|
Permeability [Barrer]a |
||||
|
N2 |
O2 |
H2S |
CH4 |
CO2 |
||
|
Lab-scale biomembrane |
1125b |
1637b |
3410c |
800c |
2550c |
|
|
Pilot-scale biomembrane |
400d |
400d |
400d |
400d |
400d |
|
|
Pokorna-Krayzelova, Bartacek, Vejmelkova, Alvarez, Slukova, Prochazka, Volcke and Jenicek [13] |
210 |
500 |
3410 |
800 |
2550 |
|
a Barrer = 10-10 cm3(STP) cm cm-2 s-1 (cm Hg)-1
b Permeability was estimated during model calibration to fit the experimental data published by Pokorna-Krayzelova, Bartacek, Vejmelkova, Alvarez, Slukova, Prochazka, Volcke and Jenicek [13] by the least squares method, minimizing the sum of squared errors for all gases simultaneously.
c Experimentally determined by Pokorna-Krayzelova, Bartacek, Vejmelkova, Alvarez, Slukova, Prochazka, Volcke and Jenicek [13]
d Permeability was estimated during model calibration to fit the experimental data published by Pokorna-Krayzelova, Bartacek, Theuri, Segura Gonzalez, Prochazka, Volcke and Jenicek [14] by the least squares method, minimizing the sum of squared errors for all gases simultaneously.
to fit the concentration of nitrogen and oxygen on biogas and air sides (Supplementary materials, Figure S2.1).
The concentration of hydrogen sulfide corresponded well with the experimental data (Figure 2A),
![Comparison between experimentally measured [13] and simulated hydrogen sulfide concentration at the air side and the biogas side of the bare membrane (A), wet membrane (B) and biomembrane (C). The data were measured in a lab-scale set-up. Chemical H2S oxidation was included in the model.](https://www.jscimedcentral.com/public/assets/images/uploads/image-1706087327-2.PNG)
Figure 2 Comparison between experimentally measured [13] and simulated hydrogen sulfide concentration at the air side and the biogas side of the bare membrane (A), wet membrane (B) and biomembrane (C). The data were measured in a lab-scale set-up. Chemical H2S oxidation was included in the model.
showing root-meansquare error (RMSE) of 0.124 mg L-1 for air side and 0.303 mg L-1 for biogas side. The RMSE of other gases (O2 , N2 , CH4 and CO2 ) was below 0.001 atm.
Wet membrane: The wet membrane was approximated as a bare membrane with 1 mm water layer covering membrane surface to include the dilution of gases in water. All gases showed good fit with the experimental data (Supplementary materials, Figure S2.2) except for carbon dioxide where concentration of CO2 in the air side was overestimated by the model.
The simulated concentrations of hydrogen sulfide in wet membrane experiment (with chemical oxidation included) showed a good fit with the experimentally measured data (Figure 2B),
Figure 2 Comparison between experimentally measured [13] and simulated hydrogen sulfide concentration at the air side and the biogas side of the bare membrane (A), wet membrane (B) and biomembrane (C). The data were measured in a lab-scale set-up. Chemical H2S oxidation was included in the model.
corresponding with RMSE of 0.116 mg L-1 for air side and 0.437 mg L-1 for biogas side. The RMSE of other gases (O2 , N2 , CH4 and CO2 in the biogas side) was below 0.003 atm. The RMSE of CO2 in the air side was 0.013 atm.
Importance of chemical sulfide oxidation: A considerable difference in modelled and experimental H2 S concentration at the biogas side was observed, while modelling the transfer of gases through bare and wet membrane (without biofilm). The modelled concentration of H2 S on the biogas side was underestimated. When chemical oxidation was included in the biogas and air compartment, the model showed a good fit with the experimental results (Figure 3).
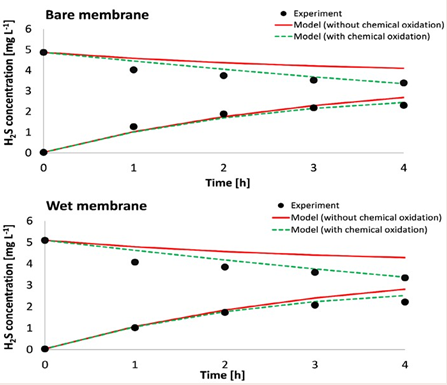
Figure 3 The H2S concentration in bare and wet membrane for experiments (points), model without chemical H2S oxidation ( ) and model with chemical H2S oxidation (---- ).
These results prove that chemical oxidation indeed takes place and needs to be included in the model.
Biomembrane: Modelled concentrations of hydrogen sulfide in biomembrane with chemical and biological oxidation showed a good fit with the experimentally measured data (Figure 2C), corresponding with a RMSE of 0.076 mg L-1 for air side and 0.157 mg L-1 for biogas side. The RMSE of other gases (O2 , N2 , CH4 and CO2 ) was below 0.001 atm except for carbon dioxide where concentration of CO2 in the air side was overestimated by the model and the RSME was 0.012 atm. Additional results from the model for the biomembrane are shown in Supplementary material, Figure S2.3.
Pilot-scale biomembrane
Bare membrane: Pilot-scale membrane was modelled analogously to the lab-scale membrane. The bare membrane permeability (400 Barrer for all gases) was estimated during model calibration (based on the experimental data) by the least squares method, minimizing the sum of squared errors for all gases simultaneously (Table 3). The composition of all gases in bare membrane is shown in Supplementary materials, Figure S3.1.
The concentration of hydrogen sulfide corresponded well with the experimental data (Figure 4A),
![Comparison between experimentally measured [14] and simulated hydrogen sulfide concentration at the air side and biogas side of bare membrane (A), wet membrane (B) and a biomembrane (C). The data were measured in the pilot-scale set-up. Chemical H2S oxidation was included in the model.](https://www.jscimedcentral.com/public/assets/images/uploads/image-1706087327-4.PNG)
Figure 4 Comparison between experimentally measured [14] and simulated hydrogen sulfide concentration at the air side and biogas side of bare membrane (A), wet membrane (B) and a biomembrane (C). The data were measured in the pilot-scale set-up. Chemical H2S oxidation was included in the model.
corresponding with the RMSE of 0.010 mg L-1 for air side and 0.029 mg L-1 for biogas side. The RMSE of other gases (O2 , N2 , CH4 and CO2 ) was below 0.002 atm.
Wet membrane: For wet membrane, the permeability of gases for bare membrane was used with water layer modelled on the membrane surface. The mas transfer coefficient (kLapilot) was estimated at 13.2 L h-1 and the water level depth at 1 mm.
All the gases showed good fit with the experimental data (Supplementary materials, Figure S3.2). The simulated concentrations of hydrogen sulfide in the wet membrane showed a good fit with the experimentally measured data (Figure 4B), corresponding with the RMSE of 0.042 mg L-1 for air side and 0.001 mg L-1 for biogas side. The RMSE of other gases (O2 , N2 , CH4 and CO2 ) was below 0.002 atm.
Biomembrane: For biomembrane, the permeability of gases for bare membrane was used with biofilm modelled on the membrane surface. In the biofilm layer, chemical and biochemical oxidation of H2 S was taking into account analogously to lab-scale biomembrane. The mass transfer coefficient (kLa pilot bio) was estimated at 45.0 L h-1.
The simulated concentrations of hydrogen sulfide in biomembrane with chemical and biological oxidation included showed a good fit with the experimentally measured data (Figure 4C), corresponding with the RMSE of 0.049 mg L-1 for air side and 0.044 mg L-1 for biogas side. The RMSE of other gases (O2 , N2 , CH4 and CO2 ) was below 0.002 atm except for N2 and CO2 in air side (RMSE of 0.018 and 0.009 atm, respectively). However, the modelling results of both gases, nitrogen and carbon dioxide, are within the standard deviation range of the experimental results. The complete simulation results of biomembrane is shown in Supplementary material, Figure S3.3.
Sensitivity analysis The parameter having the largest impact on hydrogen sulfide concentration on the air side and biogas side was clearly membrane surface area (highest SI value in Figure 5).
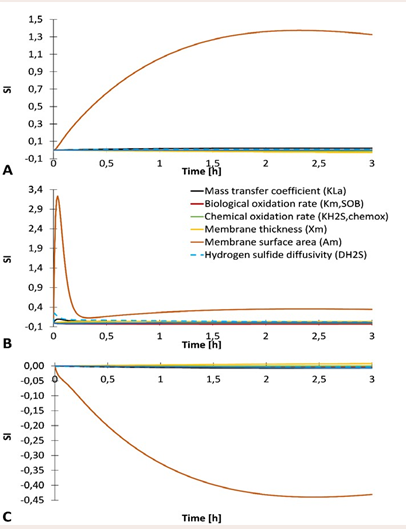
Figure 5 Sensitivity indices (SI) of various parameters (kLa, km,SOB, kH2S,chemox, xm, Am, DH2S, and XSOB) based on the absolute-relative sensitivity function analysis for hydrogen sulfide concentration in lab-scale biomembrane set-up. A – Air side; B – Biofilm; C – Biogas side.
In the case of biofilm compartment, mass transfer coefficient and hydrogen sulfide diffusivity also played small role. On the air side, hydrogen sulfide concentration increased with increasing membrane surface area, while on the biogas side, H2 S concentration decreases with increasing membrane surface area. In biofilm compartment, all three parameters (membrane surface area, mass transfer coefficient and hydrogen sulfide diffusivity) had similar pattern. The influence of other parameters was small (a zoom-in of Figure 5 is provided in Supplementary material, Figure S4.1).
In the case of the pilot-scale biomembrane (Figure 6),
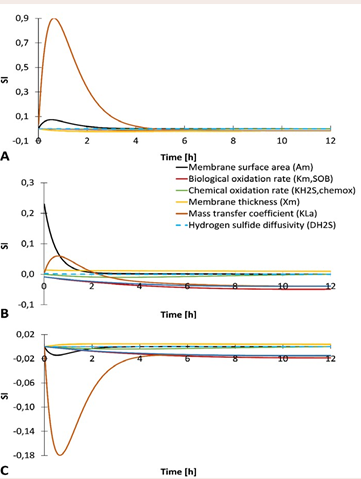
Figure 6 Sensitivity indices (SI) of parameters (kLa, km,SOB, kH2S,chemox, xm, Am, DH2S, and XSOB) based on the absolute-relative sensitivity function analysis for hydrogen sulfide concentration in pilot-scale biomembrane set-up. A – Air side; B – Biofilm; C – Biogas side.
the most important parameters for hydrogen sulfide concentration were membrane surface area and mass transfer coefficient for all compartments. Increasing both parameters increases H2 S concentration in the air side while decreasing it in the biogas side. In the biofilm compartment, the mass transfer coefficient played more important role than membrane surface area. In the biogas side and biofilm compartment, the H2 S concentration was also affected by the biological oxidation rate and the amount of sulfide-oxidizing bacteria. The influence of other parameters was small (a zoom-in of Figure 6 is provided in Supplementary material, Figure S4.2).
DISCUSSION
Biomembrane modelling and simulation
This paper presents a mathematical model of biomembrane for biogas desulfurization in lab-scale and pilot-scale configuration. To the best of our knowledge, this is the first mathematical model of a biomembrane for hydrogen sulfide removal.
The mathematical model of biomembrane was calibrated with previously published experimental data in lab-scale [13] and validated with pilot-scale configurations [14]. The model showed very good fit for different configurations with mainly membrane surface area and mass transfer coefficient adjusted. In both cases, the model showed good fit for all gases, including hydrogen sulfide. In pilot-scale configuration the RMSE of hydrogen sulfide was even lower (0.029 mg L-1 for air side) compare to the lab-scale configuration (0.303 mg L-1), proving the model applicability even for larger systems.
Membrane permeability characteristics
The permeation order for the PDMS membrane modelled was H2 S > CO2 > O2 > N2 > CH4 , while in the case of the experiment the gases permeability was H2 S > CO2 > CH4 > O2 > N2 . The permeation order of H2 S > CO2 > CH4 coincides with the findings reported by Kraftschik, Koros, Johnson and Karvan [23]. According to a Klinkenberg slippage effect [24], the permeability of a gas is the function of a mean free path of the gas molecules, and thus depends on factors which influence the mean free path, such as pressure, temperature, and the nature of the gas [24]. Rushing, Newsham and Van Fraassen [25] addressed that the gas relative permeability may be overestimated if the two-phase gas Klinkenberg effect, was not considered in the laboratory experiments. Moreover, the confining pressure and water saturation dramatically affect both the gas phase permeability and gas relative permeability. Since Klikenberg effect was not considered for the laboratory experiments, it could overestimate the relative permeability of nitrogen and oxygen.
In the case of the pilot-scale biomembrane model, the permeabilities of gases through PVDF membrane were equal. The difference was observed in wet membrane and biomembrane and was caused by various water solubility and the diffusivity of various gases in water and biofilm. The permeability of gases reported in PDMS were comparable for oxygen, nitrogen and methane; however, the reported permeability of CO2 was 1 order magnitude higher [26,27].
For the lab-scale configuration, carbon dioxide concentration on the air side was overestimated by the model, both in the case of wet membrane and for a biomembrane. This could be caused by the solubility of CO2 in wet PDMS membrane as reported by Genduso et al. [28] and Riastat et al. [29]. According to Shah et al. [30], the solubility of CO2 in PDMS is 1.83 cm3 (STP) cm-3 at 10°C and 1.32 cm3 (STP) cm-3 at 35°C. The volume of lab-scale PDMS membrane was 68 cm3 , so approx. 89.8 to 124.4 cm3 of carbon dioxide could be absorbed in the membrane (the temperature of the experiment was 25°C). The difference in the experimental and simulated CO2 concentrations calculated for wet membrane and biomembrane were 0.483 and 0.243 cm3 , respectively. The membrane was probably not fully saturated with CO2 and the decrease could be caused by the partial solubility of CO2 since part of the CO2 transferred from biogas side to air side got absorbed into the membrane itself.
Membrane surface area and mass transfer coefficient
It is evident from the sensitivity analysis that one of the crucial parameters for biogas desulfurization with biomembrane is membrane surface area, i.e. the contact area. In the case of biomembrane, the higher membrane surface area, the more sulfide-oxidizing bacteria can grow on it to biologically remove H2 S. In practice, this parameter can help to propose an appropriate technology for full-scale H2 S removal in biogas plants since the specific H2 S removal rate reported so far was 2.16 g m-2 d-1 [13].
In the lab-scale model with small membrane surface area (0.034 m2 ), the mass transfer coefficient did not affect the hydrogen sulfide concentration (Figure 5B), which indicates that hydrogen sulfide conversion are conversion-limited rather than transport-limited, i.e. biochemical sulfide oxidation is slower than mass transport. However, in the case of pilot-scale membrane model (membrane surface area of 20 m2 ), the mass transfer coefficient in biofilm compartment can significantly influence the concentration of hydrogen sulfide (Figure 5B). According to Yasin et al. [31], membrane surface area per working volume (Am/V) is a controllable parameter and has an influence on the mass transfer coefficient, i.e. increasing Am/V increases the mass transfer coefficient. This does not correlate with our findings, where the lab-scale model has lower Am/V with higher mass transfer coefficient compare to the pilotscale model. Table 4
Table 4: Mass transfer coefficients and membrane surface area to volume ratio.
|
Reference |
kLa |
Am
V |
Am |
V |
Membrane material |
|
[m h-1] |
[m-1] |
[m2] |
[m3] |
[ - ] |
|
|
Jefferson, Nazareno, Georgaki, Gostelow, Stuetz, Longhurst and Robinson [32] |
2.44 10-8 a 2.65 10-7 b |
1.47 |
0.4 |
0.273 c |
Polypropylene |
|
Boucif, Favre, Roizard and Belloul [33] |
2.78 10-9 |
1.47 |
0.4 |
0.273 c |
Polypropylene |
|
4.14 10-9 |
1.46 |
0.0248 |
0.017 c |
||
|
Esquiroz-Molina, Georgaki, Stuetz, Jefferson and McAdam [34] |
2.14 10-7 – 2.42 10-7 |
1.47 |
0.4 |
0.273 c |
Polypropylene |
|
Camiloti, Oliveira and Zaiat [35] |
1.53 10-1 |
4.47 |
0.00804 |
0.0018 d |
PDMS |
|
Minier-Matar, Janson, Hussain and Adham [36] |
4.05 10-5 |
40 |
0.18 |
0.0045 d |
Polypropylene |
|
Tilahun, Bayrakdar, Sahinkaya and Çalli [37] |
1.91 10-9 |
573.0 |
0.0659 |
0.000115c |
PDMS |
|
1.39 10-9 |
573.0 |
0.0659 |
0.000115c |
||
|
This paper |
4.75 10-1 |
6.45 |
0.034 |
0.00527 c |
PDMS |
|
2.25 10-3 |
169.6 |
20 |
0.1179 c |
PVDF |

a the pH value of liquid solvent was 7
b the pH value of liquid solvent was 13
c volume of gas phase (H2S is contained in the gas)
d volume of liquid phase (H2S is contained in the liquid)
shows mass transfer coefficients and Am/V values reported in the literature; however, to find a correlation between them was not possible. The data varied a lot across the literature and to define properly mass transfer coefficient is more complicated. Jefferson et al. [32], Boucif et al. [33] and EsquirozMolina et al. [34] reported the same Am/V values; however, their mass transfer coefficients were 2 orders of magnitude different from each other (from 10-7 to 10-9). The mass transfer coefficient for the lab-scale membrane reported in this study is in a good correlation with the kLa reported by Camiloti, Oliveira and Zaiat [35] with similar membrane surface area per working volume. Mathematical model can be certainly used to estimate the proper value of the membrane surface area thus improving the biogas desulfurization with biomembrane.
While some authors stated the overall mass transfer coefficient to be independent from the inlet H2 S concentration [32,33,36], others reported the decrease of mass transport coefficient with increasing the H2 S concentration [37]. Most of the authors reported mass transport coefficient to be gas phase controlled with the increase of kLa with increasing the gas flow rate [32-34,37-39] and independent to liquid velocity, except for Li, Wang, Koe and Teo [40], who observed the independence of kLa on gas velocity and found out mass transfer coefficient to be controlled by the resistance of the membrane. According to Marzouk et al. [41], the mass transfer coefficient is gas controlled at low pressures and liquid phase controlled at high pressures. The dependence of mass transfer coefficient on pH and temperature was observed by Tilahun et al. [37] (the higher the liquid pH value, the higher the kLa) and Minier-Matar et al. [36] (the higher the temperature, the higher the kLa).
As obvious from the literature, mass transfer coefficient can be influence by many parameters and as such it is hard to measure it. However, its value could be estimated by model calibrating to experimental data.
CONCLUSIONS
Mathematical model of H2 S oxidation in biomembrane was established for the first time:
- The model was calibrated with experimental data for lab-scale application and subsequently validated in pilot-scale application with good fit in terms of hydrogen sulfide concentration and the partial pressures of oxygen, nitrogen and methane. The parameter that needed to be adjusted during the validation was mass transfer coefficient.
- While modelling bare membrane and wet membrane set-ups, chemical sulfide oxidation showed its crucial importance.
- According to the sensitivity analysis, the most important parameters in biofilm compartment are mass transfer coefficient and membrane surface area. While biomembrane surface area can be adjusted by the technology as needed depending on the amount of H2 S to be removed, the mass transfer coefficient is influenced by many other factors and should be determined for each application separately. The model can serve to estimate mass transport coefficient properly as was done in this paper.
- The higher CO2 concentration in the air side of the model compare to the experimental results was most probably caused by the solubility of CO2 in the poly-dimethyl siloxane membrane.
ACKNOWLEDGEMENT
This work was accomplished with the financial support of the Czech Ministry of Education, Youth and Sports – Project No. MSM6046137308 (Czech Republic).
REFERENCES
- DL Russell. Practical wastewater treatment. John Wiley & Sons, Hoboken, NY. 2006.
- I Ramos, R Pérez, M Fdz-Polanco, Microaerobic desulphurisation unit: A new biological system for the removal of H2S from biogas. Bioresour Technol. 2013; 142: 633-640.
- AJH Janssen, G Lettinga, A de Keizer. Removal of hydrogen sulphide from wastewater and waste gases by biological conversion to elemental sulphur: Colloidal and interfacial aspects of biologically produced sulphur particles. Colloid and Interface Science. 1999; 151: 389-397.
- I Díaz, SI Pérez, EM Ferrero, M Fdz-Polanco. Effect of oxygen dosing point and mixing on the microaerobic removal of hydrogen sulphide in sludge digesters. Bioresour Technol. 2011; 102: 3768-3775.
- KL Ho, WC Lin, YC Chung, YP Chen, CP Tseng. Elimination of high concentration hydrogen sulfide and biogas purification by chemical- biological process. Chemosphere. 2013; 92: 1396-1401.
- D Pokorna, J Zabranska. Sulfur-oxidizing bacteria in environmental technology. Biotechnol Adv. 2015; 33: 1246-1259.
- C Buisman, R Post, P Ijspeert, G Geraats, G Lettinga. Biotechnological process for sulphide removal with sulphur reclamation. Acta Biotechnol. 1989; 9: 255-267.
- M Syed, G Soreanu, P Falletta, M Béland. Removal of hydrogen sulfide from gas streams using biological processes - A review. Can Biosyst Eng. 2006; 48.
- P Jenicek, CA Celis, J Koubova, D Pokorna. Comparison of microbial
activity in anaerobic and microaerobic digesters. Water Sci Technol. 2011; 63: 2244-2249.
- L Krayzelova, J Bartacek, N Kolesarova, P Jenicek. Microaeration for hydrogen sulfide removal in UASB reactor. Bioresour Technol. 2014; 172: 297-302.
- I Díaz, M Fdz-Polanco. Robustness of the microaerobic removal of hydrogen sulfide from biogas. Water Sci Technol. 2012; 65: 1368- 1374.
- I Ramos, R Pérez, M Reinoso, R Torio, M Fdz-Polanco. Microaerobic digestion of sewage sludge on an industrial-pilot scale: The efficiency of biogas desulphurisation under different configurations and the impact of O2 on the microbial communities. Bioresour Technol. 2014; 164: 338-346.
- L Pokorna-Krayzelova, J Bartacek, D Vejmelkova, AA Alvarez, P Slukova, J Prochazka, et al. The use of a silicone-based biomembrane for microaerobic H2S removal from biogas. Sep Purif Technol. 2017; 189: 145-152.
- L Pokorna-Krayzelova, J Bartacek, SN Theuri, CA Segura Gonzalez, J Prochazka, EIP Volcke, et al. Microaeration through a biomembrane for biogas desulfurization: lab-scale and pilot-scale experiences, Environmental Science. Water Sci Technol. 2018; 4: 1190-1200.
- P Reichert. AQUASIM 2.0 - Tutorial. Computer program for the identication and simulation of aquatic systems. Swiss Federal Institute for ES&T (EAWAG), Dubendorf, Switzerland. 1998.
- P Reichert. AQUASIM 2.0 - User manual. Computer program for the identication and simulation of aquatic systems. Swiss Federal Institute for ES&T (EAWAG), Dubendorf, Switzerland. 1998.
- E Nagy. Basic Equations of the Mass Transport through a Membrane Layer. Elsevier, London, UK. 2012.
- A Pauss, G Andre, M Perrier, SR Guiot. Liquid-to-gas mass transfer in anaerobic processes: Inevitable transfer limitations of methane and hydrogen in the biomethanation process. AEM. 1990; 56: 1636-1644.
- GWC Kaye, TH Laby. Tables of Physical and Chemical Constants, Longman. NY, USA. 1986.
- PS Stewart. Diffusion in biofilms. J Bacteriol. 2003; 185: 1485-1491.
- L Pokorna-Krayzelova, KE Mampaey, TPW Vannecke, J Bartacek, P Jenicek, EIP Volcke. Model-based optimization of microaeration for biogas desulfurization in UASB reactors. Biochem Eng J. 2017; 125: 171-179.
- AH Nielsen, J Vollertsen, T Hvitved-Jacobsen. Determination of Kinetics and Stoichiometry of Chemical Sulfide Oxidation in Wastewater of Sewer Networks. ES&T. 2003; 37: 3853-3858.
- B Kraftschik, WJ Koros, JR Johnson, O Karvan. Dense film polyimide membranes for aggressive sour gas feed separations. J Membr Sci. 2013; 428: 608-619.
- LJ Klinkenberg. The Permeability of Porous Media To Liquids And Gases. Drilling and Production Practice. 2012; 14.
- JA Rushing, KE Newsham, KC Van Fraassen. Measurement of the Two-Phase Gas Slippage Phenomenon and Its Effect on Gas Relative Permeability in Tight Gas Sands. SPE Annu Tech Conf. 2003; 9.
- B Flaconneche, J Martin, MH Klopffer, Permeability. Diffusion and Solubility of Gases in Polyethylene, Polyamide 11 and Poly (Vinylidene Fluoride). Oil Gas Sci Technol - Rev. IFP, 2001; 56: 261-278.
- Kunstsoffe. Gas Permeability of Fluoropolymers. 1980.
- G Genduso, E Litwiller, X Ma, S Zampini, I Pinnau. Mixed-gas sorption in polymers via a new barometric test system: sorption and diffusion
of CO2-CH4 mixtures in polydimethylsiloxane (PDMS). J Membr Sci. 2019; 577: 195-204.
- H Riasat Harami, F Riazi Fini, M Rezakazemi, S Shirazian. Sorption in mixed matrix membranes: Experimental and molecular dynamic simulation and Grand Canonical Monte Carlo method. J Mol Liq. 2019; 282: 566-576.
- VM Shah, BJ Hardy, SA Stern. Solubility of carbon dioxide, methane, and propane in silicone polymers: Effect of polymer side chains. J Polym Sci Part B: Polymer Physics. 1986; 24: 2033-2047.
- M Yasin, S Park, Y Jeong, EY Lee, J Lee, IS Chang. Effect of internal pressure and gas/liquid interface area on the CO mass transfer coefficient using hollow fibre membranes as a high mass transfer gas diffusing system for microbial syngas fermentation. Bioresour Technol. 2014; 169: 637-643.
- B Jefferson, C Nazareno, S Georgaki, P Gostelow, RM Stuetz, P Longhurst, et al. Membrane gas absorbers for H2S removal--design, operation and technology integration into existing odour treatment strategies. Environ Technol. 2005; 26: 793-804.
- N Boucif, E Favre, D Roizard, M Belloul. Hollow fiber membrane contactor for hydrogen sulfide odor control. AIChE Journal, 2008; 54: 122-131.
- A Esquiroz-Molina, S Georgaki, R Stuetz, B Jefferson, EJ McAdam. Influence of pH on gas phase controlled mass transfer in a membrane contactor for hydrogen sulphide absorption. J Membr Sci. 2013; 427: 276-282.
- PR Camiloti, GHD Oliveira, M Zaiat Sulfur recovery from wastewater using a micro-aerobic external silicone membrane reactor (ESMR). Water Air Soil Pollut. 2016; 227.
- J Minier-Matar, A Janson, A Hussain, S Adham. Application of membrane contactors to remove hydrogen sulfide from sour water.J Membr Sci. 2017; 541: 378-385.
- E Tilahun, A Bayrakdar, E Sahinkaya, B Çalli. Performance of polydimethylsiloxane membrane contactor process for selective hydrogen sulfide removal from biogas. Waste Manag. 2017; 61: 250- 257.
- M Hedayat, M Soltanieh, SA Mousavi. Simultaneous separation of H2S and CO2 from natural gas by hollow fiber membrane contactor using mixture of alkanolamines. J Membr Sci. 2011; 377: 191-197.
- P Jin, C Huang, Y Shen, X Zhan, X Hu, L Wang, at al. Simultaneous Separation of H2S and CO2 from Biogas by Gas–Liquid Membrane Contactor Using Single and Mixed Absorbents. Energy & Fuels. 2017; 31: 11117-11126.
- K Li, D Wang, CC Koe, WK Teo. Use of asymmetric hollow fibre modules for elimination of H2S from gas streams via a membrane absorption method. Chem Eng Sci. 1998; 53: 1111-1119.
- SAM Marzouk, MH Al-Marzouqi, M Teramoto, N Abdullatif, ZM Ismail. Simultaneous removal of CO2 and H2S from pressurized CO2–H2S– CH4 gas mixture using hollow fiber membrane contactors. Sep Purif Technol. 2012; 86: 88-97.


