Sustainable Operations for Distillation Columns
- 1. Department of Chemical and Biomolecular Engineering, University of Nebraska Lincoln, USA
ABSTRACT
Distillation process consumes about 40% of the total energy used to operate the plants in petrochemical and chemical process industries in North America. Therefore, sustainable distillation column operation requires responsible use of energy and reduction of harmful emission such as CO2 . The Aspen Plus ‘Column Targeting Tool’ (CTT) options in a simulation environment can help reduce the use of energy and hence CO2 emission. The Aspen plus ‘Carbon Tracking’ (CT) together with the ‘Global Warming Potential’ options can quantify the reduction in CO2 emission. The CTT is based on the practical near-minimum thermodynamic condition approximation and exploits the capabilities for thermal and hydraulic analyses of distillation columns to identify the targets for possible column modifications. By using the ‘CO2 emission factor data source’ and fuel type, the CT estimates the total CO2 emission and net carbon fee/tax in the use of utility such as steam. A comparative assessment with the sustainability metrics displays the usage of energy, emission of CO2 , and cost before and after the distillation column modifications. This study comprises both an interactive and graphically-oriented case study with simulation tool and sustainability metrics for quantifying the reduction in the energy consumption and CO2 emission in distillation column operations.
KEYWORDS
Sustainability metrics
Distillation column
Column targeting tool
Column grand composite curves
Carbon tracking; Global warming potential
CITATION
Demirel Y (2013) Sustainable Operations for Distillation Columns. Chem Eng Process Tech 1: 1005.
INTRODUCTION
The U.S. Department of Energy estimates that there are more than 40,000 distillation columns consuming about 40% of the total energy used to operate the plants in petrochemical and chemical process industries in North America [1,2]. A typical distillation column resembles a heat engine delivering separation work by using heat at a high temperature in the reboiler and discharging most of it to the environment at a lower temperature in the condenser [3]. Aspen Plus ‘Column Targeting Tool’ (CTT) is based on the Practical Near-Minimum Thermodynamic Condition (PNMTC) approximation representing a practical and close to reversible operation [4-9]. It exploits the capabilities for thermal and hydraulic analyses of distillation columns to identify the targets for possible column modifications in: 1) stage feed location, 2) reflux ratio, 3) feed conditioning, and 4) side condensing and/or reboiling. These modifications can reduce the utility usage and improve energy efficiency.
The options of CTT can help reduce the use of energy, while the ‘Carbon Tracking’ (CT) and Global Warming Potential options can help quantify the reduction in CO2 emission in a simulation environment. If nonrenewable and limited, energy usage affects environment through the emission of pollutants such as CO2 . Sustainability has environmental, economic, and social dimensions and requires the responsible use of resources such as energy and reduction in CO2 emission. The three intersecting dimensions illustrate sustainability metrics (3D) that include material use, (nonrenewable) energy use, and toxic and pollutant emissions [10-14]. In this study, the energy and CO2 emission as the pollutant are used as the sustainability metrics in distillation column operations. This study demonstrates how to reduce and quantify the energy consumption and CO2 emissions with the sustainability metrics in distillation column operations.
MATERIALS AND METHODS
Sustainability
Sustainability is maintaining or improving the material and social conditions for human health and the environment over time without exceeding the ecological capabilities that support them [6]’. The dimensions of sustainability are economic, environmental, and societal (Figure 1).
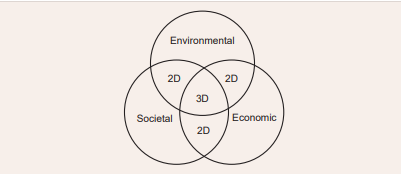
Figure 1: Three dimensions of sustainability
The Center for Waste Reduction Technologies (CWRT) of the American Institute of Chemical Engineers (AIChE) and the Institution of Chemical Engineers (IChemE) proposed a set of sustainability metrics that are quantifiable and applicable to a specific process [15,16]
• Material intensity (nonrenewable resources of raw materials, solvents/unit mass of products)
• Energy intensity (nonrenewable energy/unit mass of products)
• Potential environmental impact (pollutants and emissions/unit mass of products)
• Potential chemical risk (toxic emissions/unit mass of products) The first two metrics are associated with the process operation. The remaining two metrics represent chemical risk to human health in the process environment, and the potential environmental impact of the process on the surrounding environment. For distillation column operations, this study uses a comparative assessment with the sustainability metrics of:
• ‘Energy intensity’ as nonrenewable energy/unit mass of products by using ‘Column Targeting Tool.’
• ‘Potential environmental impact’ as emissions and cost/ unit mass of products by using ‘Carbon Tracking’ and ‘Global Warming Potential’ options of the Aspen Plus simulator.
Column targeting tool
The Column Targeting Tool (CTT) of Aspen Plus is a conceptual design tool for lowering cost of operation through modified operating conditions, and providing insight into understanding tray/packing capacity limitations. The CTT is based on the Practical Near-Minimum Thermodynamic Condition (PNMTC) representing a close to practical reversible column operation [10]. For RadFrac, MultiFrac, and PetroFrac column models, the CTT performs thermal, exergy, and hydraulic analyses capabilities that can help identify the targets for appropriate column modifications in order to [7,14,17].
• Reduce utilities cost
• Improve energy efficiency
• Reduce capital cost by improving thermodynamic driving forces
• Facilitate column debottlenecking
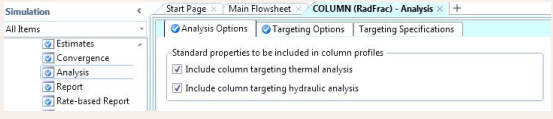
The CTT can be activated by using the corresponding option on the Analysis / Analysis Options sheets, as shown in (Table 1)
Table 1: Analysis / Analysis Options to activate the Column Targeting Tools (CTT).
. Results of the column targeting analysis depend strongly on the selection of light key and heavy key components in Targeting Options (Table 2) [7].
Table 2: Analysis / Targeting Options with key component specification.

Before designating light key and heavy components for the column (see Table 3)
Table 3: Selection of key components within the ‘Targeting Options’ [7].
|
Method |
Use When |
|
User defined |
Allows you to specify the light key and heavy key components. |
|
Based on component split- fractions |
This method is best for sharp or near-sharp splits fractions in product streams. |
|
Based on component K-values |
This method is best for sloppy splits. |
|
Based on column composition profiles |
In principle, this method is similar to the K-value based method. It is best suited for sloppy splits and it is, in general, inferior to the K-value based method. |
, the user runs the simulation and inspects the column split-fractions, composition profiles, and component K-values displayed by the ‘Plot Wizard.’ If there is more than one light key component, the heaviest of them is selected as the light key. In case of multiple heavy key components, the lightest is selected as the heavy key. In the default method, key components are selected based on the component K-values. The CTT has a built-in capability to select light and heavy key components for each stage of the column [7].
Thermal analysis
Thermal analysis capability is useful in identifying design targets for improvements in energy consumption and efficiency [7,11-14,18-20]. In this capability the reboiling and condensing loads are distributed over the temperature range of operation of the column. The thermal analysis of CTT produces ‘ColumnGrand Composite Curves’ (CGCC) and ‘Exergy Lost Profiles.’ The user makes changes to column specifications until the profiles look right based on the column targeting methodology. The CGCCs are displayed as the stage-enthalpy (Stage-H) or temperature-enthalpy (T-H) profiles. They represent the theoretical minimum heating and cooling requirements in the temperature range of separation. This approximation takes into account the inefficiencies introduced through column design and operation, such as pressure drops, multiple side-products, and side strippers. The CGCCs are helpful in identifying the targets for potential column modifications for
1. Feed stage location (appropriate placement)
2. Reflux ratio modification (reflux ratio vs. number of stages)
3. Feed conditioning (heating or cooling)
4. Side condensing or reboiling (adding side heater and/or cooler) The equations for equilibrium and operating lines are solved simultaneously at each stage for specified light key and heavy key components. Using the equilibrium compositions of light L and heavy H key components the enthalpies for the minimum vapor and liquid flows are obtained by
where V* and L* are the molar flows of equilibrium, and
are the enthalpies of equilibrium vapor and liquid streams leaving the same stage, respectively, and the minimum vapor and liquid flow rates leaving the same stage with the same temperatures can be estimated by [13,14,18-20]
From the enthalpy balances at each stage, the net enthalpy deficits are obtained by
(Before the feed stage )
(After the feed stage)
After adding the individual stage enthalpy deficits to the condenser duty, the enthalpy values are cascaded, and plotted in the CGCC. This is called the top-down calculation procedure. At the feed stage, mass and energy balances differ from an internal stage and the enthalpy deficit at the feed stage becomes
The values of and
may be obtained from an adiabatic flash for a single phase feed, or from the constant relative volatility estimated with the converged compositions at the feed stage and feed quality. This procedure can be reformulated for multiple feeds and side products as well as different choices of the key components. In a CGCC, a pinch point near the feed stage occurs for nearly binary ideal mixtures. However, for nonideal multicomponent systems pinch may exist in rectifying and stripping sections. Exergy (Ex) is defined the maximum amount of work that may be performed theoretically by bringing a resource into equilibrium with its surrounding through a reversible process.
Where H and S are the enthalpy and entropy, respectively, and is the reference temperature, which is usually assumed as the environmental temperature of 298.15 K. A part of accessible work potential is always lost in any real process. Exergy losses (destructions) represent inefficient use of available energy due to irreversibility, and should be reduced by suitable modifications [11,12,17].Exergy balance for a steady state system is
Where is the shaft work? As the exergy loss increases, the net heat duty has to increase to enable the column to achieve a required separation. Consequently, smaller exergy loss means less waste energy. The exergy profiles are plotted as stateexergy loss or temperature-exergy loss. In general, the exergy loss profiles can be used as a tool to examine the degradation of accessible work due to [7,11,12].
• Momentum loss (pressure driving force)
• Thermal loss (temperature driving force)
• Chemical potential loss (mass transfer driving force)
Hydraulic analysis
Tray or packing rating information for the entire column is necessary to activate the hydraulic analysis. In addition, allowable flooding factors (as fraction of total flooding) for flooding limit calculations can be specified. Hydraulic analysis helps identify the allowable limit for vapor flooding on the Tray Rating Design/ Pdrop or Pack Rating|Design/Pdrop sheets. The default values are 85% for the vapor flooding limit and 50% for the liquid flooding limit. The liquid flooding limit specification is available only if the down comer geometry is specified. The allowable limit for liquid flooding (due to down comer backup) can be specified on the Tray Rating|Downcomers sheet [7,13,14]. The hydraulic analysis capability helps understand how the vapor and liquid flow rates in a column compare with the minimum (corresponding to the PNMTC) and maximum (corresponding to flooding) limits. For packed and tray columns, jet flooding controls the calculation of vapor flooding limits. For tray columns, parameters such as downcomer backup control the liquid flooding limits. Hydraulic analysis produces plots for flow rates versus stage and can be used to identify and eliminate column bottlenecks [7]. Graphical and tabular profiles (Table 4) help identifying targets and analysis for possible modifications by the user.
Table 4: Profiles / Thermal Analysis.

The ‘Plot Wizard’ (Figure 2) produces various plots including the types:
• Thermal analysis: The CGCC (T-H) Temperature versus Enthalpy
• Thermal analysis: The CGCC (S-H) Stage versus Enthalpy
• Hydraulics analysis: Thermodynamic Ideal Minimum Flow, Hydraulic Maximum Flow, Actual Flow
• Exergy loss profiles: Stage versus Exergy Loss or Temperature versus Exergy Loss
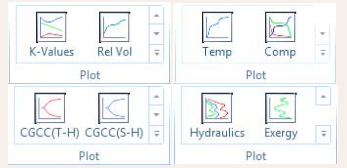
Figure 2: Plot Wizard displays several plots as a part of ‘Analysis’ and ‘Column Targeting Tool.’
RESULTS AND DISCUSSIONS
Sustainable column operation is illustrated in the following example using a RADFRAC column (Figure 3), which will be the base case.
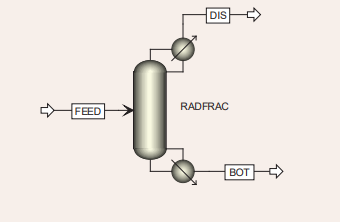
Figure 3: RadFrac column.
The input summary showing the feed flow rate, feed composition, column configuration, and utility bloc definitions are given below.
COMPONENTS: C2H6 C2H6 / C3H8 C3H8 / C4H10-1 C4H10- 1 / C5H12-1 C5H12-1 / C6H14-1 C6H14-1 / WATER H2O PROPERTIES RK-SOAVE STREAM FEED: TEMP=225o F PRES=250 psia; MOLE-FLOW C2H6 30 / C3H8 200 / C4H10-1 370 / C5H12- 1 350 / C6H14-1 50 lbmol/hr BLOCK RADFRAC RADFRAC: NSTAGE=14;CONDENSER=PARTIAL-V; FEED 4 PRODUCTS BOT 14 L / DIS 1 V; P-SPEC 1 248 psia COL-SPECS D:F=.226 MOLE DP-COL=4 MOLE-RR=6.06 TRAY-SIZE 1 2 13 SIEVE , TRAYRATE 1 2 13 SIEVE DIAM=5.5 ft UTILITIES COND-UTIL=CW REBUTIL=STEAM UTILITY Water; COST = 0.05 $/ton ; PRES=20. PRES-OUT=20. psia; TIN=50. TOUT=75. F UTILITY STEAM; COST =6. $/ton ; STEAM HEATING-VALU=850.0 Btu/lb CALCCO2=YES FACTORSOURCE=”US-EPA-Rule-E9-5711” FUELSOURCE= “Natural gas” CO2FACTOR=1.30000000E-4
Sustainability metrics: potential environmental impact
This study quantifies the sustainability metrics of ‘potential environmental impacts,’ which is the emissions/unit mass of product and carbon tax, by using the Aspen Plus options of (1) ‘Carbon Tracking’ and (2) ‘Global Warming Potential’ (GWP).
Carbon tracking: In each utility block, ‘carbon Tracking’ allows the calculation of CO2 emissions after specifying ‘CO2 emission factor data source’ and ‘ultimate fuel source’ from built-in data. The CO2 emission factor data source can be from European Commission decision of ‘2007/589/EC’ or United States Environmental Protection Agency Rule of ‘E9-5711’ [21,22]. This source can also be directly specified by the user. In this example, CO2 emission factor data source is US-EPA-Rule-E9-5711 and the fuel source is natural gas as seen in (Table 5).
Table 5: Utilities /Steam / Input / Carbon Tracking / Calculate CO2 emissions

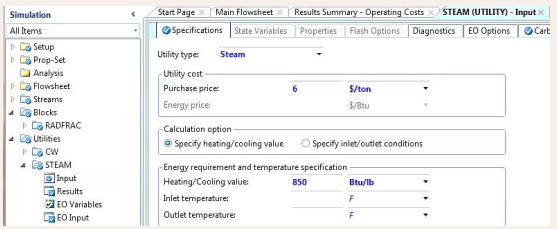
The utilities used in the column include cooling water and steam. For example, the steam utility is created as shown in (Table 6).
Table 6: Utilities / New / STEAM / Input / Specifications.
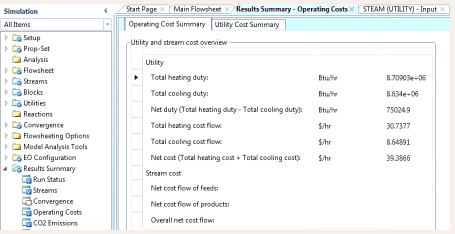
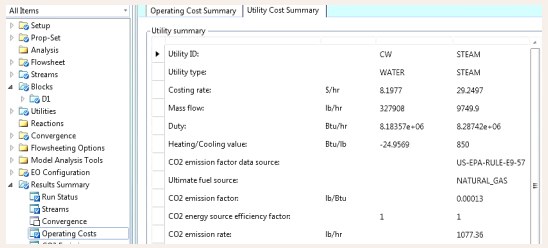
The Results Summary | Operating Costs | Utility Cost Summary sheet displays the total heating and cooling duties as well as their costs (Table 7).
Table 7: Results Summary | Operating Costs | Operating Cost Summary
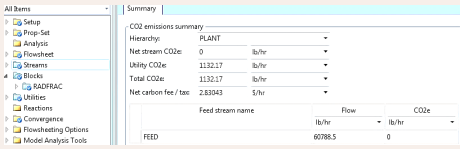
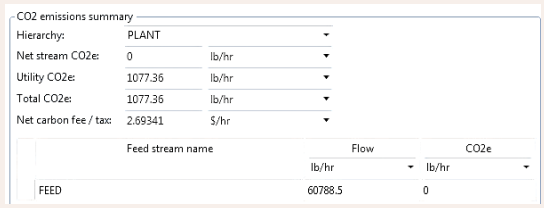
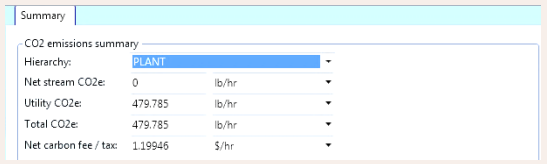
The rate and cost of CO2 emission results would be available within the ‘Results Summary / CO2 Emissions’ as seen in (Table 8).
Table 8: Results Summary / CO2 Emissions / Summary.

Global warming potential: Aspen Plus reports greenhouse gas emissions in terms of CO2 equivalents of “Global Warming Potential’ (GWP). CO2 is one of the greenhouse gases that cause around 20% of GWP. To use this feature one can create a property set (Table 9).
Table 9: Property Set / Properties

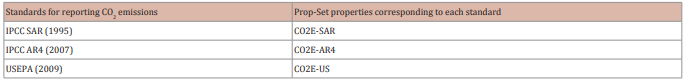
Prop-Set properties report the carbon equivalents of streams based on data from three popular standards for reporting such emissions: 1) the IPCC’s 2nd (SAR), 2) 4th (AR4) Assessment Reports, and 3) the U.S. EPA’s (CO2 E-US) proposed rules from 2009 (Table 10) [21,22].
Table 10: Standards for reporting CO2 emissions.
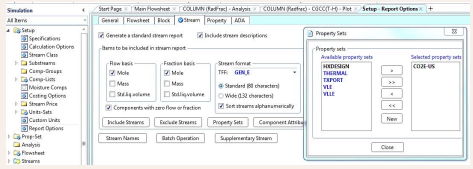
Prop-Set properties are reported in stream reports after selected: Report Options / Streams / Property sets (Table 11).
Table 11: Setup | Report Options | Stream / Property Sets.
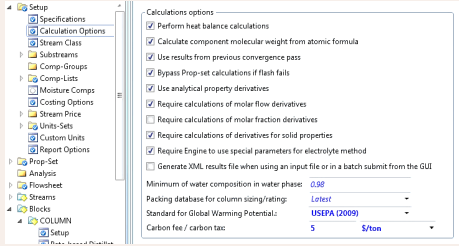
The Setup | Calculation Options | Calculations sheet activates the Standards for ‘Global Warming Potential’ as well as ‘Carbon fee/carbon tax’ (Table 12).
Table 12: Setup / Calculation Options / Standard for Global Warming Potential / Carbon fee (tax).
The ‘Results’ form of each ‘Utility’ block displays the CO2 equivalents emitted by this utility in each unit operation block where it is used. Each block also reports these CO2 equivalents in their own results forms together with the other utility results. These results also appear in the report file (Table 13).
Table 13: Report / Utilities

Sustainability metrics: energy intensity This study calculates the sustainability metrics ‘Energy intensity’ as nonrenewable energy/unit mass of products by using the Aspen plus Column Targeting Tool capabilities of ‘Thermal Analysis’ and ‘Hydraulic Analysis.’ Activation of ‘Tray Rating’ (Table 14) is necessary for the ‘Hydraulic Analysis’ capabilities
Table 14: Column / Tray Rating / New / Setup / Specs.

• Column / Tray Rating / New / Setup / Specs
• Column / Analysis / Analysis Options / Hydraulic analysis The CGCCs are helpful in identifying the targets for potential column modifications for
1. Feed stage location (appropriate placement)
2. Reflux ratio modification (reflux ratio vs. number of stages)
3. Feed conditioning (heating or cooling)
4. Side condensing or reboiling (adding side heater and/or cooler) (Table 15) displays the condenser and reboiler duties as well as the CO2 emission rate for the base case, while (Table16) shows the carbon fee (tax).
Table 15: Base case: NF = 4; RadFrac / Results : CO2 emission rate = 1132.2 lb/hr.
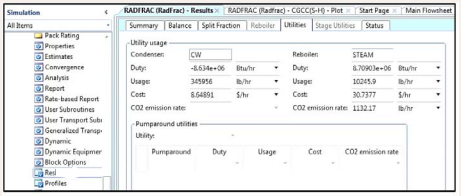
Table 16: Base case: Result Summary / CO2 Emissions: Net carbon fee = $2.83/hr.
Modifying the feed stage location
In Aspen Plus, the condenser is the first stage, while the reboiler is the last stage. The Stage-H plots of CGCC can identify distortions because of inappropriate feed placements. The distortions become apparent as significant projections at the feed location called the pinch point due to a need for extra local reflux to compensate for inappropriate feed placement. A correctly introduced feed removes the distortions and reduces the condenser and reboiler duties.
• If a feed is introduced too high up in the column, a sharp enthalpy change occurs on the condenser side on the stage-H CGCC plot; the feed stage should be moved down the column.
• If a feed is introduced too low in the column, a sharp enthalpy change occurs on the reboiler side on the stage-H CGCC; the feed stage should be moved up the column [1,20].
For the base operation, Stage-Enthalpy plot displays a sharp change on the condenser side around feed stage 4 (Figure 4).
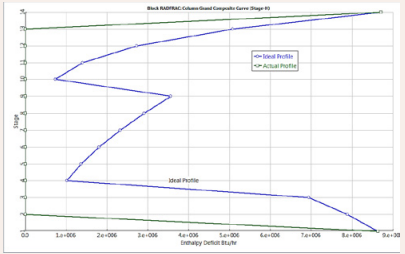
Figure 4: Base case: NF=4; Stage-Enthalpy plot of Column Grand Composite Curve.
This should be corrected by moving the feed stage down.
Condenser side projects excessive loss of accessible work: Exloss = 300,000 Btu/hr (Figure 5).
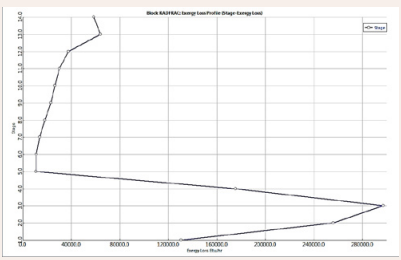
Figure 5: Base case: NF = 4: Analysis / Exergy loss profile.
This may be due to misplaced feed location and original partial condenser load and column configuration. The ‘Hydraulic Analysis’ is activated after creating the ‘Tray Rating.’ Hydraulic Analysis display three important flow plots: ideal minimum flow, actual flow, and hydraulic maximum flow, the plots indicate that between stages 1 to 4 actual and ideal flows are far apart from each other (Figure 6).
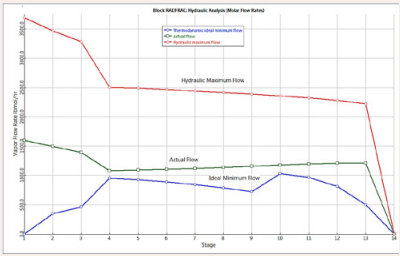
Figure 6: Base case: NF = 4; Analysis / Hydraulic Analysis.
Moving the feed stage from 4 to 7 removes the sharp changes around the feed stage 4 as seen in (Figure 7).
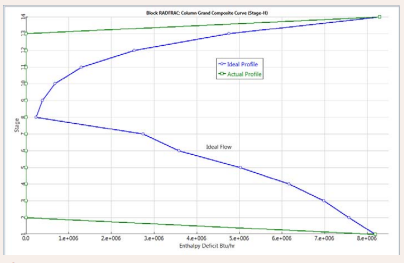
Figure 7: Modified case I: NF = 7; Analysis / Stage-Enthalpy
The sustainability metrics after moving the feed stage from 4 to 7 show the reduction of
Table 17: Modified case I: NF = 7; RADFRAC / Results / Utilities
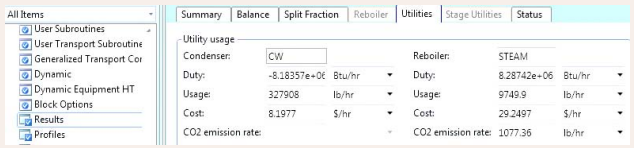
• CO2 emission rate from 1132.2 lb/hr to 1077.4 lb/hr representing a 4.8% decrease as seen in (Tables 16 and Table 17).
• Condenser duty from -8.634e+6 Btu/hr to -8.183e+6 Btu/ hr.
• Reboiler duty from 8.714e+6 Btu/hr to 8.28e+6 Btu/hr.
• The net carbon fee decreased from $2.8/hr to $2.7/hr (Tables 16 and Table 18).
Table 18: Modified case I: NF = 7; Result summary / CO2 Emissions / Summary
• Table 19 indicates that other alternative feed stages 6 would not produce favorable CO2 emission rate; the rate of 1084.6 lb/hr for NF = 6 is higher than that of 1077.4 lb/ hr for NF = 7. Hence it is disregarded.
Table 19: Modified case II: NF = 6; Results / Utilities
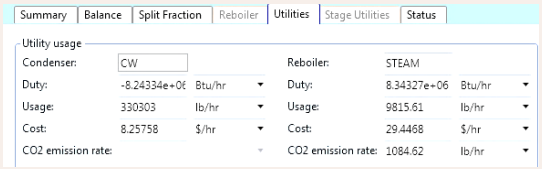

Figure 8: Modified case I: NF = 7; Analysis / Stage-Exergy Loss Profile. Exloss = 160,000 Btu/hr.
Figures 5 and Figure 8 indicate that the maximum rate of exergy loss is reduced from 300,000 Btu/hr to 160,000 Btu/hr after moving the feed stage from 4 to 7.This represents around 46% reduction in the accessible work loss after the modification.
Modifying the reflux ratio
The horizontal gap between the CGGC T-H pinch point and the ordinate represents the excess heat, and therefore, the scope for a reduction in reflux ratio [7,18]. As the reflux ratio is reduced the CGCC will move towards the ordinate and hence reduce both the reboiler and condenser duties. However, to preserve the separation, the number of stages must increase. Figure 7 and Table 20 with the modified feed stage and will represent the base case for possible reflux ratio (RR= 6.06) modifications: the gap between the pinch point and ordinate suggests that the duties in the reboiler and condenser can be further reduced by reducing reflux ratio.
Table 20: Base Case I: N = 14, NF=7; RR= 6.06; Results Summary / Operating Costs.
In the first modification, reflux ratio is reduced to RR = 4.5 from RR = 6.06. As the reflux ratio is reduced, number of stages is increased to N = 20 with the feed stage NF = 12 (instead of NF = 7). Figure 9 displays the CGCC Stage-H plot.

Figure 9: Modified case I: N = 20, NF=12; RR= 4.5; Analysis / CGCC Stage Enthalpy.
Table 21 indicates that with the decreased reflux ratio from 6.06 to 4.5
Table 21: Modified case I: N = 20, NF=12; RR= 4.5.
• CO2 emission rate decreased from 1077.4 lb/hr to 813.1 lb/hr (around 24% reduction in CO2 emission).
• The reboiler duty decreased from 8.28 e+06 Btu/hr to 6.25 e+06 Btu/hr, which caused the reduction in CO2 emission.
• The condenser duty decreased from 8.19 e+06 Btu/hr to 6.16 e+06 Btu/hr.
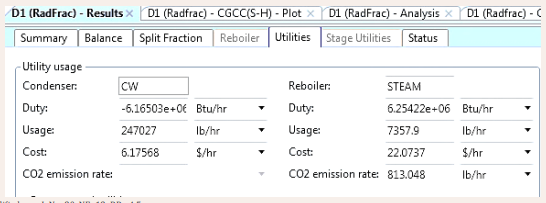
In the second modification, (Figure 10) shows the CGCC with RR = 2.5, N = 28 and NF = 14. As (Table 22) indicates that with the decreased reflux ratio from 6.06 to 2.5
Table 22: Modified case II: N = 28, NF=14; RR= 2.5; Results / Utilities.
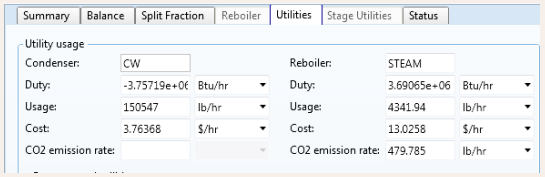
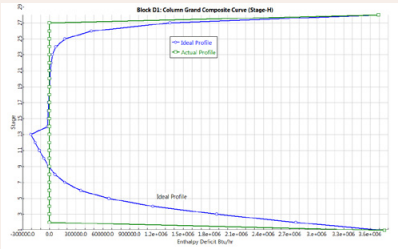
Figure 10: Modified case II: N = 28, NF=14; RR= 2.5; Analysis / CGCC StageEnthalpy
• CO2 emission rate decreased from 1077.4 lb/hr to 479.8 lb/hr (around 55% reduction)
• The reboiler duty decreased from 8.28e+06 Btu/hr to 3.69e+06 Btu/hr.
• The condenser duty decreased from 8.19 e+06 Btu/hr to 3.75e+06 Btu/hr.
• Net carbon fee is reduced from $2.7/hr to $1.2/hr, as seen in (Table 23)
Table 23: Modified case II: N = 28, NF=14; RR= 2.5; Results / Utilit
With the decreased reflux ratio from 6.06 to 2.5, (Figure 11) indicates that
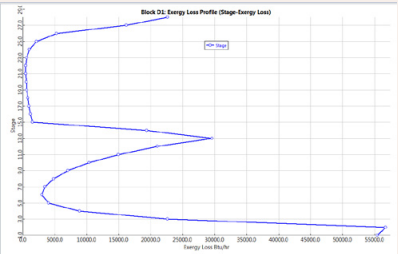
Figure 11: Modified case II: N = 28, NF=14; RR= 2.5; Analysis / Stage-Exergy loss.
• The exergy loss at the condenser is reduced from Exloss = 160000 Btu/hr to Exloss = 55,000 Btu/hr.
• The exergy loss at the feed stage is reduced from Exloss = 135000 Btu/hr to Exloss = 30,000 Btu/hr. As seen in (Figure 12), except the stages close to condenser, the actual flow closely follows the thermodynamic ideal minimum flow with the decreased reflux ratio from 6.06 to 2.5. This represents close to optimum flow conditions in most of the stages.
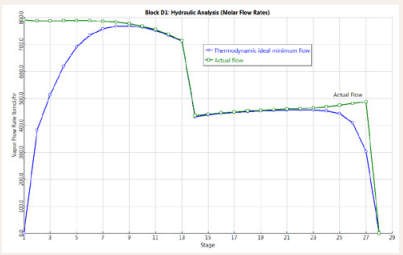
Figure 12: Modified case II: N = 28, NF=14; RR= 2.5; Analysis / Hydraulic Analysis.
Feed conditioning
Figure 7 and Figure 8, and (Table 17) display the base case with the feed temperature of 225o F. The need for an adjustment of feed quality can be identified from sharp enthalpy changes on the stage-H or temperature-H CGCC plot
• If a feed is excessively sub-cooled, the T-H CGCC plots will show a sharp enthalpy changes on the reboiler side, and extent of this change determines the approximate feed heating duty required.
• If a feed is excessively over heated, the T-H CGCC plots will show a sharp enthalpy changes on the condenser side, and extent of this change determines the approximate feed cooling duty required.
• Changes in the heat duty of pre-heaters or pre-coolers will lead to similar duty changes in the column reboiler or condenser loads, respectively.
There is a sharp change in enthalpy above the feed stage yet it is not close to reboiler in the CGCC Stage-Enthalpy plot shown in (Figure 7). This still indicates sub cooling of the feed; therefore, feed temperature should be increased. In the modification, the feed temperature is increased from 225o F to 250o F. Figure 13 shows the S-H CGCC. Table 24 shows that after preheating
Table 24: Results/ Utilities
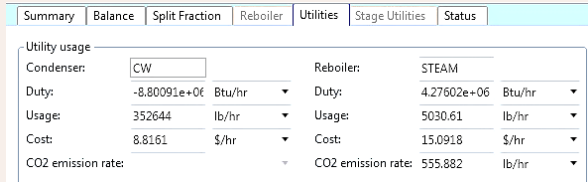
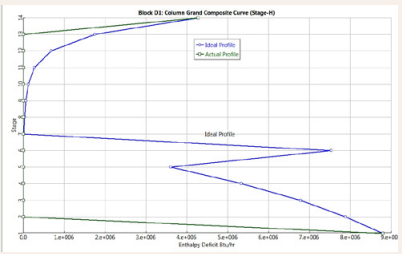
Figure 13: Modified case I: TF =250 oF; RR=6.05; N = 14; NF = 7; Analysis / Thermal Analysis CGCC Stage-Enthalpy.
• The reboiler duty decreased from QR = 8.3e+06 Btu/hr to QR = 4.3e+06 B tu/hr and the cost decreased from $29/ hr to $15/hr.
• The condenser duty increased from QC = 8.18e+06 Btu/ hr to QC = 8.80e+06 B tu/hr and the cost decreased from $8.2/hr to $8.8/hr.
• The CO2 emission decreased from 1077 lb/hr to 555.8 lb/ hr.
Figure 14 shows that the exergy loss increased from 160000 Btu/hr to 230000 Btu/hr around the condenser due to the increased cooling duty.
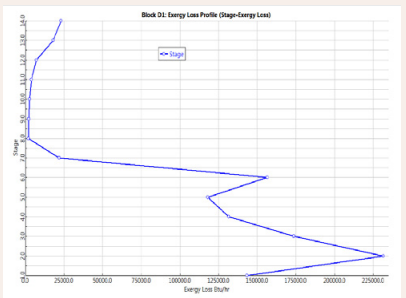
Figure 14: Modified case I: TF =250 oF; RR=6.05; N = 14; NF = 7; Analysis / Thermal Analysis CGCC Stage-Exergy loss.
Side condensing or side reboiling
Feed conditioning is usually preferred to side condensing or side reboiling. Side condensing or side reboiling is external modification at a convenient temperature level. The scope for side condensing or side reboiling can be identified from the area beneath and/or above the CGCC pinch point (area between the ideal and actual enthalpy profiles). This area could be reduced by integrating side condensing and/or reboiling on an appropriate stage [1,19,10,18]. If a significant area exists above the pinch, a side reboiler can be placed at a convenient temperature level. This allows heat supply to the column using a low-cost hot utility, hence lowering the overall operating costs.
If a significant area exists below the pinch, a side condenser can be placed at a convenient temperature level. This allows heat removal from the column more effectively and by a cheaper cold utility, hence lowering the overall operating costs.
Table 17 and Figure 7 represent the base case. Figure 7 shows a significant area existing below and above the pinch between ideal and actual profiles; therefore a side condenser and a heater can be placed at convenient temperature levels (stages). In this modification, a side condenser is installed at stage 6 to remove −7.5e+06 Btu/hr and a side heater is installed at stage 11 supplying 5.0e+06 Btu/hr at a cheaper rate. Side condensers and heaters are installed using ‘Heaters Coolers’ block (Table 25) (Figure 15) displays the CGCC temperature-enthalpy plot.
Table 25: Side heater installation: Heaters Coolers / Side Duties.

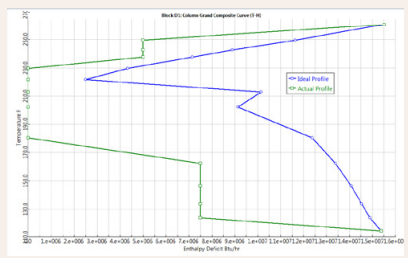
Figure 15: Modified case: TF =225 oF; RR=6.05; N = 14; NF = 7; Analysis / Thermal Analysis / CGCC Temperature-Enthalpy; Side cooler at stage 6: QC = −7.5e+06; Side heater at stage 11: QR = 5e+06.
Tables 4, 26 shows that
Table 26: Modified case: TF =225 oF; RR=6.05; N = 14; NF = 7; Results / Utilities; Side cooler at stage 6: QC = −7.5e+06 Btu/hr; Side heater at stage 11: QR = 5e+06 Btu/hr
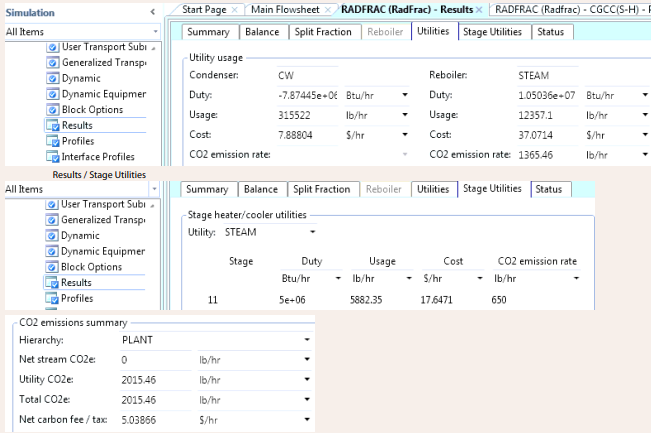
• Total condenser duty increased to (−7.874e+06 -7.5e+06) Btu/hr from −8,2e+06 Btu/hr.
• Total reboiler duty increased to (−1.050e+07 +5.0e+06) Btu/hr from 8,28e+06 Btu/hr.
• CO2 emission rate increased to 2015 lb/hr from 1077 lb/ hr.
Table 26 shows the increase in energy usage, CO2 emission, and net carbon fee. Also, the cost of external installation of heat exchangers has to be considered. Overall these modifications do not lead to sustainable operation as they violate the both sustainable metrics of ‘Energy intensity’ and ‘Potential environmental impact.’
CONCLUSIONS
This study demonstrates a conceptual design tool of the Aspen Plus simulator for sustainable operation of distillation columns, which are highly energy intensive and an important part of chemical and petrochemical process industries. The ‘Column Targeting Tool (CTT)’ can help reduce the use of energy and hence emission. The ‘Carbon Tracking (CT)’ and ‘Global Warming Potential’ options can help quantify the reduction in
emission. They can be part of sustainability metrics of ‘Energy intensity’ and ‘Potential environmental impact’ for existing and new design of distillation column operations. An integrated approach of combination of column targeting tools, carbon tracking, pinch analysis with existing process heats, and overall process simulation may lead to sustainable chemical and petrochemical process industries.
REFERENCES
- US. DOE, Office of Energy Efficiency and Renewable Energy, “Distillation Column Modeling Tools,” DOE. Washington, DC.
- White DC Optimize energy use in distillation. CEP. 2012; 35-41.
- Pinto FS, Zemp R, Jobson M, Smith R. Thermodynamic optimization of distillation columns. Chem Eng Sci. 2011; 66: 2920-34.
- Martins AA, Mata TM, Costa CAV, Sikdar SK. Framework for sustainability metrics. Ind Eng Chem Res. 2007; 46: 2962-73.
- Schwarz J, Beloff BR, Beaver E. Use Sustainability metrics to guide decision-making. CEP 2002: July: 58-63.
- Sikdar SK. Sustainable Development and Sustainability Metrics. AIChE J. 2003; 49: 1928-32.
- Aspen Technology:accessed in 2013.
- Al-Muslim, H.Dincer, I. Thermodynamic analysis of crude oil distillation systems. Int J Energy Res. 2005; 29: 637-55.
- Tanzil D, Beloff BR. Overview on Sustainability Indicators and Metrics. Environ Quality Management. 2006; 42-56.
- Clift R. Sustainable development and its implications for chemicalengineering. Chem Eng Sci. 2006; 61: 4179-87.
- Ameta G, Rachuri S, Fiorentini X, Mani M, Fenves S, Lyons J et al. Extending the notion of quality from physical metrology to information and sustainability. J Intell Manuf. 2009.
- Dhole VR. Linnhoff B. Distillation column targets. Comp Chem Eng. 1993; 17: 549-60.
- De Koeijer GM, Rivero R. Entropy production and exergy loss in experimental distillation columns. Chem Eng Sci. 2003; 58: 1587-97.
- Rivero R. Garcia M. Urquiza J. Simulation exergy analysis and application of diabatic distillation to a tertiary amyl methyl ether production unit of a crude oil refinery. Energy, 2004; 29: 467-89.
- Demirel Y. Thermodynamic Analysis of Separation Systems. Sep Sci Technol. 2004; 39: 3897-942.
- Demirel Y. Retrofit of Distillation Columns by Thermodynamic Analysis. Sep Sci Technol. 2006; 41: 791-817.
- Center For Waste Reduction, Technologies Focus Area: Sustainability Metrics, 2004 (available at http://www.aiche.org/ cwrt/pdf/ BaselineMetrics.pdf, 2004).
- Chem E. Sustainable Development Progress Metrics Recommended for use in the Process Industries, 2004 (available at http:// www. icheme.org/sustainability/metrics.pdf).
- Demirel Y. Exergy analysis of distillation columns. Int J Exergy. 2006; 3: 345-61.
- Bandyopadhyay S. Malik RK. Shenoy UV. Temperature-enthalpy curve for energy targeting of distillation columns. Comput Chem Engng. 1998; 22: 1733-44.
- Agrawal R. Herron DM. Efficient use of an intermediate reboiler or condenser in a binary distillation. AIChE J 1998; 44: 1303-14.
- Bandyopadhyay, S. Effect of feed on optimal thermodynamic performance of a distillation column. Chem Eng J. 2002; 88: 175-86.
- European Commission Decision 2007/589/EC: Official Journal of the European Commission, 31.8.2007, L229/1.
- United States Environmental Protection Agency Rule E9-5711: Federal Register / Vol. 74, No. 68 / Friday, April 10, 2009 / Proposed Rules, pp 16639-16641 (Table C-1. C-2, C-3).


