CT Images of the Scapula Taken with Reduced dose can Yield Segmented Models of Sufficient Accuracy - A Pilot Study
- 1. Organ Systems, The Katholieke Universiteit Leuven, Belgium
- 2. Department of Mechanical Engineering, Universitaire ziekenhuizen Leuven, Belgium
- 3. Department of Traumatology, Universitaire ziekenhuizen Leuven, Belgium
Abstract
Introduction: 3D imaging techniques are increasingly being used for pre-operative planning and the production of patient specific implants or guides. In orthopedics and traumatology these images are segmented out of CT scans as they provide the best quality bone images. However, these CT scans expose patients to high dosages of ionizing radiation which has a baleful influence on their health. In this pilot study we investigate the influence of tube current reduction on the segmentation accuracy of the scapula.
Materials and methods: A human cadaver was CT scanned multiple times while reducing tube current amperage. The images were segmented using 2 different segmentation methods (n=28). Subsequently the scapula was dissected and all soft tissues were removed. An optical laser scan of the dissected scapula was aligned and compared with the segmented meshes of the different CT scans. Radiation dosage, 3D distance, volume and other parameters were analyzed.
Results: All segmented meshes differed statistically significantly from the optical scan (p<0.001). Apart from one, all meshes had a larger volume than the reference mesh (n=27). The average 3D deviation varied between 1.17 mm (Max) -0.759mm (Min) and the total average 3D deviation was -0.45mm (+/- 0.38mm SD).
The mesh accuracy remained fairly constant with diminishing tube currents. Radiation dosages were reduced from 7.1 to 0.3 mSv. Only the automatically generated meshes, corresponding with the lowest tube currents, had large surface deviations. The semi-automatically generated meshes had deviation values within normal averages.
Conclusion: CT Tube current can be largely reduced without losing the surface segmentation accuracy of segmented scapula meshes.
Keywords
- Scapula
- Segmentation
- Low-dose CT
- 3D Radiation
Citation
Herteleer M, Vancleef S, Sloten JV, Nijs S (2017) CT Images of the Scapula Taken with Reduced dose can Yield Segmented Models of Sufficient Accuracy - a Pilot Study. JSM Anat Physiol 2(2): 1011.
INTRODUCTION
The use of CT scans has become a commonly used tool in the diagnostic and pre-operative assessment of orthopedic and trauma patients. These CT images are used more and more to make 3D reconstructions, aiding the physician in assessing the anatomy and pathology; and for the design of custom made orthopedic implants. Commercial software packages allow surgeons and engineers to segment these images and use the resulting 3D models to improve patient care and improve research quality [1-3]. However, there is a downside regarding the increased use of CT scans. The ionizing radiation dosage of 1 CT scan of de shoulder relates to more or less 25 chest x-rays of the thorax [4]. Orthopedic and trauma patients are often young and could therefore benefit more from a radiation reduction in their musculoskeletal diagnostic work up.
Studies have inspected the quality and accuracy of image segmentation modules for long bone structures. They demonstrate a high segmentation accuracy for musculoskeletal scans regarding the tibia and femur [5,6]. Kwon et al., demonstrated that the distances and angles measured on 3D reconstructed models of scapula images show high inter & intra observer variability rates [7].
To our knowledge there are no studies that have investigated the influence of CT dose reduction on the image quality and especially on how the dose reduction influences the segmentation quality of the scapula. The scapula is an interesting bone since its thin body might be more influenced by a dose reduction.
MATERIALS AND METHODS
After getting approval from the local ethical committee (Ethisch Committee, KU Leuven, Belgium) we obtained 1 fresh frozen cadaver from the human body donation program of the KU Leuven. A standardized Axial CT shoulder was obtained on a clinical CT scan, Siemens Somatom Force (Siemens AG, Erlangen, Germany), dual source/dual energy, 192-slice. The scan covered the entire glenohumeral joint and the scan length was determined by a radiological assistant as if it were a normal patient. While maintaining all CT scan settings the tube-current was reduced gradually until the lowest current at which the CT scan would function was obtained (Table 1). In total 7 CT scans were obtained from the same cadaveric specimen.
The right scapula was dissected, cleaned manually and then boiled to remove the remaining fat. It was then optically scanned with the Nikon LC60Dx (Nikon metrology, UK) mounted on a coordinate measuring machine (MC16, Coord3, S.p.A, Turin, Italy). The manufacturer reports a surface accuracy between 6 and 36 microns. The obtained point cloud was reconstructed into an STL file using Focus inspect (Nikon Metrology, UK) and then imported into 3-matic (3-matic Research 11.0, Materialise NV, Leuven, Belgium) where a mesh repair was performed. Mesh abnormalities were repaired using the different fix methods such as: remove overlapping triangles, invert normal and fill holes.
The obtained CT scans were imported into Mimics Research 19.0 (Materialise NV, Leuven, Belgium) and segmented by 2 researchers each using a different protocol. The 2 different segmentation protocols were applied to images in the bone and in the soft tissue window, resulting in 4 surface meshes per CT scan.
MH used an automated segmentation protocol where a standard bone mask threshold (226-3071) was applied to axial the CT images. Then, a region growing method was performed to isolate the scapula. The 3D models were calculated from the masks using the high quality segmentation settings. The resulting STL file was then imported in to 3-matic (3-matic Research 11.0, Materialise NV, Leuven, Belgium) and a wrap operation with a gap closing distance of 4mm, smallest detail of 0.1mm, protection of thin walls and a resulting offset of 0.07mm were performed. This was done to create a full and uniform shell. Where necessary, manual fixing methods were applied to create a single shell mesh.
SVC used a semi-automated segmentation method which can be found as the CT bone module. A point on the cortex of the scapula was selected on the CT scan and then automatically filled using the automated smart expand and bone filling module. The 3D models were calculated from the masks using the high quality segmentation settings and the resulting STL file was then imported in to 3-matic (3-matic Research 11.0, Materialise NV, Leuven, Belgium) without additional wrapping. No wrap operation was applied because the semi-automated segmentation method produces meshes without inner surfaces [6].
The meshes were aligned with the optically obtained scapula using a best fit method. A signed global part comparison analysis was used to determine the 3D distance between the reference mesh and the segmented mesh. The distance values were imported into GraphPad Prism (version 7.00 for Windows, GraphPad Software, La Jolla California USA).
Statistiscs
Data were analyzed using Graph pad PRISM. Descriptive statistics were calculated based on frequency tables and histograms were plotted as line graphs. The mean deviations were compared using the one-way ANOVA test. When the comparison was limited to 2 groups a t-test was used.
RESULTS AND DISCUSSION
Results
Mesh difference: All meshes were statistically significantly different from the optically scanned mesh (ground truth) using a one-way ANOVA test with multiple comparisons (p<0.0001). All segmented meshes, apart from MH 7B had larger volumes than the optically scanned reference meshes. This under sizing is due to a large structural volume loss as a consequence of the initial segmentation (Figure 1).
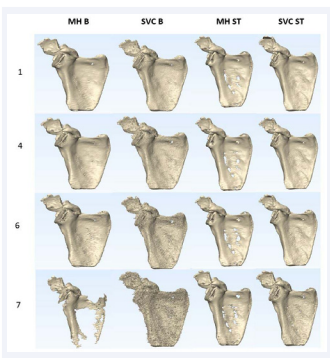
Figure 1: Illustration of some of the segmented CT scans. A visual analysis shows that there are no large deformations when the radiation dosage is reduced. SVC 1B provided the highest surface accuracy which is demonstrated in (Figure 2). The automated segmentation by MH 7B shows a clear volume loss in the body of the scapula. The visually perceived surface roughness of SVC 7B is remarkably larger than that of the other surface meshes..
Bone window vs soft tissue window: The 3D deviations of all meshes segmented from the CT Images in the soft tissue window were statistically significantly different from meshes segmented from the bone window (p<0.001). From a visual point of view there seemed to be an increased amount of noise on the surface meshes in regard to lower radiation dose. This noise was more prominent for the models segmented in the bone window compared with the soft tissue window (Figure 1).
Radiation Dosage and surface accuracy: The radiation dosage was computed by a medical physicist based on the scan parameters and the scanned volume (Table 1).
|
Table 1: CT scan settings. |
|||||||||
|
CT |
kV |
mAs |
ref |
CTDI |
DLP |
Scan length |
Pitch |
ST |
Pixel |
|
|
|
|
|
(mGy) |
(mGy.cm) |
(cm) |
|
(mm) |
(mm) |
|
1 |
110 |
408 |
516 |
21,37 |
379,1 |
18 |
0,8 |
0,6 |
0,85x0,85 |
|
2 |
110 |
266 |
326 |
13,92 |
246,9 |
18 |
0,8 |
0,6 |
0,85x0,85 |
|
3 |
110 |
196 |
246 |
10,26 |
182 |
18 |
0,8 |
0,6 |
0,85x0,85 |
|
4 |
110 |
136 |
167 |
7,12 |
126,4 |
18 |
0,8 |
0,6 |
0,85x0,85 |
|
5 |
110 |
75 |
87 |
3,92 |
69,6 |
18 |
0,8 |
0,6 |
0,85x0,85 |
|
6 |
110 |
43 |
46 |
2,29 |
40,6 |
18 |
0,8 |
0,6 |
0,85x0,85 |
|
7 |
110 |
18 |
18 |
1,02 |
19,4 |
18 |
1,05 |
0,6 |
0,85x0,85 |
Dosages were corrected for male and female cadavers due to the close proximity of the breast region. As expected the effective dose decreased linearly with decreasing tube currents. The mean deviation of our segmented models however did not decrease linearly but remained fairly constant apart from the segmentations lowest radiation dosages MH (Figure 2) (Table 2) [8].
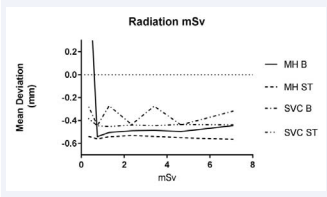
Figure 2: Influence of the radiation dosage on the mean deviation of the surface meshes. The mean deviation of the models segmented in the soft tissue window is larger than those segmented in the bone window. The mean deviation of the meshes segmented in the soft tissue window is less influenced by the lowest radiation dosage.
|
Table 2: Radiation dosages of the CT scans. |
||
|
CT |
Effective Dose Man |
Effective Dose Woman |
|
|
(mSv) |
(mSv) |
|
1 |
6,9 |
7,3 |
|
2 |
4,5 |
4,8 |
|
3 |
3,3 |
3,5 |
|
4 |
2,3 |
2,4 |
|
5 |
1,3 |
1,3 |
|
6 |
0,7 |
0,8 |
|
7 |
0,3 |
0,3 |
Mesh volume: All segmented meshes were significantly larger than the optically scanned reference mesh (p<0.0001). The mean volumes between the meshes by MH and SVC were not statistically significantly different (p=0.7594). The meshes based on the automatic segmentation protocol (MH) tended to have larger volumes than the meshes created by the semi-automatic CT-bone module (SVC) (Figure 3).
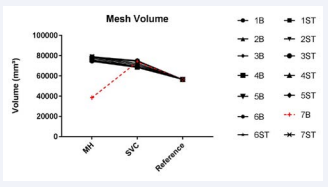
Figure 3: All meshes (apart MH 7B) have larger volumes than the optically laser scanned reference mesh. The fully automated segmented mesh from the lowest dosage bone window scan (7B) has a largely reduced volume. This can also be clearly seen in (Figure 1).
General comparison of the surface meshes: The mean 3D distance of the meshes created using the automated segmentation protocol (MH) vary between -0.44mm & 1.17mm for the bone window and -0.54mm & -0.57 mm for the soft tissue window (Table 3) (Figure 4).
|
Table 3: Deviation from the optical mesh (automatically segmented meshes). |
|||||
|
MH Bone Window |
|||||
|
CT |
Mean (mm) |
SD (mm) |
Max (mm) |
Min (mm) |
n |
|
1B |
-0,44 |
0,70 |
2,85 |
-2,45 |
28261 |
|
2B |
-0,50 |
0,71 |
3,16 |
-2,65 |
28261 |
|
3B |
-0,49 |
0,73 |
3,14 |
-2,62 |
28261 |
|
4B |
-0,49 |
0,73 |
3,01 |
-2,71 |
28261 |
|
5B |
-0,51 |
0,76 |
2,99 |
-2,68 |
28261 |
|
6B |
-0,54 |
0,76 |
3,08 |
-2,57 |
28261 |
|
7B |
1,17 |
2,90 |
19,18 |
-1,48 |
28261 |
|
MH Soft Tissue Window |
|||||
|
1ST |
-0,57 |
0,91 |
3,37 |
-3,32 |
28261 |
|
2ST |
-0,55 |
0,92 |
3,13 |
-3,18 |
28261 |
|
3ST |
-0,54 |
0,94 |
3,10 |
-3,20 |
28261 |
|
4ST |
-0,53 |
0,94 |
3,12 |
-3,22 |
28261 |
|
5ST |
-0,54 |
0,94 |
3,14 |
-3,23 |
28261 |
|
6ST |
-0,56 |
0,95 |
3,23 |
-3,50 |
28261 |
|
7ST |
-0,54 |
0,95 |
3,15 |
-3,39 |
28261 |
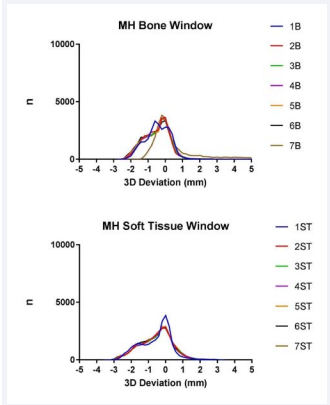
Figure 4: The graphs in figure 4 show the distribution of the deviation for the semi automatically generated meshes (MH). The distribution of the curves is similar although there clearly is a visual difference between MH 7B and the other meshes. This is due to the fact that the calculations are based on the amount of triangles of the meshes. The part of the body of the scapula which has disappeared (Figure 1) has only a small amount of triangles compared with more complex shapes such as the acromion. The extrema and the width of the graph give a good appreciation on the general quality of the mesh (Table 3).
The mean 3D distance of the meshes created using the semi automated segmentation protocol (SVC) vary between-0.44mm&-0.27mm for the bone window and -0.48 mm&-0.38 mm for the soft tissue window (Table 4) (Figure 5).
|
Table 4: Deviation from the optical mesh (semi-automatically segmented meshes). |
|||||
|
SVC Bone Window |
|||||
|
CT |
Mean (mm) |
SD (mm) |
Max (mm) |
Min (mm) |
n |
|
1B |
-0,32 |
0,41 |
3,05 |
-3,83 |
30790 |
|
2B |
-0,44 |
0,64 |
2,99 |
-3,95 |
30790 |
|
3B |
-0,27 |
0,53 |
3,60 |
-2,40 |
30790 |
|
4B |
-0,44 |
0,71 |
3,72 |
-3,20 |
30790 |
|
5B |
-0,27 |
0,54 |
3,36 |
-3,16 |
30790 |
|
6B |
-0,44 |
0,69 |
3,63 |
-3,19 |
30790 |
|
7B |
-0,26 |
0,53 |
3,34 |
-2,76 |
30790 |
|
Soft Tissue Window |
|||||
|
1ST |
-0,44 |
0,64 |
2,99 |
-3,95 |
30790 |
|
2ST |
-0,44 |
0,71 |
3,72 |
-3,20 |
30790 |
|
3ST |
-0,44 |
0,69 |
3,63 |
-3,19 |
30790 |
|
4ST |
-0,44 |
0,69 |
3,63 |
-2,79 |
30790 |
|
5ST |
-0,45 |
0,70 |
3,73 |
-3,36 |
30790 |
|
6ST |
-0,45 |
0,72 |
3,66 |
-3,23 |
30790 |
|
7ST |
-0,38 |
0,79 |
3,31 |
-2,51 |
30790 |
|
Abbreviations: SD: Standard Deviation; n: Amount of Triangles |
|||||
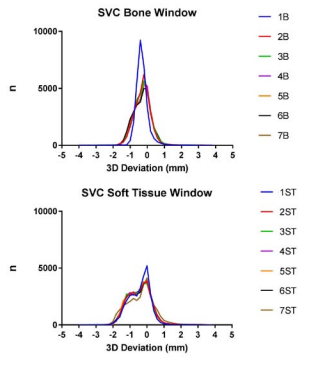
Figure 5: The graphs in figure 5 show the distribution of the deviation for the semi automatically generated meshes (SVC). The mesh generated from the images in the bone window with the highest radiation dosage (SVC 1B) have the narrowest graph. Although the mean deviation is closer to zero in other graphs the width of the graph gives a better approximation of the accuracy of the graph.
DISCUSSION
In this pilot study we investigated the influence of reducing the CT tube current and concomitant radiation dose on the quality of segmented meshes of the scapula. Our research suggests that tube current and therefore radiation dose could be largely reduced without reducing the accuracy meshes of the bone.
Our results confirm the results of previous studies which have proven that long bones can be accurately segmented using CT and MRI images. Although we included only one cadaver in our analysis, our results lie in the line of previous studies. They also confirm that CT segmented images overestimate bone geometry, but still provide sufficient geometrical information [5,6].
These studies reported on the segmentation accuracy of long bones such as the tibia and femur. This study however, is the first to our knowledge which reports on the segmentation accuracy of the scapula which is a bone with unique characteristics. Its body is very thin walled, the general shape is more complex and could therefore be more susceptible to segmentation errors.
The surface roughness of the segmented meshes is a parameter which is not commonly used to describe 3D models. The authors have the impression that the surface roughness of the meshes increased with the use of the semi-automated CT-Bone module (Mimics Research 19.0, Materialize NV, Leuven). Furthermore, to our knowledge, the surface roughness is a parameter which is difficult to be determined, using a generic method, to describe the general roughness of a virtual 3D surface (STL-file).
Furthermore, the used CT scanner and its concomitant software can largely influence the quality of the axial images and therefore the quality of the segmentation.
Future studies could focus on the difference between commercially and freely available software packages. The software package we used (Mimics Research 19.0, Materialize NV, Leuven, Belgium) was available in our institution but is not freely available to all researchers. The authors believe that freely available software packages might provide an accuracy which is good enough to allow surgeons to experiment with the 3D models of their patients before they perform surgery on the patient. Future research should focus on these differences as well.
Most importantly, future research should focus on reducing the radiation exposure while still providing accurate 3D reconstruction images. This would allow orthopedic and trauma surgeons to use CT imaging more frequently aiding in the design of personalized implants and guides without exposing the patient to unnecessary ionizing radiation.
CONCLUSION
This pilot study confirms the results that 3D reconstructed CT images provide accurate information of the bone surface. It suggests that this is not only accurate for long bones but also for bones with a more complex shape such as the scapula. The most important conclusion of this pilot study is that a linear reduction of ionizing radiation does not result in a linear decrease of mesh surface quality.
ACKNOWLEDGEMENTS
The authors wish to thank the Vesalius Instituut of the KU Leuven for their continuous work with the human body donation program. We also would like to thank Walter Coudyzer and Joke Binst of the UZ Leuven radiology department for technical support in data collection.
REFERENCES
- Upex P, Jouffroy P, Riouallon G. Application of 3D printing for treating fractures of both columns of the acetabulum: Benefit of pre- contouring plates on the mirrored healthy pelvis. Orthop Traumatol Surg Res. 2017.
- Hoekstra H, Rosseels W, Sermon A, Nijs S. Corrective limb osteotomy using patient specific 3D-printed guides: A technical note. Injury. 2016; 47: 2375-2380.
- Van Tongel A, Huysmans T, Amit B, Sijbers J, Vanglabbeek F, De Wilde L. Evaluation of prominence of straight plates and precontoured clavicle plates using automated plate-to-bone alignment. Acta Orthop Belg. 2014; 80: 301-308.
- Biswas D, Bible JE, Bohan M, Simpson AK, Whang PG, Grauer JN. Radiation exposure from musculoskeletal computerized tomographic scans. J Bone Joint Surg Am. 2009; 91: 1882-1889.
- Van den Broeck J, Vereecke E, Wirix-Speetjens R, Vander Sloten J. Segmentation accuracy of long bones. Med Eng Phys. 2014; 36: 949- 953.
- Gelaude F, Vander Sloten J, Lauwers B. Accuracy assessment of CT- based outer surface femur meshes. Comput Aided Surg. 2008; 13: 188-199.
- Kwon YW, Powell KA, Yum JK, Brems JJ, Iannotti JP. Use of three- dimensional computed tomography for the analysis of the glenoid anatomy. J Shoulder Elb Surg. 2005; 14: 85-90.
- McNitt-Gray MF. AAPM/RSNA Physics Tutorial for Residents: Topics in CT. Radiation dose in CT. Radiographics. 2002; 22: 1541-1553.


