Prolotherapy-Induced Cartilage Regeneration: Investigating Cellular-Level Mechanisms of Action with Mouse Preosteoblast Cells
- 1. Palos Verdes, USA
- 2. FABBX, USA
- 3. Healing Arts Research, USA
- 4. Independent Researcher, USA
- 5. Sage University Press, USA
Abstract
Prolotherapy is an injection of a non-biologic substance with localized effects for repairing connective tissue injuries of the musculoskeletal system. Recent studies in humans show that prolotherapy stimulates cartilage regeneration. However, the scientific community is still seeking to understand the mechanisms of action. To investigate at the cellular level, we utilized a treatment-control murine in vitro model (preosteoblast [MC3T3-E1] cells), microscopy, spectrophotometry, and fluorescent activated cell sorting (FACS). Relative to previous research, we used a more precise method to evaluate cell proliferation. Further, we employed a measurement schedule that enabled a more detailed examination of the decline and growth of treatment and control groups. Our more specific and focused results are consistent with, and help to confirm, previous research findings. We find that, in an initial phase, prolotherapy treatment induces death in a small percentage of cells followed by a significant (p<0.05) increase in cell proliferation compared to control. Additionally, we provide entirely new insights into the cell cycle dynamics of P2G-induced cell proliferation. Namely, our findings indicate that P2G treatment induces faster progression through the G1/S phase. In conclusion, our study provides a theoretical model and supportive evidence for the hypothesis that prolotherapy stimulates cartilage regeneration.
Keywords
Prolotherapy; Cartilage; Regenerative medicine; Chronic joint pain; Osteoblasts; Cytology.
CITATION
Johnston E, Andrali SS, Kochan A, Johnston M, Lovick J (2017) Prolotherapy-Induced Cartilage Regeneration: Investigating Cellular-Level Mechanisms of Action with Mouse Preosteoblast Cells. JSM Biochem Mol Biol 4(3): 1032.
ABBREVIATIONS
P2G: Phenol/Glucose[dextrose]/Glycerin; FACS: Fluorescence Activated Cell Sorting
INTRODUCTION
In the United States, 70 million people suffer chronic joint pain [1], one cause is a lack of articular cartilage [2]. Articular cartilage is an avascular tissue that facilitates efficient joint movement [3]. Chondrocytes are the cells unique to articular cartilage and compose less than 10% of tissue volume of articular cartilage [4]. Chondrocytes are surrounded by a complex of collagen, proteoglycans, and other extracellular proteins known as the extra-cellular matrix (ECM) [5,6]. Articular cartilage may degrade for a variety of reasons, including (1) aging, (2) inappropriate mechanical stress, (3) genetic predisposition, and (4) low-grade systemic inflammation associated with trauma, obesity, or disease [3]. Articular cartilage may not have an intrinsic repair capacity [4]. At best, articular cartilage heals partially and only under certain conditions [7].
There are few conventional treatments for chronic joint pain. In the last twenty years, clinicians have increasingly recommended surgery, non-steroidal anti-inflammatories, and opioid painkillers as the standard of care, because there is a lack of successful treatments [8]. Opioid painkillers lead to the death of 17,000 Americans per year [9]. Physicians may prescribe a variety of other modalities. For example, some prescribe aquatic exercise for which there is moderate quality evidence of small, short-term, and clinically relevant effects on patient-reported pain, disability, and quality of life [10]. Whether or not painkillers and the other aforementioned modalities prevent progression to a surgical option is unclear.
One promising procedure for reducing chronic joint pain on a long term basis is prolotherapy. Prolotherapy is a complementary and alternative therapy that involves injecting, into the painful joint, a small amount of a non-biologic solution that provokes a safe and short-lived inflammatory response [11]. Most commonly, physicians use either dextrose [11], or a phenol, glycerin, and dextrose combination [12]. Dextrose is an osmotic irritant while the combination of phenol, glycerin, and dextrose is an oxidative irritant [13], both act by killing a small number of cells in the area nearby the injection [13]. A meta-analysis of four randomized controlled trials that recruited a total of 258 participants concludes that (dextrose) prolotherapy confers a “positive and significant beneficial effect in the treatment of knee OA” [14]. This evidence is consistent with an A Level Strength of Recommendation [15]. However, the mechanism of action for both dextrose and phenol/glucose[dextrose]/glycerin (P2G) remain elusive.
Hauser [16], advocates that prolotherapy reduces chronic joint pain by stimulating the body to regrow cartilage in the pain-affected joint and then reviews an article that provides preliminary supportive evidence (a pre-post x-ray study with five patients [16]). [11] have also stated that prolotherapy activates the body’s healing mechanisms so that it regrows cartilage in the injection area. Along the same lines, another study provides some compelling clinical evidence that (dextrose) prolotherapy promotes cartilage regeneration via arthroscopic photography [17]. The [17], study lines up with intriguing insights from the Rabago [18], study documenting that prolotherapy reduces pain, especially among patients with less MRI-assessed cartilage loss. These studies raise intriguing questions about the role of local cell populations in regenerating cartilage, a topic typically studied with in vitro animal models. In the only published in vitro study on prolotherapy, Freeman et al., [12], reported that P2G prolotherapy induces an initial decrease in cell number followed by an increased rate of cellular proliferation.
To organize our understanding of processes by which prolotherapy stimulates cartilage regeneration that is specific to the local area of injection, we propose a novel theoretical model (Figure 1).
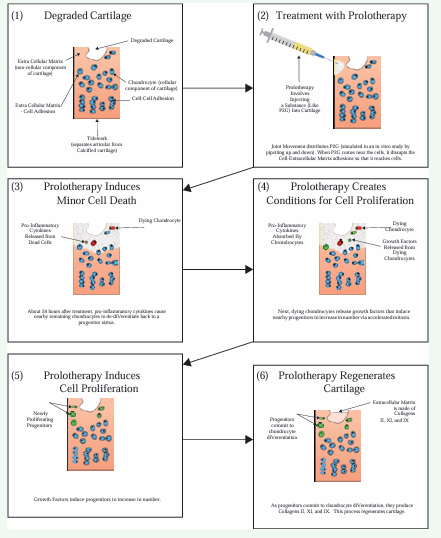
Figure 1: Theoretical Model of Prolotherapy-induced Cartilage Regeneration on a Local Level.
We begin with a person experiencing chronic joint pain, focusing on the joint with degraded cartilage (Box 1). A clinician administers a prolotherapy injection (Box 2). After approximately 20 hours, the proliferant kills a small number of chondrocytes [12], through an irritation mechanism [13]. The dying cells release pro inflammatory cytokines which induce nearby living chondrocytes to dedifferentiate back to a chondroprogenitor status [4,16,19] [Box 3]. This dedifferentiation of living chondrocytes is important because there are no chondroprogenitor cells in normal adult articular cartilage [4]. The dying chondrocytes also produce and release growth factors [Box 4]. Growth factors induce the dedifferentiated chondroprogenitor cells to proliferate [20] [Box 5]. These chondroprogenitor cells then differentiate into chondrocytes, which involves restoring extra-cellular matrix [3] [Box 6]. In summary, we understand prolotherapy to provoke a safe localized response that initiates cartilage regeneration.
Scientists repeatedly underscore that the mechanisms of action through which prolotherapy regenerates articular cartilage require further elucidation [11,12,14]. We draw upon published literature [12], to specify the P2G Proliferation Hypothesis: in an initial phase, treatment with P2G induces death in a small percentage of cells followed by increased proliferation of remaining cells. We seek to test this hypothesis with the additional goal of understanding the biological processes by which prolotherapy stimulates the body to regenerate cartilage.
MATERIALS AND METHODS
As a first step towards clarifying molecular mechanisms, we seek to confirm the published finding [12], that prolotherapy induces an initial decrease in cell number followed by cell proliferation. Given that scientists are often unable to reproduce published preclinical results [21,22], we follow the Freeman [12], methods as closely as possible, including using the same proliferant, type of tissue culture dish, and cell line.
Treatment
We used P2G (Wellness Pharmacy, Birmingham, Alabama) as a proliferant in our studies. P2G is composed of 2.5% Phenol, 25% Glycerin, and 25% Dextrose dissolved in sterile water. For all the P2G prolotherapy experiments, we treated the cells with a dose consisting of a 1.5% P2G concentration per well as an effective dose based on earlier studies for 24 hours [12]. In a 24 well plate, this is 15 microliters of P2G per well.
Cell line
We used MC3T3-E1, a murine osteoblast cell line representative of a pre-osteoblastic phenotype [23]. MC3T3-E1 cells create collagen similar to pre-osteoblasts [24]. An additional similarity to a pre-osteoblast phenotype is that MC3T3-E1 cells neither produce alkaline phosphatase nor mineralize the collagen they produce [25]. The MC3T3-E1 cell line is useful for modeling chondroprogenitor proliferation because pre-osteoblasts are phenotypically very similar to chondroprogenitors. However, the similarity is lost after 10 days in culture, when MC3T3-E1 cells begin expressing a fully differentiated osteoblastic phenotype [26]. ATCC reports that MC3T3-E1 cells have a doubling time of 38 hours. Dr. Baruch Frenkel and Dr. Benjamin Wu each kindly donated MC3T3-E1 cells (originally purchased from ATCC [Manassas, VA, Cat# CRL2594]).
Cell culture
We employed standard cell culture techniques. We cultured cells in Dulbecco’s Modified Eagle’s Medium with High Glucose, L. Glutamine, Sodium Pyruvate (DMEM, Genesee Scientific, San Diego, CA [Cat #: 25-500]) along with 10% Fetal Bovine Serum (FBS, Rocky Mountain Biologicals; Missoula, MT [Cat #: FBS-BBT, Lot #: 20150430FS]) and 1% Penicillin-Streptomycin (PS, Sigma Aldrich; Saint Louis, MO [Cat #: P4458-20ML]). We cultured cells and when they attained 70% confluency, we followed Freeman et al., [12], to plate in a tissue culture dish composed of twenty-four 1.9 cm2 wells. This is known as a 24 well plate. We incubated the cells at 37°C and 5% CO2 .
Reproducing published P2G prolotherapy research results
We used a hemocytometer to count and plate about 30,000 cells per well and let them grow for four days followed by treatment on the fifth day with 15 μL of P2G. We performed this experiment in triplicate. To measure cell viability, we used a Beckman spectrophotometer, with the CellTiter 96 AQueous One Solution Cell Proliferation Assay (MTS reagent, Promega [Madison, WI, Cat #: G3582, Lot # 0000178248 (1)]), and assessed absorbance levels based on the amount of formazan cells produced after consuming MTS.
Validating the MTS reagent
To validate the MTS agent was working properly in our laboratory, we used a hemocytometer to count and plate about 10,000, 30,000, and 50,000 cells. We performed this experiment in triplicate. After letting the cells settle for 24 hours, we added the MTS reagent and incubated for 2 hours. Then, we used spectrophotometry to assess cell viability.
P2G Prolotherapy cell death assay
We used a hemocytometer to count and plate about 140,000 cells per well, grew them for 24 hours, and then treated with either 0 (control), 15, or 75 μL of P2G for 24 hours. Then, we collected cell viability data immediately after treatment completion.
P2G Prolotherapy cell dynamics experiment
We began this four day experiment by using a hemocytometer to plate about 50,000 cells per well in a 24 well plate for control (15 μL water] and treatment effective dose (15 μL P2G). When seeding the cells, we pipetted three randomly selected seedings directly into a test tube for counting. Based on our preliminary experiments, we decided to apply treatment when the cell population reached 100,000 (50% confluency) because the cells would then be well adhered to the well plate, signaling well, and still have ample space for growth. At hour 46 (Measure 2), we determined that the cell population had already reached 100,000 and therefore we administered treatment and control for 24 hours. To simulate as closely as possible treatment dynamics in the control group, we followed the treatment protocol, with the single difference being that we treated with 15 μL of cell culture grade sterile water per well (control) instead of 15 μL of P2G (treatment). At hour 75, we changed media for all wells, both control and treatment (thereby removing control/treatment from the wells) [27-30]. To follow cell viability overtime, we conducted six measures: Measure 1 at plating, Measure 2 at 46 hours after plating, Measure 3 at 72 hours after plating, Measure 4 at 78 hours after plating, Measure 5 at 84 hours after plating, Measure 6 at 96 hours after plating.
To seed about 50,000 cells per well, we utilized a multi-step procedure to keep the number of cells as consistent as possible across the wells. Then, to randomly distribute remaining variations in per well cell counts at time of plating, we seeded cells into wells according to a random number sequence generated in Excel (RAND function). As a consequence, we expect any variation in per well cell counts at time of plating to be randomly distributed across wells.
Fluorescence Activated Cell Sorting (FACS)
We detached cells from the plates using trypsin-EDTA (Sigma-Aldrich; Saint Louis, MO [Cat #: T3924-100ML]) and washed in phosphate buffered saline (PBS, Thermo-Fisher [Life Technologies Corporation]; Carlsbad CA [Cat #: 10010031]). To distinguish live and dead cells, we stained with 5 μg/mL of Propidium Iodide (Thermo-Fisher; Carlsbad, CA [Cat #: P21493]) and incubated the cells in the dark at 22°C for 5 minutes. We used an Accuri CS Flow Cytometer to analyze the absolute number of cells. We also manually gated the cells to acquire the number of live and dead cells. To produce cell cycle information, we analyze the cells at Measures 2, 3, 4, 5, and 6.
Statistical analysis
To analyze absolute cell count results, we use a computer program named “R” to calculate independent samples Student’s t test with equal variance and produce associated plots. We specify the P2G Proliferation Hypothesis to indicate that during treatment, immediately after, and up to 10 hours afterwards, the P2G group would have fewer total cells than the control group. After 10 hours, we expect the P2G group to have more cells than the control group. To analyze percentage of dead cells, we use an independent samples Student’s t test for proportions. We expect that the P2G group will have more dead cells during and up to 10 hours after treatment (one tailed tests). As a decision rule, we use α ≤ 0.05 to indicate statistical significance and 0.05 < α ≤ 0.10 to indicate trending towards statistical significance.
RESULTS
Indirect measure (Spectrophotometry) does not reveal P2G prolotherapy effective dose impacts cell viability
Although we closely followed published experimental protocols [12], we found the mean absorbance with the CellTiter 96 AQueous One Solution Cell Proliferation Assay for treatment (1.060) and control to be about the same (0.984) [p=0.93]. This finding differs from published results indicating P2G treatment kills a small yet statistically significant number of cells [12]. To explore this discrepancy, we additionally conducted three experiments, none of which indicated a statistically significant difference between the mean amount of cells in control and treatment groups. In conducting these experiments, we engaged an independent cell culture expert to validate our study protocols and laboratory procedures against the published study. We also confirming the accurate functioning of our laboratory’s spectrophotometer with another lab’s spectrophotometer. Finally, we worked closely with a Promega scientist on protocol confirmation and conducting an experiment to validate the MTS reagent. Figure 2 indicates that we were able to use the MTS reagent to reliably distinguish between 10,000, 30,000, and 50,000 cells plated in a 24 well plate when incubated for 2 hours.
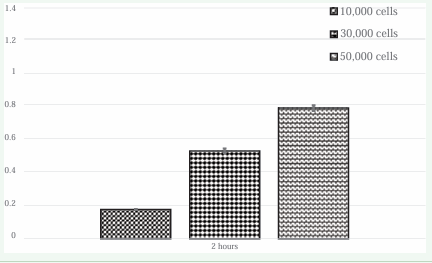
Figure 2: The MTS reagent reliably distinguishes between 10,000, 30,000, and 50,000 cells.
P2G prolotherapy may induce minor cell death
As a next step in seeking to produce published results, we specifically investigated whether P2G prolotherapy induces cell death. Figure 3 confirms that 75 μL of P2G is a lethal dose; visual inspection of Panel A indicates only a few cells remained in the plate. We suspect that the other cells died and then disintegrated.
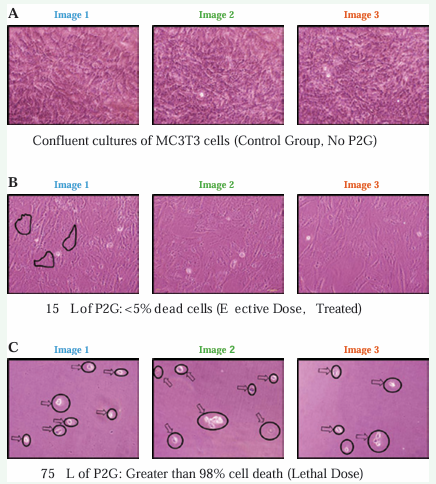
Figure 3: The Lethal Dose 75 μL P2G is a Lethal Dose and 15 μL P2G is an Effective Dose.
Visual inspection of Panel B suggests that 15 μL of P2G kills a minor amount of cells. Finally, visual inspection of Panel C verifies that the control is nearly confluent. Figure 4 presents FACS results indicating that after 48 hours, the control wells (0 μL P2G) had an average of 184,216 cells.
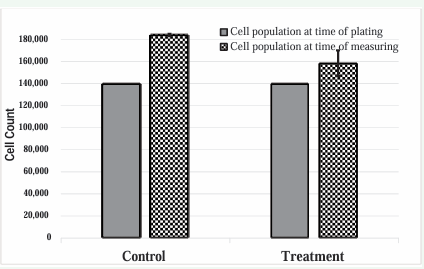
Figure 4: Direct Measure of Cell Viability (FACS) shows P2G Induces Minor Cell Death.
In contrast, the effective dose treatment (15 μL) wells had an average of 158,471 cells. The average amount of cells in the effective dose (treatment) group was trending towards a statistically significant difference from the average amount of cells in the control group, which provides some evidence supporting the idea that the P2G effective dose induces minor cell death.
P2G Prolotherapy induces minor cell death followed by proliferation
To more fully and precisely investigate the hypothesis, we utilized FACS to carry out a direct and specific measure of cell viability. Figure 5 shows that at Measure 1 (time of plating), we found the mean number of cells plated to be 54,427, with a standard deviation of 6,328 cells.
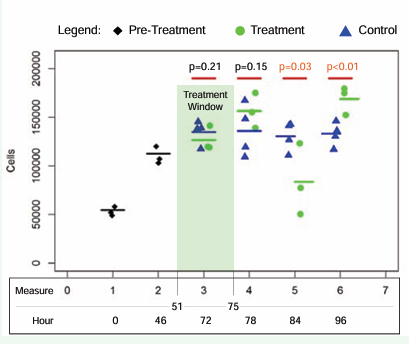
Figure 5: Prolotherapy Induces Minor Cell Death followed by Proliferation.
At Measure 2 (46 hours from plating), we found that the cell population had grown to an average of 112,379 per well and so administered the treatment/ control at fifty-one hours after plating. We exposed cells to treatment from hour fifty-one to hour seventy-five. During treatment, at Measure 3 (seventy-two hours after plating, hour 21 of treatment) we found a slight, insignificant (p=0.21) difference in the average number of total cells in control versus treatment: 134,847 (standard deviation 11,980) versus 126,627 (standard deviation 12,713). After treatment had completed, at Measure 4 (seventy-eight hours after plating), we also found a slight, insignificant (p=0.15) difference in the average number of total number of cells in control versus treatment: 135,751 (standard deviation = 26,925) versus 156,311 (standard deviation = 18,014). At Measure 5 (eighty-four hours after plating), we found that the average number of total cells in the control group was much greater than the average number of total cells in the treatment group (p=0.03): 130,401 (standard deviation = 14,875) versus 83,524 (standard deviation = 36,771). At Measure 6 (ninety-six hours after plating), we found that the average number of total cells in the control group was much less than the average number of total cells in the treatment group (p<0.01): 132,984 (standard deviation = 12,185) versus 168,742 (standard deviation = 14,501). In short, treated cells proliferated faster, which is consistent with the hypothesis that in an initial phase, treatment with P2G induces death in a small percentage of cells followed by increased proliferation of remaining cells.
Analyzing the data in terms of percentage of dead cells also provides results supporting the hypothesis (Figure 6).
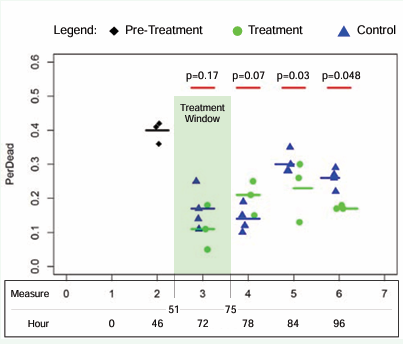
Figure 6: Prolotherapy Kills Minor Percentage of Cells, Then Spurs Growth of Live Cells.
At Measure 3, the average percentage of dead cells in control (17%) versus treatment (11%) was most likely due to chance variation (p=0.17). At Measure 4, the average percentage of dead cells in controls (14%) versus treatment (21%) was trending towards statistical significance (p=0.07). At Measure 5, analysis showed treatment to have a lower average percentage of dead cells (23%) compared to control (30%) and the difference is statistically significant (p=0.03). In Measure 6, we found that the percentage of dead cells in treatment (17%) was lower than control (26%) by a statistically significant amount (p<0.05). This “percentage of dead cells” analysis suggests that P2G kills a minor amount of cells and then afterwards spurs the growth of live cells.
P2G prolotherapy induces S Phase cell death
Figure 7 presents results suggesting that P2G treatment induces faster progression through the G1/S phase. In Panel B, the total amount of cells in Measure 2 was 112,379, with the majority either in mitosis or in cell cycle arrest (G0 ).
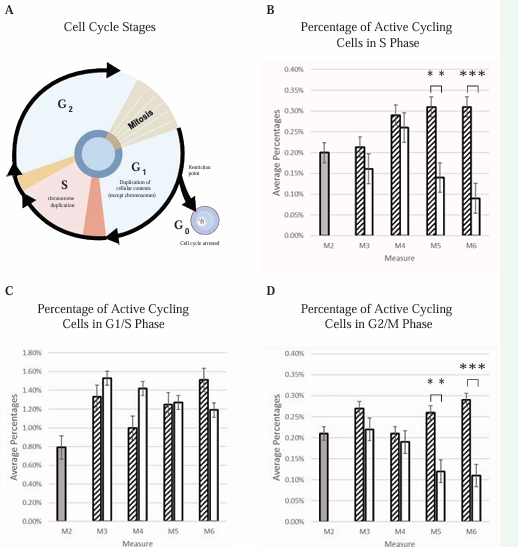
Figure 7: Prolotherapy Promotes S Phase and G2/M Phase Cell Cycle Progression.
From the total, 0.20% were in the S phase (Panel B), 0.79% were in the G1/S phase (Panel C) and 0.21% were in the G2/M phase (Panel D). At Measure 3 and 4, the difference between the control and treatment was not statistically significant for the total, live, G1/S phase, S phase, and G2/M phase cells. Immediately after treatment (Measure 5) and persisting 9 hours after treatment completion (Measure 6), the percentage of cells in both the S phase and the G2/M was less in treatment than control by a statistically significant amount. In sum, the panels show the percentage of cells in each of the cell cycle phases, broken down by measuring period, and arranged to highlight the important S Phase results.
Cell cycle results suggest that nine hours after treatment completion, P2G induces death among cells in the S phase. An explanation for this finding is that cells might be expending most of their energy on the DNA duplication during the S phase and for this reason are weak and susceptible. As these cells are undergoing cell death, they release growth factors to other cells that are in the G1/S phase, making them go through the cell cycle faster, which would lead to the increase of cells in Measure 6.
DISCUSSION
Our in vitro results support the hypothesis that treatment with P2G first kills a small percentage of cells and then induces proliferation. Further, our results are in agreement with previously published data [11]. The two extant studies on the reproducibility of in vitro research find that among those preclinical studies which scientists attempted to replicate, only 11% [22], or at most 28% [21], have their main conclusions supported. In the case of P2G prolotherapy, however, our results and the previously published data align in providing support for the P2G Proliferation Hypothesis.
Though our results are largely consistent with published findings [12], one difference has interesting clinical research implications. Published findings indicate that the treatment takes about 4 weeks to recover relative to control [12], whereas our results indicate that treatment stimulates the body to regenerate cartilage within days of administration. Rabago [11], state that prolotherapy treatment commonly involves several injections delivered every 2 to 6 weeks. Perhaps future research could aim to identify the relative advantages of varying treatment intervals.
CONCLUSION
The present study advances our understanding of a cellular mechanism of action by which P2G regenerates articular cartilage at the site of injection. We developed a novel theoretical model of the biological processes by which prolotherapy regenerates cartilage. Further, we generated new empirical data that confirms and extends published in vitro literature on cellular processes. Importantly, our research suggests that within days of treatment, prolotherapy initiates localized cellular processes that lead to regeneration of articular cartilage.
ACKNOWLEDGEMENTS
Authors thank Rajendra Kumar Gangalum, PhD, of UCLA; Erika M. von Euw, PhD, of UCLA; Alexandra Beckemeyer, BA, Thomas Wells, MPH, Rebecca Maxen, MS, Noe Marquez, BA, Paul Burns, MA, Yuda Zhu, PhD, Alex Kukreja, MS and Smita Gupta, MD for advice. Elisha Johnston also thanks the Los Angeles County Science & Engineering Fair, the California State Science Fair, the Youth Science Center, and the American Association of Clinical Chemistry for encouragement.


