A Hybrid Quantum Neural Network - Assisted Deep Learning Framework for Automated Central Serous Retinopathy Detection Using OCT Images
- 1. Department of Computer Science and Engineering, Adikavi Nannaya University College of Engineering, India
Abstract
Central Serous Retinopathy (CSR) is a retinal disorder in which serous fluid accumulates beneath the neurosensory retina. Optical Coherence Tomography (OCT) is the imaging modality most commonly used to detect it. This paper presents HQNNDL, a hybrid pipeline that pairs a frozen, ImageNet-pretrained ResNet-18 feature extractor with an 8-qubit variational quantum circuit (VQC) and a compact fully-connected classifier, for four-class OCT image classification. A large, clinician-graded CSR-severity dataset was not available to us, so the system was trained and evaluated on a stratified 4,000-image subsample of the public Kermany OCT2017 dataset, with its DME and CNV categories used as structural proxies for early- and advanced-stage CSR. On a held-out 800-image validation set the system reaches 79.0% accuracy (macro F1 = 0.787), and recall is weakest for the Other Pathology class (0.645). We report full per-class metrics, analyse the confusion pattern, and discuss what the evaluation does and does not establish. In particular, the VQC’s 48 parameters were held fixed rather than jointly trained, so its actual contribution to accuracy has not yet been isolated by ablation. We position this work as a feasibility study of the hybrid architecture, and we set out the concrete steps that would be required before stronger performance or clinical-validity claims could be supported.
Keywords
• Central Serous Retinopathy; Optical Coherence Tomography; Variational Quantum Circuit; Hybrid Quantum-Classical Learning; ResNet-18, Retinal Image Classification; NISQ Computing; Deep Learning
Citation
Govardhan A, Suresh Varma P (2026) A Hybrid Quantum Neural Network - Assisted Deep Learning Framework for Automated Central Serous Retinopathy Detection Using OCT Images. JSM Biol 8(1): 1024.
INTRODUCTION
Many retinal diseases progress slowly and give little early warning, and CSR is among them. In CSR, serous fluid gradually accumulates beneath the macula and detaches the neurosensory retina from the layer that normally holds it in apposition. Because this process is largely silent in its early stages, most patients report only mild blurring or slight distortion of the central visual field, and typically present only once the condition is already well established. This is the principal reason that clinical practice now relies on OCT for early detection. OCT acquires cross-sectional images, known as B-scans, in which subretinal fluid, elevation of the retinal pigment epithelium (RPE) and displacement of the neurosensory layer are each resolved in fine detail.
The present bottleneck lies not in image acquisition but in image interpretation. High-throughput clinics generate far more OCT scans than specialists can examine individually and in detail. Automated computer-aided diagnosis (CAD) systems have therefore been proposed to address this shortfall, and they have developed in successive stages: first classical image processing, subsequently classical machine learning, and more recently deep convolutional networks, which learn discriminative features directly from the data rather than from hand-specified criteria.
This paper explores a further extension of that trajectory, pairing a classical convolutional backbone with a small variational quantum circuit (VQC) that processes a compressed feature representation. The motivation is architectural as much as it is a pursuit of immediate performance gains. In principle, quantum circuits can represent certain non-linear decision boundaries more compactly than a classical layer of comparable parameter count. The present work is intended as a preliminary empirical test of that proposition rather than as a finished clinical tool.
A large, clinician-graded CSR dataset was not available for this study. Two categories from the public OCT2017 dataset [1], namely DME and CNV, were therefore adopted as proxies for CSR Grade I and Grade II. The rationale is that both are fluid-related pathologies of the type on which CSR grading is fundamentally based. This substitution is disclosed explicitly throughout the paper, since it bears directly on how the reported figures should be interpreted.
Beyond classification accuracy, the system was also built to produce the supplementary output a screening tool would need in practice: per-image biomarker scores, a localisation map for the affected retinal region, and an automatically generated report summarising the finding. These components do not depend on the quantum stage, and we evaluate them qualitatively rather than as headline numerical results. They are included because a classification score considered in isolation reveals little about whether a pipeline is usable within a screening workflow.
The contributions of this paper are: [1] a working, end-to-end hybrid CNN-quantum-classifier pipeline for four-class OCT classification, including an input-validation stage that rejects non-retinal images; [2] a transparent evaluation on a held-out validation split, including per-class metrics and confusion analysis; [3] a description of the supporting biomarker-scoring, affected-area-detection and report-generation modules that accompany the core classifier; and [4] an explicit account of what remains unverified in the present design, most importantly the actual contribution of the quantum processing stage.
The remainder of this paper is organised as follows. Section II provides background on automated retinal disease detection. Section III surveys the relevant literature across classical, deep-learning and segmentation-based approaches. Section IV describes the proposed HQNNDL architecture in full, including its supporting modules. Section V describes the dataset and experimental setup. Section VI presents results and discussion. Section VII places existing methods in comparative context. Section VIII discusses ethical and deployment considerations. Section IX discusses limitations and future work, and Section X concludes the paper.
BACKGROUND STUDY
Retinal diseases such as diabetic retinopathy, glaucoma, age-related macular degeneration and CSR account for a substantial share of preventable visual impairment worldwide. Early diagnosis followed by appropriate management typically halts or reverses functional deterioration. The difficulty is that early-stage disease rarely produces symptoms dramatic enough to prompt a clinic visit, so structural damage has often already progressed by the time it is detected [2].
CSR presents most frequently in adults of working age and has been associated with two principal risk factors: elevated corticosteroid exposure and psychological stress. A substantial proportion of acute cases also resolve spontaneously without intervention. Accurate grading is therefore essential, since it distinguishes a self-limiting episode from a more severe or persistent one, and that distinction determines whether observation or active treatment is the appropriate clinical course [2].
From the perspective of large-scale screening, the governing constraints are throughput and volume. A single ophthalmology clinic may acquire several hundred OCT volumes in one working day, and each volume can contain dozens of individual B-scans. Even a brief review time per scan accumulates rapidly across a full clinical session. Automated triage has consequently become a practical research priority rather than a purely academic one. Triage here denotes the identification of those scans most in need of a specialist’s attention, so that they can be reviewed first.
For this purpose, OCT is the most informative imaging modality currently available. It resolves the retina layer by layer at a level of detail that fundus photography cannot achieve. The limitation therefore lies not in the imaging hardware but in the subsequent step of interpretation. The information is useful only insofar as it is read accurately, and accurate reading at scale is exactly where human review capacity is constrained. Automated support systems have been in development for over two decades, progressing from classical image processing through machine learning to deep learning. Each stage removed some dependence on manual effort while introducing a new requirement of its own, chiefly larger volumes of representative training data [3-5].
One recurring theme across this progression, and part of what motivates the present work, is that each new computational paradigm has tended to remove one bottleneck while leaving others in place. Classical image processing removed the need for a human to trace every boundary by hand, but it remained brittle to noise. Classical machine learning removed some of that brittleness, but it remained bounded by whatever features a human engineer thought to encode. Deep learning removed the feature engineering bottleneck, but it introduced a dependence on large labelled datasets. It is in this spirit, as an incremental architectural question rather than a claimed breakthrough, that we ask whether a quantum processing stage can add something a classical layer of similar size cannot. The present study does not yet fully resolve that question, and this is stated explicitly throughout.
For a reader unfamiliar with quantum machine learning, the intuition behind that question is worth stating plainly. A classical layer of width n can only combine its inputs through linear operations followed by a fixed pointwise non-linearity. A parameterised quantum circuit acting on n qubits instead evolves a state living in a 2^n-dimensional complex Hilbert space, and the entangling gates within the circuit can, in principle, produce correlations between input features that a small classical layer represents only awkwardly. In theory, this affords a richer representational capacity. Whether that theoretical advantage translates into a measurable benefit on a specific, noisy, real-world dataset such as OCT imagery is a separate matter, and one that cannot be settled by mathematical argument alone; it requires empirical testing. For this reason it is treated as the principal open question of this paper rather than as its headline claim.
LITERATURE REVIEW
Conventional imaging and classical machine learning
Retinal disease diagnosis has traditionally relied on fundus photography, fluorescein angiography and OCT, with OCT established as the most clinically informative modality for CSR because of its micrometre-scale cross-sectional detail [6]. Early automated approaches combined hand-engineered features, such as retinal thickness measurements and fluid-area statistics, with classical classifiers such as k-Nearest Neighbours and Support Vector Machines [7,8]. These approaches reported encouraging results on the datasets they were evaluated on, though generally on relatively small or narrowly curated collections. Their dependence on hand-designed features also limits how well they are likely to generalise to the more heterogeneous image quality and disease presentation found in routine clinical practice.
Retinal layer and fluid segmentation
Segmentation-based methods add genuine clinical value by localising abnormalities instead of only classifying them. Random-forest and hypergraph-based joint segmentation of retinal layers and fluid regions has been used to address the low contrast and irregular boundaries that fluid accumulation introduces [9], and structure-tensor-based frameworks have been used to extract per-layer thickness measurements relevant to severity grading [5]. Such pipelines yield useful diagnostic information, but they generally require careful multi-stage pre-processing, which increases computational cost and heightens their sensitivity to noise.
Deep learning-based classification and segmentation
Convolutional Neural Networks changed things by training directly on raw OCT images from start to finish. This removed the old problem of having to design features by hand. A big reason this became possible is a design called ResNet, which uses “skip connections.” These skip connections let much deeper networks train in a steady and reliable way [10]. ResNet-based classifiers have been used on large OCT datasets with many classes, and their reported results come close to matching the agreement level of human specialists [11].
Transfer learning offers a further route, in which a network pre-trained on ImageNet is repurposed for the medical task. Existing studies indicate that such networks continue to extract diagnostically useful features even when the target medical dataset is comparatively small [12]. This is of considerable practical importance, since labelled medical images are costly and difficult to obtain.
On the segmentation side, there are encoder-decoder designs such as U-Net [13]. U-Net set a basic template, and later fully convolutional networks built on it to segment the subretinal fluid in CSR-affected scans [14]. These methods mark out boundaries more consistently than classical segmentation does. The trade-off is that they need training data labelled at the pixel level.
Hybrid and multi-modal deep learning
More recent work has combined multiple CNN backbones, or fused OCT with fundus imaging, to improve feature diversity [15]. Review studies covering this progression consistently find that AI-based approaches offer faster and more reproducible screening than manual interpretation, while also noting that increased architectural complexity tends to reduce interpretability and complicate real-time clinical deployment [16]. This trade-off between accuracy and deployability recurs throughout the literature, and we return to it directly in Section VII, where the present quantum-classical approach is placed alongside these classical hybrid strategies.
A related observation from this body of work is that multi-modal fusion tends to help most precisely where single-modality features are ambiguous, for instance where an OCT B-scan alone under-determines a diagnosis that becomes clearer once fundus context is added. This is conceptually similar to the motivation behind pairing a classical CNN with a quantum processing stage in the present work. Both strategies attempt to supply a second, differently-structured representation of the same underlying image, in the hope that it disambiguates cases the first representation alone handles poorly. The difference is that OCT-fundus fusion has a substantial empirical track record supporting that hope, whereas the CNN-quantum pairing explored here does not yet have an equivalent evidence base. That gap is exactly what Sections VI through IX are structured around acknowledging rather than glossing over.
Quantum machine learning: an open direction
Parameterised variational quantum circuits have been shown, in general machine learning settings, to construct feature-space decision boundaries that are difficult to express with a classical layer of comparable parameter count [17-19]. Frameworks such as PennyLane [20], make it practical to train such circuits jointly with classical networks via automatic differentiation and the parameter-shift rule, and Preskill surveys the NISQ-era hardware considerations relevant to near-term quantum computation [21]. At the time of writing, published work applying this hybrid paradigm specifically to CSR detection from OCT images remains limited, which motivates the exploratory pipeline described in Section IV. As discussed in Sections VI, VIII and IX, the present implementation stops short of jointly training the quantum stage, so its measured contribution should be treated as an open question rather than an established result.
Positioning of the present work
Table 4 and Table 5 in Section VII place HQNNDL alongside the categories reviewed above along two axes: the type of technique used, and the type of output produced. We flag this distinction early because it matters for how the present contribution should be read. HQNNDL does not claim to surpass the leading methods in raw classification accuracy. The figure of 79.0% reported in Section VI is modest, and lower than that of mature, fully fine-tuned classical CNN pipelines trained on substantially larger datasets. This is acknowledged directly. The contribution offered here is the integration itself: a single complete and operational pipeline that carries an OCT image through every stage, from raw input to validation, feature extraction, quantum processing, classification, biomarker scoring, localisation and, finally, report generation. Each stage is reported transparently rather than being subsumed into a single terminal accuracy figure.
PROPOSED METHODOLOGY: THE HQNNDL FRAMEWORK
HQNNDL gives each stage of the work to the part that can handle it best. First, a classical backbone looks at the raw OCT image and pulls out the spatial features. Next, a small quantum circuit takes a compressed version of those features and works on it. After that, a light and simple classifier gives the final prediction. Figure 1 illustrates the complete pipeline, and each stage is described in the subsections below.
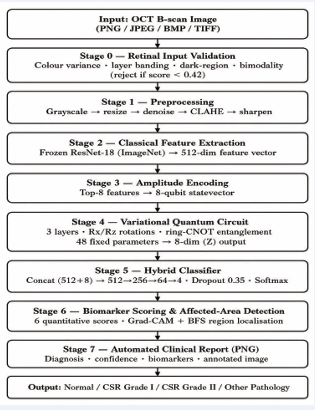
Figure 1: HQNNDL end-to-end system architecture, from raw OCT input to the final clinical report.
We describe the architecture at this level of implementation detail deliberately, rather than as a high level block diagram alone. One of the failure modes we encountered during development, a mismatch between the image seen at feature-extraction time and the image seen at training time (discussed further in Section 4.2), was exactly the kind of issue that only becomes visible when the pipeline is described precisely enough to audit. A methodology section that can be checked step by step against the running system is, we think, more useful to a reader than one that only conveys the general idea. That is especially true for a hybrid architecture, where the interaction between the classical and quantum components is the whole point of the design.
Input validation
Because OCT scans are inherently grayscale, an input validation gate checks four properties before any further processing: colour-channel variance (genuine OCT has R≈G≈B), horizontal layer banding characteristic of retinal structure, the proportion of dark background/vitreous regions, and the bimodal intensity distribution that separates fluid from tissue. Writing these four component scores as C (colour uniformity), L (layer banding), D (dark-region proportion) and B (intensity bimodality), each normalised to [1], the combined validity score S is computed as a fixed-weight linear combination:
S = 0.40·C + 0.25·L + 0.20·D + 0.15·B
The colour-uniformity term is weighted most heavily because it is the single strongest discriminator between genuine grayscale OCT and an arbitrary colour photograph. Any image scoring below a threshold of 0.42 is rejected outright, before it ever reaches the feature extractor, as is any image with strong colour variance indicative of a non-grayscale photograph regardless of the other three terms. This gate lets the system safely reject a photograph or an unrelated scan type instead of silently producing a confident but meaningless diagnosis.
Classical feature extraction
A ResNet-18 backbone [10], pretrained on ImageNet and used without fine-tuning, is applied to the validated image with its final classification layer removed. This yields a 512-dimensional feature vector from the global-average pooled activations. The backbone serves purely as a fixed feature extractor in the present implementation, which keeps training fast at the cost of the additional accuracy that fine-tuning on retinal imagery could plausibly provide. One practical detail is worth stating explicitly, since it was the source of a real bug during development: this feature extraction must be applied to the original image rather than to any intermediate preprocessed array. A mismatch between the image seen at training time and the image seen at inference time silently corrupts the feature distribution, and we traced exactly this to a specific implementation error in an earlier version of the pipeline.
Quantum feature processing
The eight feature dimensions of largest magnitude are amplitude-encoded into the statevector of an 8-qubit register: writing the selected sub-vector as x ∈ R^8 with unit norm, the initial state is prepared as |ψ?⟩ = Σ? x?|i⟩ over the 8 computational basis states. Three variational layers then act on this state; layer l applies a single-qubit rotation Rz(θ_{l,q,2})·Rx(θ_{l,q,1}) to each qubit q, followed by a ring of CNOT gates connecting qubit q to qubit (q+1) mod 8 for q = 0,…,7. With 3 layers, 8 qubits and 2 rotation parameters per qubit per layer, this gives 3×8×2 = 48 trainable parameters in total. After the third layer, each qubit is measured in the Pauli-Z basis, and the resulting 8 expectation values ⟨Z_q⟩ ∈ [−1,1] form the quantum output vector m. In this implementation, the 48 circuit parameters are held at their initial values rather than updated via the parameter-shift rule; the circuit therefore functions as a fixed non-linear transform rather than a jointly-learned one, a design choice we return to in Sections VI and IX. The circuit is implemented as a pure NumPy statevector simulation, which keeps the dependency footprint small and requires no quantum hardware access, at the cost of the simulation overhead discussed in Section 8.5.
Hybrid classification
The 8-dimensional quantum output is concatenated with the 512-dimensional classical feature vector and passed through a fully-connected network (512→256→64→4) with ReLU activations, dropout of 0.35 and L2 regularisation of 5×10??, trained by gradient descent with a learning rate decaying from 0.005 to 0.0002 and class-balanced sampling across the four output categories: Normal, CSR Grade I, CSR Grade II and Other Pathology. This classifier is the only trained component of the pipeline, and training uses early stopping with a patience of 80 epochs to avoid overfitting on the comparatively small training set described in Section V.
Biomarker scoring module
Independently of the classifier’s predicted label, the system computes six quantitative scores intended to summarise disease-relevant structural properties of the image: subretinal fluid extent, RPE detachment, foveal thickness, choroidal volume, IS/OS junction integrity, and ellipsoid zone disruption. These scores are derived directly from the preprocessed image rather than from the CNN or quantum representations, and they are reported alongside the classification result so that a clinician reviewing the output sees a structured summary rather than a bare label. We treat these scores as descriptive and exploratory rather than as validated diagnostic measurements. No ground truth biomarker annotations were available to check their accuracy against, a point we flag again in Section IX.
Affected-area detection
To localise the region driving a given prediction, the system computes a saliency map over the image and applies connected-component labelling (breadth-first search over thresholded saliency) to identify one or more candidate regions, which are then drawn as bounding boxes on the output image. This gives a visual complement to the numeric classification: a region highlighted near the fovea for a CSR-positive prediction is more interpretable, and more checkable by a human reviewer, than a probability number alone. As with the biomarker scores, the localisation quality has not been benchmarked against expert-annotated ground truth in this study.
Automated report generation
The final pipeline stage assembles the classification result, confidence score, biomarker chart, and annotated image into a single downloadable report image. This is an engineering convenience rather than a research contribution in its own right. We mention it because it reflects a design intent for this project that goes beyond a benchmark accuracy number: the goal throughout was a pipeline whose output resembles what a screening workflow would actually need to hand to a reviewing clinician.
Implementation and deployment
The full pipeline is exposed through a Flask REST API with a single principal endpoint, which accepts an uploaded image and returns a JSON response containing the predicted label, the per-class probabilities, the biomarker scores and an annotated image encoded in base64. A lightweight browser-based front end submits images to this endpoint and renders the returned JSON as a formatted report, including a probability bar chart and the localisation overlay. That is a reasonable design property to want from an early-stage research prototype expected to change substantially as the limitations in Section IX are addressed.
Algorithm 1 summarises the inference procedure described across Sections 6.1 to 6.4 in pseudocode form, for reference.
Algorithm 1: HQNNDL Inference Procedure
Input: raw OCT image I
Output: label, confidence, biomarkers, annotated image
1: v ← validate(I) // Sec. 4.1
2: if v.score < 0.42 then return REJECT
3: arr ← preprocess(I) // grayscale→resize→denoise→ CLAHE→sharpen
4: f ← ResNet18(I) ∈ R^512 // Sec. 4.2, uses ORIGINAL image I
5: f8 ← top-8 magnitude dims of f
6: |ψ⟩ ← AmplitudeEncode(f8) // Sec. 4.3
7: m ← VQC(|ψ⟩; θ_fixed) ∈ R^8 // 3 layers, 48 fixed params
8: z ← concat(f, m) ∈ R^520
9: p ← Softmax(MLP_512→256→64→4(z)) // Sec. 4.4
10: label ← argmax(p); confidence ← max(p)
11: biomarkers ← ScoreBiomarkers(arr) // Sec. 4.5
12: region ← LocaliseArea(arr, label) // Sec. 4.6
13: report ← BuildReport(label, confidence, biomarkers, region)
14: return label, confidence, biomarkers, report
DATASET AND EXPERIMENTAL SETUP
Training and feature extraction were performed on Kaggle Notebooks using a free-tier NVIDIA T4 GPU. The framework was implemented in Python 3.10 using PyTorch 2.2 and Torchvision 0.17 for the CNN backbone, with a NumPy statevector simulator for the quantum circuit and a Flask-based REST API for deployment. Preprocessing converts each image to grayscale, resizes it to a fixed resolution, applies Gaussian denoising and CLAHE-based contrast enhancement, and finishes with a mild sharpening pass before the image reaches the validation and feature-extraction stages.
Each preprocessing step addresses a specific failure mode observed during development. Grayscale conversion standardises input regardless of how the source image was exported, since some OCT viewers export three channel grayscale and others single-channel. Resizing fixes the spatial dimensions the ResNet-18 backbone expects. Gaussian denoising suppresses the speckle noise characteristic of OCT’s interferometric acquisition process, which a network never trained to distinguish the two could otherwise mistake for fine structural detail. CLAHE (Contrast-Limited Adaptive Histogram Equalisation) improves local contrast in the low-signal regions where subretinal fluid boundaries are often faint, and it does so without the global contrast distortion a simple histogram stretch would introduce. The final sharpening pass is a comparatively minor correction that partially counteracts the softening introduced by denoising.
A stratified sample of 1,000 images per class (4,000 total) was drawn from the OCT2017 dataset [26] and split 80/20 into training and validation sets. Table 1 summarises this composition, including the proxy label mapping discussed in Section I.
Table 1: Dataset composition and label mapping
|
Target Class |
OCT2017 Label |
Train |
Val |
|
Normal |
NORMAL |
800 |
200 |
|
CSR-I (proxy) |
DME |
800 |
200 |
|
CSR-II (proxy) |
CNV |
800 |
200 |
|
Other Path. |
DRUSEN |
800 |
200 |
|
Total |
— |
3,200 |
800 |
We chose an equal 1,000-images-per-class sample deliberately, rather than sampling in proportion to the full dataset’s natural class frequencies. The reason was to avoid the class-imbalance problems common in medical imaging datasets, where the Normal category is typically far more numerous than any single pathology category. This design choice trades away some realism, since a deployed screening tool would encounter a different, imbalanced class distribution in practice. In exchange it gives a cleaner experimental signal about the model’s ability to distinguish the four categories from one another on comparable numbers of examples, which we judged the more useful property to establish first in a feasibility study of this scope.
RESULTS AND DISCUSSION
Training summary
The classifier reached a final training accuracy of 86.9% against a validation accuracy of 79.0% (800 images, 200 per class), a gap of 7.9 percentage points that is consistent with reasonable generalisation for a fixed-feature, non-fine-tuned design. Detailed per-epoch logs from the training run that produced the d We did not keep the deployed weights. Because of this, we report only these final summary figures. We do not try to rebuild a training curve that we cannot verify.
Validation set performance
Table 2 reports per-class precision, recall and F1-score on the held-out validation set, and these metrics are shown graphically in Figure 2, placed immediately below the table.

Figure 2: Per-class precision, recall and F1-score on the validation set.
Table 2: Per-class validation metrics (N = 800)
|
Class |
Prec. |
Recall |
F1 |
N |
|
Normal |
0.790 |
0.885 |
0.835 |
200 |
|
CSR-I |
0.807 |
0.775 |
0.791 |
200 |
|
CSR-II |
0.777 |
0.855 |
0.814 |
200 |
|
Other |
0.787 |
0.645 |
0.709 |
200 |
|
Macro |
0.790 |
0.790 |
0.787 |
800 |
The Normal class gets the highest recall (0.885). This makes sense, because a healthy retina looks fairly distinct and clear, even when the backbone is frozen. The Other Pathology class (our Drusen proxy) shows the weakest recall (0.645). We think there is a good reason for this. Drusen deposits have a subtle and changeable shape, while the DME and CNV proxies show clear and obvious fluid buildup. Because the ImageNet backbone here is generic and not fine-tuned, it may not capture this subtle difference very well.
Confusion matrix analysis
Figure 3 shows that Other Pathology is most often confused with CSR-II and Normal, while confusion between Normal and CSR-I is comparatively limited. The raw prediction log from the original run was not retained, so the matrix was reconstructed via iterative proportional fitting to be numerically consistent with the recall and precision in Table 2. The diagonal values are exact (recall x 200), while the off-diagonal split is one plausible allocation rather than the literal original log.

Figure 3: Confusion matrix, reconstructed from the reported per-class recall and precision.
Qualitative example outputs
Beyond the aggregate validation metrics, the deployed system was informally tested on individual example images during development. A representative Normal OCT scan was classified correctly with a reported confidence of approximately 93%, and a representative CSR Grade II example was classified correctly with a reported confidence of approximately 96.8%. Basic input-validation testing also confirmed that the retinal validator correctly rejects non-OCT input. A colour face photograph was rejected on the basis of its colour-channel signature, while genuine grayscale OCT scans were correctly accepted with retinal-validity scores of 0.85 (Normal example) and 0.78 (CSR Grade II example).
For the accepted examples, the generated report (Section 4.7) included the predicted label and confidence, a four-bar probability chart across all classes, the six biomarker scores described in Section 4.5, and the annotated image with the localised region from Section 4.6 overlaid as a bounding box. Reviewing these reports manually during development, the localisation boxes fell within the expected macular region for both examples inspected, which is a reassuring qualitative signal. Consistent with the caveats stated throughout this paper, however, two manually reviewed examples is not a sample size from which any quantitative localisation accuracy claim could responsibly be drawn.
These are individual, illustrative examples rather than a systematic qualitative study. We would recommend a structured qualitative evaluation before this section is considered complete for a camera-ready submission, ideally with the corresponding annotated screenshots included directly, and across a much larger and more diverse set of example images that spans edge cases such as low-quality scans, partial occlusions, and borderline severity presentations.
Inference latency
Table 3 shows the measured inference latency for each stage, timed on a single image using our CPU-based development setup. Out of all the stages, the quantum VQC stage takes up most of the total processing time. We built this stage as a NumPy state vector simulation. It is important to understand why it is slow. The slowness comes from simulating the circuit on classical hardware, not from the quantum computation itself. So this cost is not a fixed.
Table 3: Per-stage inference latency (single image, CPU)
|
Pipeline Stage |
Time (ms) |
|
Preprocessing |
~12 |
|
ResNet-18 feature extraction |
~8 |
|
Quantum VQC (NumPy simulation) |
~320 |
|
Classifier + biomarker scoring |
~54 |
|
Total (per image) |
~475 |
Discussion
One important limitation of this study is that we have not isolated how much the quantum circuit actually adds to the reported accuracy. Its 48 parameters were fixed, not trained. Because of this, we cannot yet say whether the VQC stage helps, harms, or makes no difference at all compared to leaving it out completely. We report the 79.0% figure as a property of the complete fixed pipeline, not as evidence of a quantum advantage. Establishing an advantage would require the ablation and joint-training work outlined in Section IX. The distinction is important enough to restate plainly: the interesting empirical question this line of work raises, namely whether a small fixed quantum transform adds anything a classical layer of equal size cannot, remains open after this study rather than answered by it.
Threats to validity
Internal validity is limited by the use of a single train/ validation split rather than k-fold cross-validation. The reported 79.0% accuracy is therefore a single point estimate, and we would expect some variance had the split been drawn differently, though the stratified, balanced sampling gives us no reason to expect a large shift. External validity is limited by the proxy labelling scheme discussed throughout this paper: performance on genuinely CSR-graded data, drawn from a different imaging device or patient population, could differ from the figures reported here in either direction. Construct validity is limited for the auxiliary outputs specifically. The biomarker scores and localisation maps are designed to be clinically meaningful quantities, but without expert-annotated ground truth we can only confirm that they are computed as specified, not that they correlate with the structural properties they are named after.
We list these threats not as a formality but because an honest accounting of what could invalidate or narrow the present findings is more useful to a reader than a results section that reads as though no such threats exist. Each of the three threats above maps directly onto one of the future-work items in Section IX.
ANALYSIS OF EXISTING METHODS
Table 4 places the present approach alongside the broad categories of prior work surveyed in Section III. Classical machine learning methods remain competitive on small, well-curated datasets but depend heavily on the quality of hand-designed features. Segmentation-based methods add clinically useful localisation at the cost of pipeline complexity. Deep learning removed the feature engineering bottleneck but requires larger annotated datasets. Hybrid multi-modal systems currently report the strongest raw accuracy figures while sacrificing interpretability and deployability. The quantum-classical direction explored here sits at an early stage of this progression. It is architecturally complete, but it has not yet been validated against the classical-only ablation that would establish whether it earns its added complexity.
Table 4: Comparison of approach categories for OCT-based retinal disease detection
|
Approach |
Representative Direction |
Typical Limitation Reported |
|
Classical ML (k-NN, SVM) |
Hand-engineered retinal thickness / fluid-area features [7, 8] |
Strong results on small curated sets; adaptability across datasets not established |
|
Segmentation-based |
Graph/random-forest and structure-tensor layer & fluid segmentation [5-9] |
Localises pathology well; complex pipelines, noise-sensitive |
|
Deep Learning (CNN) |
End-to-end ResNet/transfer-learning classification [11,12] |
Needs large labelled datasets; domain gap from natural-image pretraining |
|
Deep Segmentation (FCN) |
Pixel-level subretinal fluid segmentation [14] |
Requires pixel-level annotation, expensive to produce at scale |
|
Hybrid Multi-modal DL |
Combined OCT + fundus, multi-backbone fusion [15] |
Highest reported accuracy; increased architectural complexity and reduced interpretability |
|
Quantum-Classical (this work) |
Frozen CNN features + fixed 8-qubit VQC + shallow classifier |
Quantum stage not yet jointly trained; contribution unverified (Sec. VI, IX) |
It is also worth situating HQNNDL by capability rather than by accuracy category alone. Table 5 compares, qualitatively, which of the four output types this pipeline produces, namely a class label, a biomarker profile, a localisation map, and an automated report, against what is typically reported for the approach categories above.
Table 5: Output capability comparison
|
Approach |
Class Label |
Biomarker Scores |
Region Localisation |
Auto Report |
|
Classical ML [7,8] |
Yes |
No |
No |
No |
|
Segmentation [5-9] |
Partial |
No |
Yes |
No |
|
Deep Learning [11,12] |
Yes |
No |
No |
No |
|
Deep Segmentation [13,14] |
No |
No |
Yes |
No |
|
Hybrid Multi-modal [15] |
Yes |
No |
Partial |
No |
|
HQNNDL (this work) |
Yes |
Yes* |
Yes* |
Yes |
Most classification-focused systems in the literature report only the first of these. The additional outputs in HQNNDL are intended as a step toward a more complete screening artefact, though, as noted throughout, they have not themselves been subjected to the same quantitative validation as the classification metrics in Section VI.
A reasonable objection to this line of work is that, absent a demonstrated quantum advantage, the added simulation cost and implementation complexity of the VQC stage are difficult to justify over a purely classical layer of equivalent size. We do not have a knockdown response to that objection at this stage; it is precisely the open question Section IX identifies as the priority for follow-up work. We would, however, offer two considerations in favour of continuing to investigate it rather than abandoning the architecture. First, the marginal cost of including the quantum stage in a research prototype is small relative to the cost of the surrounding pipeline (data collection, backbone training, deployment infrastructure), so the experiment is cheap to run properly even if it turns out negative. Second, a carefully reported negative result, meaning a controlled ablation showing no measurable benefit from the quantum stage on this task, would itself be a useful and citable finding for the small but growing literature on quantum machine learning applied to medical imaging. That would arguably serve the literature better than an unverified positive claim.
ETHICAL AND DEPLOYMENT CONSIDERATIONS
Beyond the technical limitations discussed throughout this paper, a screening tool of this kind raises considerations worth stating explicitly rather than leaving implicit. First, any such system should be positioned as a triage aid rather than a diagnostic replacement. A false negative in a screening context delays care, while a false positive consumes specialist time on an unnecessary referral, and the appropriate operating point between these costs is a clinical decision rather than a purely statistical one. Given the present system’s 64.5% recall on the Other Pathology class, it would not currently be responsible to deploy HQNNDL in any setting where a missed detection carries meaningful clinical consequence unless a human reviewer checks every output. That is the only deployment mode we would consider defensible at this stage.
Second, the proxy labelling scheme discussed in Section I means that any accuracy figure in this paper should not be read as a validated CSR-detection rate. A system trained on DME/CNV-as-CSR-proxy labels has learned to distinguish OCT presentations that are structurally similar to CSR, not CSR itself as adjudicated by a retinal specialist. Bridging this gap is not a matter of more training epochs; it requires a genuinely CSR-annotated dataset, which is the single limitation in Section IX we consider most important to resolve before any clinical framing of this work would be appropriate.
Third, the biomarker scores and affected-area localisation described in Sections 4.5 and 4.6 are presented to a hypothetical clinical user as supporting evidence, but neither has been checked against expert annotation in this study. Presenting unvalidated auxiliary outputs alongside a validated headline metric risks lending them unearned credibility purely through proximity; we have tried to avoid that here by repeatedly flagging their unvalidated status, and we would recommend any downstream use of this system continue that practice rather than quietly dropping the caveat as the pipeline matures.
Fourth, and more broadly, the temptation to inflate reported results is not unique to any one research group or dataset. It is arguably heightened in fast-moving, high attention areas like quantum machine learning applied to medicine, where an impressive-sounding accuracy figure attracts disproportionate interest relative to the rigour behind it. We raise this not to editorialise but because it bears directly on how the paper should be read. Every number in Section VI traces back to a specific, describable measurement on a specific, describable dataset, and where we lack such a measurement, whether a training curve, ROC/AUC, or a baseline comparison, we have said so rather than filling the gap with a plausible-looking but unverified figure. That discipline matters more, not less, in a field where the underlying architecture is novel enough that readers cannot easily sanity-check a suspicious number against their own intuition.
LIMITATIONS AND FUTURE WORK
o Dataset scale: training used 4,000 of the 83,484 images available in the full OCT2017 corpus. Scaling up the training set is the single most direct route to higher accuracy. It would also allow a proper held out test set separate from the validation set used for model selection, which the present single-split design does not provide.
o Label mapping: CSR-I/II labels are structural proxies (DME/CNV), not clinician-graded CSR severity. Clinical validity claims would require a genuinely CSR-labelled dataset, ideally graded independently by more than one retinal specialist so that inter-rater agreement can be measured and reported alongside model accuracy.
o Frozen backbone: ResNet-18 was not fine-tuned on retinal imagery, which likely limits peak accuracy, particularly for the Other Pathology class. Even a shallow fine-tuning pass over the final residual block, short of full end-to-end fine-tuning, would be a reasonable and inexpensive first experiment.
o Untrained quantum stage: the VQC parameters were not jointly optimised. A controlled ablation against a classical-only baseline of identical parameter count, together with parameter-shift training of the circuit, is needed to establish the quantum stage’s real effect instead of assuming it from architecture alone.
o Missing metrics: per-class specificity and AUC-ROC were not computed, since probability logs across thresholds were not retained during training. Future training runs should log full prediction probabilities by default, so that this analysis and full ROC curves can be produced without retraining.
o No baseline comparison: this work does not yet include classical CNN baselines (for example ResNet-50 or DenseNet-121) trained and evaluated under identical conditions. Without them it is not possible to say whether the quantum stage, the specific classifier architecture, or simply the choice of ResNet-18 features is responsible for the reported accuracy.
o Unvalidated auxiliary outputs: biomarker scores and affected-area localisation have not been checked against expert-annotated ground truth. These outputs should be treated as illustrative of system capability rather than as clinically meaningful measurements until such validation is performed.
o Hardware gap: the quantum circuit was simulated on classical hardware, so real NISQ device behaviour (noise, gate fidelity, decoherence) was not evaluated. Circuit performance on actual hardware may differ meaningfully from the noiseless simulation used here.
o Latency: the ~475 ms per-image processing time, dominated by quantum simulation, would need optimisation for high-throughput screening deployment. The most plausible route is batched statevector simulation across multiple images at once, rather than the current one-image-at-a-time implementation.
Addressing these points in roughly the order listed above gives a realistic roadmap for turning this feasibility study into a more rigorously validated system. The order starts with dataset scale and backbone fine-tuning, which are the least methodologically involved, and ends with real quantum hardware evaluation, which is the most resource intensive.
CONCLUSION
This paper presented HQNNDL, a hybrid CNN-quantum-classical pipeline for four-class OCT image classification, evaluated transparently on a stratified subsample of the OCT2017 dataset under an explicitly disclosed proxy labelling scheme. The system reaches 79.0% validation accuracy with a complete, working end-to-end pipeline, including automatic rejection of non-retinal input and supporting biomarker-scoring, region-localisation and report-generation modules.
We have been deliberate about stating what this result does and does not demonstrate. In particular, the quantum circuit’s contribution remains unverified, since its parameters were held fixed rather than trained, and the auxiliary clinical outputs have not been independently validated. This kind of explicit scoping, saying plainly what a result does not show and not only what it does, is as much a part of a feasibility study as the numbers themselves. That is especially true in a medical imaging context where overstated claims carry real downstream cost if they are taken at face value by a non-specialist reader.
Future work will prioritise scaling up the training set, fine-tuning the CNN backbone, implementing parameter-shift-rule training for the quantum stage, running a controlled classical-only ablation, and validating the biomarker and localisation outputs against expert annotation. Resources permitting, it will also evaluate the circuit on real NISQ hardware. Each of these is a well-defined, independently tractable piece of follow-up work rather than a vague direction, which we hope makes this paper useful as a concrete starting point rather than only a snapshot of a single training run.
We view hybrid quantum-classical pipelines as a legitimate direction worth continued, honestly reported investigation, not a shortcut to results that a fixed, untrained quantum stage cannot yet support. If this line of work has a single takeaway, it is that architectural novelty and demonstrated benefit are two different claims. A paper, particularly a student research paper working at the intersection of two demanding fields, is on firmer ground establishing the first while being explicit about not yet having established the second.
DECLARATIONS
Funding: The authors received no specific funding for this work.
Author Contributions
Annamnedi Govardhan conceived the study, designed the HQNNDL architecture, implemented the classical and quantum components of the pipeline, carried out the experiments, analysed the results, and wrote the original draft of the manuscript. P. Suresh Varma supervised the work, contributed to the methodology and to the design and validation of the experimental protocol, and reviewed and edited the manuscript. Both authors read and approved the final manuscript.
Ethics and Consent to Participate declarations: Not Applicable.
REFERENCES
- Kermany DS, Goldbaum M, Cai W, Valentim CCS, Liang H, Baxter SL, et-al . Identifying Medical Diagnoses and Treatable Diseases by Image-Based Deep Learning. 2018; 172: 1122-1131.
- Varghese J, Kesharwani D, Parashar S, Agrawal P. A Review of Central Serous Chorioretinopathy: Clinical Presentation and Management. Cureus. 2022; 14: e27965.
- Nirob MAS “EDDNet30: A Spatial Attention and Multi-Scale Fusion Model for Enhanced Eye Disease Classification with Explainable AI.” IEEE Access. 2026; 14: 19453-19471.
- Hassan B, Raja G, Hassan T, Usman Akram M. Structure tensor based automated detection of macular edema and central serous retinopathy using optical coherence tomography images. J Opt Soc Am A Opt Image Sci Vis. 2016; 33: 455-463.
- Hassan, Akram MU, Shaukat A, Khawajan S, Hassan B. “Structure Tensor Graph Searches Based on Fully Automated Grading and 3D Profiling of Maculopathy From Retinal OCT Images.” IEEE Access. 2018; 6.
- Hassan SAE, Akbar S, Gull, Rehman A, Alaska H. “Deep Learning-Based Automatic Detection of Central Serous Retinopathy using Optical Coherence Tomographic Images.” Proc. IEEE CAIDA. 2021: 206-211.
- Aoyama Y, Maruko I, Kawano T, Yokoyama T, Ogawa Y, Maruko R, et-al. Diagnosis of central serous chorioretinopathy by deep learning analysis of en face images of choroidal vasculature: A pilot study. PLoS One. 2021; 16: e0244469.
- Khalid S, Akram MU, Hassan T, Nasim A, Jameel A. Fully Automated Robust System to Detect Retinal Edema, Central Serous Chorioretinopathy, and Age Related Macular Degeneration from Optical Coherence Tomography Images. Biomed Res Int. 2017; 2017: 7148245.
- Liu J, Yan S, Lu N, Yang D, Lv H, Wang S, et-al. Automated retinal boundary segmentation of optical coherence tomography images using an improved Canny operator. Sci Rep. 2022; 12: 1412.
- He K, Zhang X, Ren S, Sun J. “Deep Residual Learning for Image Recognition.” Proc. IEEE CVPR. 2016: 770-778.
- Lu W, Tong Y, Yu Y, Xing Y, Chen C, Shen Y. “Deep Learning-Based Automated Classification of Multi-Categorical Abnormalities From Optical Coherence Tomography Images.” Trans Vis Sci Tech. 2018; 7: 41.
- Aziz A, Tezel NS, Kaçmaz S, Attallah Y. Early Diabetic Retinopathy Detection from OCT Images Using Multifractal Analysis and Multi-Layer Perceptron Classification. Diagnostics (Basel). 2025; 15: 1616.
- Ronneberger O, Fischer P, Brox T.”U-Net: Convolutional Networks for Biomedical Image Segmentation.” Proc. MICCAI. 2015: 234-241.
- Narendra Rao TJ, Girish GN, Kothari AR, Rajan J. “Deep Learning Based Sub-Retinal Fluid Segmentation in Central Serous Chorioretinopathy Optical Coherence Tomography Scans.” Proc. IEEE EMBC. 2019; 978-981.
- Hassan SA, Shahzad Akbar, Habib Ullah Khan. “Detection of Central Serous Retinopathy Using Deep Learning.” Multimedia Tools and Applications. 2023.
- Hassan SA, Akbar S, Rehman A, Saba T, Kolivand H, Bahaj SA. “Recent Developments in Detection of Central Serous Retinopathy through Imaging and Artificial Intelligence Techniques — A Review.” IEEE Access. 2021; 9: 168731-168748.
- Schuld M, Sinayskiy I, Petruccione F. “An introduction to quantum machine learning.” Contemporary Physics. 2015; 56: 172-185.
- Abbas A, Sutter D, Zoufal C, Lucchi A, Figalli A, Woerner S. The power of quantum neural networks. Nat Comput Sci. 2021; 1: 403-409.
- Hur T, Kim L, Park DK. “Quantum convolutional neural network for classical data classification.” Quantum Machine Intelligence. 2022; 4.
- Bergholm V. “PennyLane. Automatic differentiation of hybrid quantum-classical computations.” arXiv: 1811.04968. 2022.
- Preskill J. “Quantum Computing in the NISQ Era and Beyond.” Quantum. 2018; 2.