Effect of Indium Doping on the Structural Properties of Calcium Fluoride Powders
- 1. Department of Physics, Tishreen University, Syria
- 2. Department of Physics, Aleppo University, Syria
Abstract
Calcium fluoride (CaF2) density is 3.18 (g/cm3) melting at 1633 (K) and crystalize in cubic structure with lattice constants a = 5.432 Å. CaF2 is presently the fastest known scintillator. It has an emission component with subnanosecond decay time [1,2]. CaF2 has several scintillation emission bands. The fast scintillation light is emitted in the UV bands centered at 220 and 200 nm. The decay time of the fast component varies between 600 and 800 ps [3]. CaF2 has attracted much attention because of its wide range of potential applications in optoelectronic and microelectronic devices [4,6,8]. CaF2 compounds doped with rare-earth ions have been reported to display unique luminescence properties and can thus be used as scintillators [7,9-11].
Keywords
Powder, Calcium fluoride, Solid state reaction, Structural properties, Rare-earth ions
Citation
Alhasno M, Khoudro A, Zarouri T (2022) Effect of Indium Doping on the Structural Properties of Calcium Fluoride Powders. JSM Chem 9(1): 1058.
INTRODUCTION
Calcium fluoride (CaF2) density is 3.18 (g/cm3) melting at 1633 (K) and crystalize in cubic structure with lattice constants a = 5.432 Å.
CaF2 is presently the fastest known scintillator. It has an emission component with subnanosecond decay time [1,2].
CaF2 has several scintillation emission bands. The fast scintillation light is emitted in the UV bands centered at 220 and 200 nm.
The decay time of the fast component varies between 600 and 800 ps [3].
CaF2 has attracted much attention because of its wide range of potential applications in optoelectronic and microelectronic devices [4-6,8].
CaF2 compounds doped with rare-earth ions have been reported to display unique luminescence properties and can thus be used as scintillators [7,9-11].
EXPERIMENTAL METHOD
CaF2: In powders (x = 0.00, 0.04, 0.05, 0.06) (Tables 1-4) were prepared by a solid state reaction method, were accurately weighed in required proportions and were mixed and ground thoroughly using an Agate mortar and pestle to convert to very fine powders.
The grinding of the mixtures was carried out for 3 hours for all the powder samples. The ground powder samples were firing at 700°C for 3 hours.
RESULTS AND DISCUSSIONS
Structural properties
The X-ray diffraction (device type XRD-PW 1840 PHILIPS production is connected to a computer with software for diffraction spectrum processing) patterns of undoped and In doped CaF2 powders prepared with various In concentration 0 wt%, 4 wt%, 5 wt% and 6 wt% are shown in Figure 1.
The XRD reveals that all samples are having polycrystalline nature with cubic structure.
The relative intensities of undoped and in doped CaF2 powders are calculated. The distance between crystalline planes values (d) are calculated by using following relation:
(1)
Where d is distance between crystalline planes (A°), θ is the Bragg angle, λ is the wavelength of X-rays (λ=1.78897 A°).
The crystallite size is calculated from Scherrer’s equation [12]:
(2)
where, D is the crystallite size, λ is the wavelength of X-ray, ? is full width at half maximum (FWHM) intensity in radians and θ is Braggs’s angle.
The dislocation density is defined as the length of dislocation lines per unit volume and calculated by following equation [13]:
(3)
The lattice constants a for cubic phase structure is determined by the relation [14]:
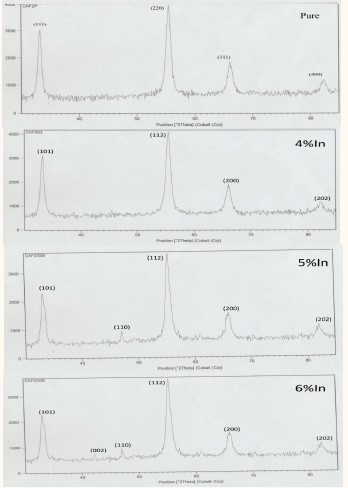
Figure 1: XRD results of pure CaF2, 4 wt% in doped CaF2, 5 wt% in doped CaF2, 6 wt% in doped CaF2.
Table 1: shows results of structural values of undoped CaF2 sample.
| Samples S |
2θ (deg) | (hkl) | d (A°) | Rel. int. [%] |
β (deg) | D (nm) | Average D(nm) |
Δ 1015line/m2 | Lattice const. a(Å) |
| CaF2 | 33.12 | (111) | 3.138 | 80 | 1.250 | 1.403 | 1.504 | 508.024 | 5.456 |
| 55.23 | (220) | 1.929 | 100 | 1.720 | 1.103 | 821.956 | |||
| Pure | 65.78 | (311) | 1.647 | 48 | 1.350 | 1.483 | 454.692 | ||
| 82.23 | (400) | 1.360 | 33 | 1.100 | 2.029 | 242.904 |
Table 2: shows results of structural values of In doped CaF2 samples (x=0.04).
| Samples | 2θ (deg) | (hkl) | d (A°) | Rel. int. [%] |
β (deg) | D (nm) | Average D(nm) |
Δ | Lattice const. a(Å) |
| 1015line/m2 | |||||||||
| CaF2:In | 33.06 | (101) | 3.144 | 82 | 1.335 | 1.294 | 1.520 | 597.216 | 4.759 |
| 54.82 | (112) | 1.943 | 100 | 1.650 | 1.148 | 758.780 | |||
| (4 wt%) | 65.72 | (200) | 1.648 | 46 | 1.550 | 1.291 | 416.233 | ||
| 82.14 | (202) | 1.361 | 28 | 0.950 | 2.347 | 181.54 |
Table 3: shows results of structural values of In doped CaF2 samples (x=0.05).
| Samples | 2θ (deg) | (hkla) | d (A°) | Rel. int. [%] |
β (deg) | D (nm) | Average D(nm) |
Δ | Lattice const. a(Å) |
| 1015line/m2 | |||||||||
| CaF2: In | 32.83 | (101) | 3.166 | 63 | 1.320 | 1.328 | 2.091 | 567.702 | 4.754 |
| 47.01 | (110) | 2.242 | 25 | 0.420 | 4.366 | 52.460 | |||
| (5 wt%) | 54.88 | (112) | 1.941 | 100 | 1.820 | 1.041 | 922.780 | ||
| 65.92 | (200) | 1.644 | 46 | 1.260 | 1.599 | 391.113 | |||
| 82.08 | (202) | 1.362 | 31 | 1.050 | 2.123 | 221.870 |
Table 4: shows results of structural values of In doped CaF2 samples (x=0.06).
| Samples | 2θ (deg) | (hkl) | d (A°) | Rel. int. [%] |
β (deg) | D (nm) | Average D(nm) |
Δ | Lattice const. a(Å) |
| 1015line/m2 | |||||||||
| CaF2:In | 32.91 | (101) | 3.158 | 65 | 1.450 | 1.209 | 2.561 | 684.143 | 4.747 |
| 42.12 | (002) | 2.489 | 22 | 0.350 | 5.148 | 37.733 | |||
| (6 wt%) | 46.96 | (110) | 2.245 | 27 | 0.450 | 4.075 | 60.220 | ||
| 54.98 | (112) | 1.938 | 100 | 1.750 | 1.152 | 753.520 | |||
| 66.96 | (200) | 1.621 | 38 | 1.230 | 1.639 | 372.256 | |||
| 82.06 | (202) | 1.362 | 29 | 1.040 | 2.143 | 217.748 |
(4)
where d and (hkl) are distance between crystalline planes and Miller indices, respectively.
CONCLUSION
This paper presents a study of structural properties of, in doped powders prepared by solid-state reaction method. X-ray diffraction patterns confirm that the samples have polycrystalline nature with cubic structure and show presence (111), (220), (311), and (400) planes in pure
sample. The preferred orientation is (220) for pure
.
For 4% in we have peaks correspond to (101), (112), (200), (202) .The preferred orientation is (112).
For 5% In We noticed appearance of this orientation (110).
For 6% In We noticed appearance of these orientations (002), (110).
The average of crystallite size is within the range [5.148- 1.041 nm] for all samples. It was defined that the lattice constants a for all the samples, were almost identical with JCPDS values.
REFERENCES
2. Battikh AA, et al. Studying of the Europium ion Effect on the Luminescence Calcium Fluoride Crystal. Tishreen University Journal. 2014; 36.


