Studying Structural Properties of ZnO: Pb3O4 Particles with Different Concentration
- 1. Department of physics, Faculty of science, Tishreen University, Syria
Abstract
Zno, doped tin oxide transparent conducting powder were prepared by solid-state reaction method. Structural properties of the samples were investigated as a function of various Zno,
doping levels (x=0.0- 0.2- 0.5- 0.8). The results of x-ray diffraction have shown that the samples are polycrystalline structure in tetragonal phase with preferential orientations along the (110) for all samples. The relative intensities, distance between crystalline planes (d), crystallite size (D), dislocation density (
) and lattice parameters (a), (c).
Keywords
Powder, Iron and Antimony doped Tin Oxide, Solid state reaction, Structural properties
Citation
Khoudro A, Alshamlat SA, Massoud H (2023) Studying Structural Properties of ZnO: Pb3O4 Particles with Different Concentration. JSM Chem 10(1): 1060.
INTRODUCTION
One of the most important semiconductors are the so-called transparent conduction oxides (TCO), which are compound semiconductors composed of metal combined with oxygen, that is, they are oxide conductors as (,
,
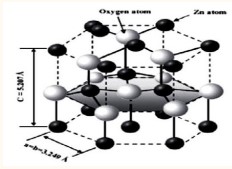
), and despite their large energy gap, the conduction band is full of free electrons due to the oxygen vacancies resulting from non-stoichiometry [1]. Translucent conductive oxides are characterized by a wide energy band change from 3eV to 5eV. This wide depends on several factors including: the type of solution compounds, deposition method and experimental conditions for sedimentation. One of these oxides is zinc oxide, which is a white, solid, pure compound, yellows on heating due to retinal abnormalities, it is non-toxic substance that does not dissolve in water or alcohol but rather dissolve in acetic acid, mineral acids, ammonia, ammonium carbonate and alkaline hydroxides. In preparing zinc oxide chemically laboratories depend on burning zinc in the air or by thermal smashing of its carbonates or nitrates, (Table 1) shows some of its properties [2]. Zinc oxide crystallizes in a hexagonal lattice, where the oxygen atoms occupy the hexagonal lattice sites, while the zinc atoms occupy half of the quaternary sites. The average constants of the crystal lattice are (a=b 3.25 A0 c=5.206 A0 ). The crystal structure of zinc oxide is similar of the (VI-II) i.e. the hexagonal compact structure as shown in the (Figure 1).
EXPERIMENTAL PROCEDURE
The ZnO: surfaces were prepared according to (Table 2) by the solid-state reaction method. They were accurately weighed in the required proportion and were mixed and ground well using an agate mortar to turn them into very fine Powders. Grinding of the mixture was carried out for 3 hours for all powder samples. The samples were placed in an oven at 700C0 for 3
hours in order to obtain the correct crystal structure. (Figure 3, 4)
RESULTS AND DISCUSSIONS
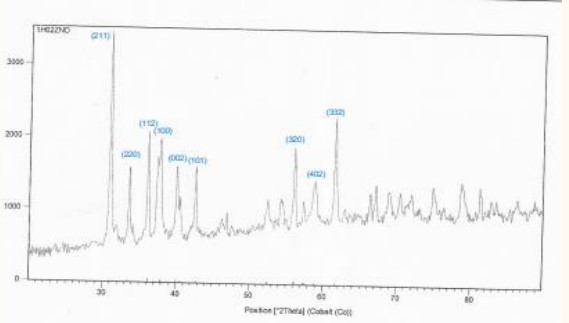
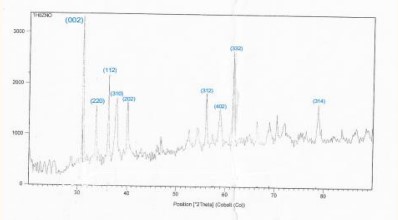
Figure 5, 6 shows: X-ray diffraction patterns for pure powders. The XRD reveals that pure Pb3O4 has a quadrangular structure, corresponding to vertices of (002), (112), (310), (202), (312), (402), (332), and (314). The preferred orientation is (002) for pure
.
We observed the disappearance of these (100), (201), (103), in samples ZnO: .
The change in peak intensity is mainly due to the replacement of ions by
ions in the ZnO lattice. This process leads to the movement of Zn+2 ions in interstitial sites; in fact, that ionic radius of
iron equals (0.088 nm) is smaller than the ionic radius of
(0.0915 nm).
The relative intensities of undoped and Sb doped powders are calculated.
The distance between crystalline planes values (d) are
Table 1: Same Physical and Chemical Properties of Zinc Oxide [3].
| Color | The Shape | Boiling Point (C0) | Melting Point (C0) | Density (g/cm3) | Molar Mass (g/mol) | Crystal Structure |
| White | Solid | 2360 | 1970 | 5.67 | 81.37 | Hexa |
Figure 1: The compact crystal structure of zinc oxide films.
Table 2: Shows the proportions of the prepared samples.
| Parcent wt % | ZnO | The sample | |
| 100 | 0 | 1 | 1 |
| 80 | 0.2 | 0.8 | 2 |
| 50 | 0.5 | 0.5 | 3 |
| 20 | 0.8 | 0.2 | 4 |
| 0 | 1 | 0 |
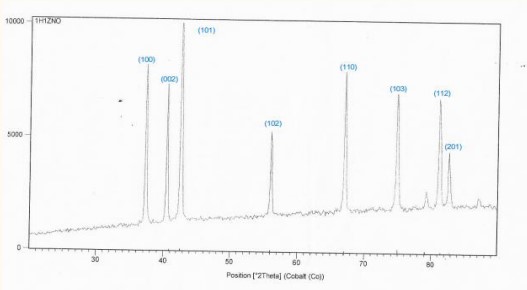
Figure 2: XRD spectra of sample No.1.
calculated by using following relation:
2d.sinθ = nλ (1)
Where d is distance between crystalline planes (A), θ is the Bragg angle, λ is the wavelength of X-rays (λ=1.54056 Å).
The crystallite size is calculated from Scherer’s equation [4]:
(2)
where, D is the crystallite size, λ is the wavelength of X-ray, β is full width at half maximum (FWHM) intensity in radians and θ is Braggs’s angle.
The dislocation density is defined as the length of dislocation lines per unit volume and calculated by following equation [5]:
(3)
The lattice constants a and c for tetragonal phase structure is determined by the relation [6]:
(4)
where d and (hkl) are distance between crystalline planes and Miller indices, respectively.
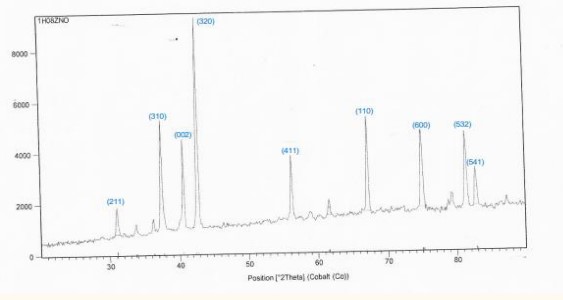
Figure 3: XRD spectra of sample No. 2.
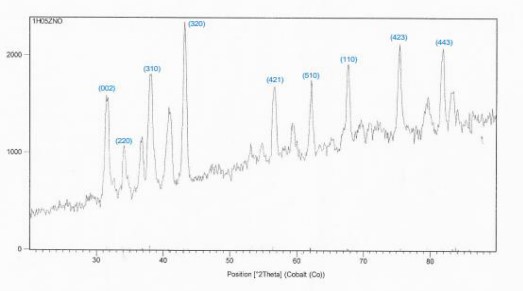
Figure 4: XRD spectra of sample No.3.
Figure 5: XRD spectra of sample No.4.
The calculated lattice constants a, c values are given in (Table 3, 4). It was seen that a, c and c/a match well with JCPDS data (a=b= 4.737 Å and c= 3.185 Å). The change in peak intensities is basically due to the replacement of ions with
ions in the lattice of the ZnO.
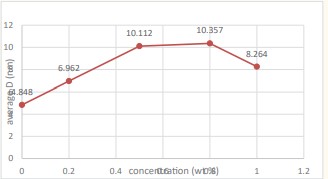
We notice from (Figure 7) that the sample ZnO shown in (Figure 2) is the best samples compared to the other samples because the average crystal size is larger and the intensity of dislocations is lower in the crystal lattice.
CONCLUSION
This paper presented a study of the structural properties
Figure 6: XRD spectra of sample No.5.
Figure 7: Represents variation of the average grain size with different concentrations of doped ZnO powders.
Table 3: XRD results for sample No.1 form table (2) where θ Bragg angle, D crystal size, d crystal distance, δ dislocation density and int, Miller's integers (hkl) and β width of each pit, a and c are crystal lattice constants.
| samples | 2θ (deg) | Int | (hkl) | β (deg) | d (Å) | D (nm) |
(nm) |
Lattic conste | |||
|
Pure |
3 | 100 | -2 | 0.4 | 3.456 | 4.352 | 5.059 | 52.798 | 42.207 | 8.855 | 6.912 |
| 33.2 | 47 | -220 | 0.3 | 3.131 | 5.849 | 29.23 | |||||
| 35.9 | 65 | -112 | 0.3 | 2.902 | 5.892 | 28.805 | |||||
| 37.3 | 52 | -310 | 0.4 | 2.797 | 4.437 | 50.795 | |||||
| 40.2 | 49 | -202 | 0.4 | 2.603 | 4.476 | 49.913 | |||||
| 55.9 | 56 | -213 | 0.3 | 1.908 | 6.346 | 24.831 | |||||
| 58.8 | 46 | -402 | 0.5 | 1.828 | 3.86 | 67.711 | |||||
| 61.4 | 81 | -332 | 0.4 | 1.752 | 4.889 | 41.836 | |||||
| 78.5 | 49 | -314 | 0.4 | 1.414 | 5.425 | 33.94 | |||||
Table 4: XRD results for sample No.2 form table (2) where θ Bragg angle, D crystal size, d crystal distance, δ dislocation density and int, Miller's integers (hkl) and β width of each pit, a and c are crystal lattice constants.
| samples | 2θ (deg) | Int | (hkl) | β (deg) | d (Å) | D (nm) |
(nm) |
||||
| Lattic conste | |||||||||||
|
80%W |
30.9 | 100 | -2 | 0.35 | 3.354 | 4.986 | 5.655 | 40.225 | 40.376 | 8.779 | 6.714 |
| 33.5 | 47 | -220 | 0.25 | 3.104 | 7.025 | 20.263 | |||||
| 36.2 | 61 | -112 | 0.25 | 2.879 | 7.077 | 19.966 | |||||
| 38 | 58 | -100 | 0.4 | 2.747 | 4.446 | 50.589 | |||||
| 40.2 | 46 | -2 | 0.25 | 2.603 | 7.163 | 19.489 | |||||
| 42.9 | 46 | -101 | 0.25 | 2.446 | 7.227 | 19.146 | |||||
| 56.1 | 55 | -320 | 0.5 | 1.902 | 3.811 | 68.852 | |||||
| 58.9 | 42 | -421 | 0.6 | 1.819 | 3.219 | 96.506 | |||||
| 61.8 | 67 | -332 | 0.33 | 1.742 | 5.939 | 28.351 | |||||
|
20% W |
31.1 | 20 | -2 | 0.33 | 3.336 | 5.288 | 6.504 | 35.761 | 26.453 | 8.876 | 6.672 |
| 37.2 | 57 | -310 | 0.3 | 2.804 | 5.914 | 28.591 | |||||
| 40.3 | 44 | -2 | 0.2 | 2.596 | 8.956 | 12.467 | |||||
| 42.6 | 100 | -320 | 0.25 | 2.462 | 7.229 | 19.135 | |||||
| 57.2 | 42 | -411 | 0.4 | 2.033 | 4.681 | 45.637 | |||||
| 67.3 | 56 | -110 | 0.25 | 1.614 | 8.081 | 15.313 | |||||
| 75 | 51 | -600 | 0.35 | 1.469 | 6.056 | 27.266 | |||||
| 81.3 | 49 | -532 | 0.33 | 1.373 | 6.716 | 22.171 | |||||
| 83 | 35 | -541 | 0.4 | 1.349 | 5.613 | 31.74 | |||||
of ZnO and compounds: prepared by solid state reaction method [7]. The X-ray diffraction patterns of the pure zinc oxide sample confirm that it is of poly crystalline nature and hexagonal compact structure and shows the presence of trends (110), (101), (002) and (101) [8]. The preferred orientation is (101), but for ZnO sample similar to
by (50-80) % wt.
The preferred trend changes to the (320), and we observed the disappearance of these trends (100), (201), (103) in the ZnO: [9-14].
The average crystal size is within the range (4.848-8.264 nm) for all samples. It was determined that the lattice constants c and a for all samples, were the ratio remained constant with the increase of the dopant concentration .
