Studying the Structural Properties of Lead Tetroxide Pb3o4 Doped Tin Oxide SnO2 for Different Ratios X = 0, 0.3, 0.5
- 1. Department of physics, Faculty of science, Tishreen University, Syria
Abstract
Pb3O4 doped tin oxide (SnO?) transparent conducting powder was prepared by the solid state reaction method. Structural properties of the samples were investigated as a function of various Pb3O4-doping levels (x=0.0-0.3-0.5). The results of x-ray diffraction have shown that the sampIes are polycrystalline structure in tetragonal phase with preferential orientations along the (110) for SnO?.
Pure but for Pb3O4 doped SnO? change to (332). The distance between crystalline planes (d), grain size (D) and lattice parameters( a, c) and primary cell volume V were determined.The measurements also showed that the average grain size D for the pure compound of tin oxide is 11.877 nm, while the average grain size D for the dopant ratios (30,50 wt%) are respectively is (16.111, 13.116 nm), the average grain size D of sample 50% was closest to the pure tin oxide .Doping with lead oxide Pb3O4 increases the value of the crystal lattice constants a and the constant compound. Which leads as a result to an increase in the volume of the primary cell volume V when the ratios of dopant x% is increased.
Keywords
Powder, Lead tetroxide, Tin oxide, Solid state reaction, Structural properties
Citation
Khadro A, Barhoum A, Moussa HS (2023) Studying the Structural Properties of Lead Tetroxide Pb3o4 Doped Tin Oxide SnO? for Different Ratios X = 0, 0.3, 0.5. JSM Chem 10(1): 1059.
INTRODUCTION
Nano-crystals of semiconductor metal oxides have attracted a great interest due to their intriguing properties, which are different from those of their corresponding bulk state [1]. Tin dioxide has achieved special attention among the metal oxides, because of its wide band gap (3.6eV), optical transparency and high carrier density, thermal and chemical stabilities [2, 3].
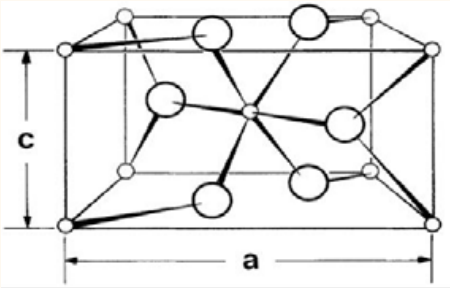
Because of its unique electronic, optical, electrochemical and catalytical properties, it has been widely used in flat panel displays, transparent conducting electrodes, solar cells, gas sensors and rechargeable Li -ion batteries, etc [4] (Table 1). It crystallizes in the tetragonal rutile structure with space group P42/mnm. The lattice parameters a=b= 4.738 Å and c = 3.187 Å [5]. Its unit cell contains two tin and four oxygen atoms as is shown in (Figure 1). The tin atom is at the center of six oxygen atoms placed at the corners of a regular octahedron. Every oxygen atom is surrounded by three tin atoms at the corners of an equilateral triangle [6]. Lead (II, IV) oxide, also called red lead or minium, is the inorganic compound with the formula . A bright red or orange solid, it is used as pigment, in the manufacture of batteries, and rustproof primer paints. It is an example of a mixed valence compound, being composed of both Pb(II) and Pb(IV) in the ratio of two to one [7]. It crystallizes in the tetragonal structure with space group P42/mbc. The lattice parameters a=b= 8.815 Å and c =6.656 Å. Lead tetroxide
has achieved special attention among the metal oxides, because of its wide band gap 2.2eV [8]. Lead tetroxide density is 8.3 g.cm3 melting point 500oC, molar mass is 685.6 g.mol-1 (Figure 2)
Table 1: shows result of structural values of pure sample.
| Average D/nm | D /nm | β / deg | d /Å | (hkl) | 2θ /deg | Samples |
|
11.877
|
6.128 | 1.392 | 3.348 | (110) | 26.62 |
|
| 6.240 | 1.391 | 2.637 | (101) | 33.99 | ||
| 9.908 | 0.886 | 2.370 | (200) | 37.95 | ||
| 20.012 | 0.440 | 2.311 | (111) | 38.96 | ||
| 17.471 | 0.510 | 2.121 | (210) | 42.62 | ||
| 7.297 | 1.265 | 1.762 | (211) | 51.87 | ||
| 18.473 | 0.506 | 1.676 | (220) | 54.75 | ||
| 9.372 | 1.012 | 1.593 | (002) | 57.87 | ||
| 7.221 | 1.341 | 1.497 | (310) | 61.99 | ||
| 5.180 | 1.898 | 1.437 | (112) | 64.84 | ||
| 15.656 | 0.632 | 1.416 | (301) | 65.96 | ||
| 6.207 | 1.645 | 1.323 | (202) | 71.25 | ||
| 25.240 | 0.424 | 1.221 | (321) | 78.30 |
Figure 1: Unit cell of the crystal structure of Large circles indicate oxygen atoms and the small circles indicate tin atoms.
Figure 2: Unit cell of the crystal structure of red circles indicate oxygen atoms and the gray circles indicate lead atoms [10].
[9]. The aim of this paper is preparing a doped metal oxide (1-x)
(x) and characterizing by X-ray to study the structural properties.
EXPERIMENTAL METHOD
(1-x)
(x) powders (x = 0, 0.3, 0.5) were prepared by a solid state reaction method. Were accurately weighed in required proportions and were mixed and ground thoroughly using an Agate mortar and pestle to convert to very fine powders. The grinding of the mixtures was carried out for 3 hours for all the powder Samples. The ground powder samples were firing at 700o C for 3 hours (Table 2).
RESULTS AND DISCUSSIONS
Structural Properties
The X-ray diffraction patterns of undoped and doped
powders prepared with various
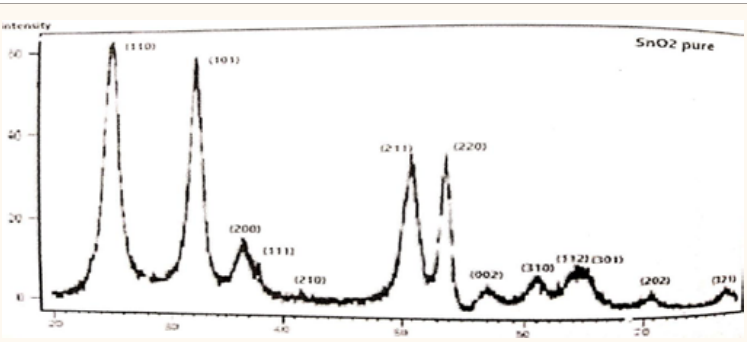
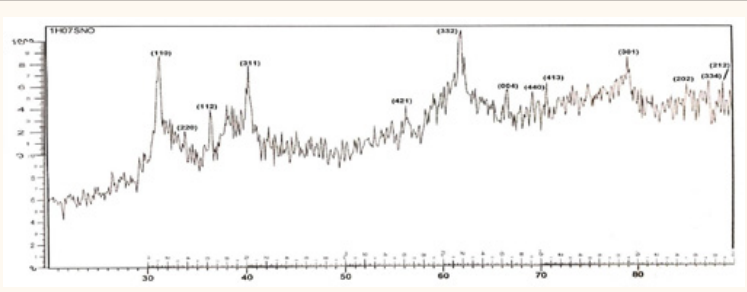
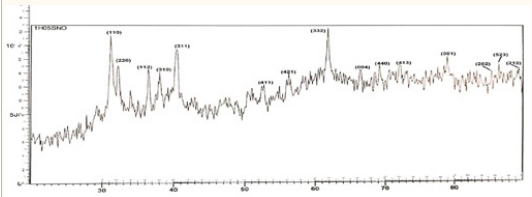
concentrations (0, 0.3, 0.5) wt% are shown in (Figure 3-5). The XRD reveals that all samples are having polycrystalline nature with tetragonal structure and peaks correspond to (110), (101), (200) and (111). (210), (211), (220) (002), (310), (112), (301), (202) and (321) planes. The preferred orientation is (110) for pure but for
doped
powders at 30 and 50wt% doping the preferred orientation change to (332)
The distance between crystalline planes values (d) of undoped and doped
powders are calculated by using following relation
2dsinθ=nλ (1)
where D is distance between crystalline planes (Α), θ is the Bragg angle, λ is the wavelength of X-rays (λ=1.54056 Å)
The grain size is from calculated Scherer’s equation: [11]
(2)
where, D is the grain size, λ is the wavelength of X-ray, β is full width at half maximum (FWHM) intensity in radians and θ is Bragg’s angle
The lattice constants a and c for tetragonal phase structure are determined by the relation (3) and the primary cell volume V from equation (4): [12]
(3)
V=a2.c 4
Where d and (hkl) are distance between crystalline planes and Miller indices, respectively. a, c are the crystal lattice constants (Å). The calculated lattice constants a, c and primary cell volume values are given in (Table 3).
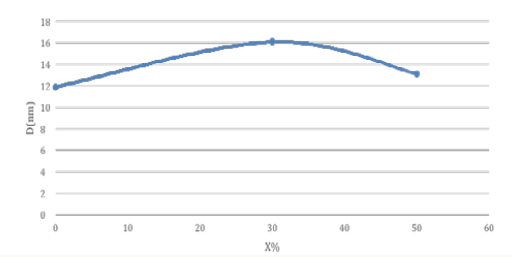
We found that the average grain size D for pure tin dioxide is 11.877 nm, while the average grain size D for similar compounds wt% (30, 50) is nm (16.111, 13.116) and the average grain size D of sample 50% was closest to the pure compound. The (Figure 6) is shown the above Starting from 0%, the average grain size D increases until it reaches 30%, then it starts decreasing until it reaches 50%. The average grain size D for the impurity has a greater than value of pure compound
shown in (Figure 7).
Table 2: Shows result of structural values of (0.7:0.3) SnO2: sample.
| Average D/nm | D /nm | β /deg | d /Å | (hkl) | 2θ / deg | Samples |
|
16.111 |
20.000 | 0.805 | 110 | 3.348 | 31.001 |
0.7:0.3 |
| 22.921 | 0.377 | 112 | 2.457 | 35.867 | ||
| 12.000 | 0.210 | 311 | 2.252 | 40.819 | ||
| 13.703 | 0.130 | 421 | 1.984 | 56.556 | ||
| 23.841 | 0.462 | 332 | 1.865 | 61.250 | ||
| 9.590 | 0.264 | 220 | 1.676 | 66.029 | ||
| 21.700 | 0.264 | 440 | 1.521 | 70.056 | ||
| 13.166 | 0.234 | 413 | 1.887 | 71.559 | ||
| 15.454 | 0.036 | 301 | 1.416 | 78.400 | ||
| 20.800 | 0.010 | 202 | 1.323 | 85.159 | ||
| 14.759 | 0.295 | 334 | 1.155 | 87.971 | ||
| 5.397 | 0.009 | 212 | 1.256 | 89.255 |
Figure 3: XRD result of pure .
Figure 4: XRD result of 30% doped
.
Figure 5: XRD result of 30% doped
.
Figure 6: Variation of the average grain size D with different ratios (x%) of doped
powders.
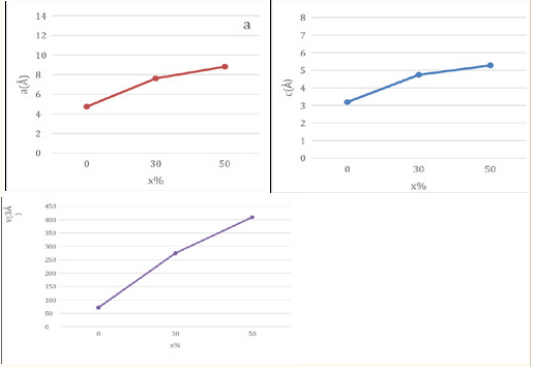
Figure 7: (a) variation of the lattice constants with different ratios (x %). (b) Variation of the lattice constants c with different ratios (x %). (c) Variation of the primary cell volume V with different ratios (x %). l
We also observed from the similarity in the X-ray spectra of the samples in the peaks and directions, and this indicates that the phase of the pure sample did not change when it was mixed with lead oxide and therefore all samples contain one phase, which is the tetragonal phase.
Considering the relations (3 and 4), it is possible to calculate each of the structural parameters: the crystal lattice constants a and c and the size of the primary cell volume V as in the following (Table 4):
We observed from (Table 4) that the results indicate that doping with lead oxide increases the value of the crystal lattice
Table 3: shows result of structural values of (0.5:0.5) :
sample.
| Average D/nm | D /nm | β / deg | d /Å | (hkl) | 2θ /deg | Samples |
|
13.116 |
18.473 | 0.003 | 3.318 | (110) | 31.013 |
|
| 7.221 | 1.041 | 2.457 | (220) | 33.991 | ||
| 15.656 | 0.150 | 2.198 | (112) | 35.951 | ||
| 11.877 | 1.132 | 1.984 | (310) | 37.472 | ||
| 9.351 | 1.163 | 1.831 | (311) | 40.623 | ||
| 5.183 | 1.475 | 1.676 | (411) | 52.206 | ||
| 17.416 | 0.375 | 1.491 | (421) | 56.436 | ||
| 6.870 | 0.527 | 1.887 | (402) | 58.515 | ||
| 22.012 | 0.631 | 1.378 | (332) | 61.261 | ||
| 20.000 | 0.264 | 1.351 | (220) | 66.047 | ||
| 6.240 | 1.264 | 1.323 | (440) | 70.133 | ||
| 15.012 | 0.134 | 1.294 | (413) | 71.252 | ||
| 5.397 | 0.368 | 1.273 | (301) | 78.301 | ||
| 11.341 | 0.110 | 1.264 | (202) | 85.171 | ||
| 17.898 | 0.004 | 1.249 | (523) | 86.062 | ||
| 19.908 | 0.124 | 1.201 | (212) | 89.255 |
Table 4: Primary cell parameters of the studied samples.
| X(%) | 0 | 30 | 50 |
| a/Å | 4.733 | 7.615 | 8.809 |
| c/Å | 3.185 | 4.735 | 5.271 |
| V/Å3 | 71.348 | 274.574 | 409.021 |
constant a, c. This is because the ratio of lead ions increases in the structure of the compound. This leads to an increase in the volume of the primary cell volume V from 71.348 Å3 until it reaches the value 409.021 Å3when the dopant ratio is increased X %.
CONCLUSION
This paper presents a study of structural properties of doped
powders prepared by solid state reaction method. X-ray diffraction patterns confirm that the samples have polycrystalline nature with tetragonal structure and show presence (110), (101), (200), (111), (210), (211), (220), (002), (310), (112), (301), (202) and (321) planes in pure tin oxide sample. The
have preferred orientation along (110) but for all doping levels the preferred orientation change to (332) plane. The average of crystallite size is within the range [11.877-16.111 nm] for all samples. It was defined that the lattice constants a, c for all the samples
![Figure 2 Unit cell of the crystal structure of Pb3o4 red circles indicate oxygen atoms and the gray circles indicate lead atoms [10].](https://www.jscimedcentral.com/public/assets/images/uploads/image-1674300776-1.png)
