Assessing Natural Resource Change Drivers in Vhembe Biosphere and Surroundings
- 1. Department of Geography, Faculty of Natural and Agricultural Science, University of the Free State, Bloemfontein
- 2. Centre for Environmental Studies, Department of Geography, Geo-informatics and Meteorology, University of Pretoria, Hartfield, Pretoria
Abstract
Biodiversity loss in terms of habitat changes is occurring at alarming rates throughout the world. This study aimed at assessing the drivers of vegetation cover resources as a major driver of ecosystems change in the Vhembe biosphere. In this study, an analysis of vegetation cover resource change drivers over 28 years (1990-2018) in the Vhembe biosphere was conducted. Twelve (12) land cover classes reclassified from South African National Land Cover (SANLC) of Seventy-two (72) classes data set were used in this assessment, including natural woodland; thicket/dense bush; shrubland; indigenous forests; grassland; water bodies and wetlands; barren land; built-up residential area; cultivated commercial area and mines. This data was reclassified to create a natural resource change map with 12 land cover classes indicating transformation and non-transformation natural resources. The 12 natural resource classes were further reclassified to only 2 classes, where the value of 1 was given to natural resources that changed (transformed), hereafter referred to as loss, and 0 to natural resources that never changed (no transformation). Logistic regression analysis was then used to determine drivers of change (dependent variables) with a set of independent variables such as climatic temperatures, topography, edaphic factors in the study area. The study identified climatic variables such as minimum temperatures, average temperatures, precipitation, and soil chemical and physical properties such as; soil pH, nitrogen, soil organic carbon, sand, silt, coarse fragments as the major drivers of vegetation cover natural resources change in Vhembe biosphere.
Keywords
Natural resources; Land use and land cover change; Drivers; Bioclimatic; Transformation; Remote sensing
Citation
Nuwarinda H, Ramoelo A, Adelabu SA (2022) Assessing Natural Resource Change Drivers in Vhembe Biosphere and Surroundings. JSM Environ Sci Ecol 10(2): 1083.
INTRODUCTION
Vegetation cover as natural resource usage in ecosystems is one of the contributors of natural resource change globally [1,2]. Vegetation cover is a key variable in the ecosystem defining the availability of habitats and land resources [3,4]. Vegetation cover can be easily measured in the field by assessing the percentage of the ground that is covered by the existing vegetation [2,5,6]. Vegetation cover can reflect the conditions of the ecological environment [5-7], and the main factors that influence vegetation cover are climate change and human activities [7,8].
The determinants of natural resource change are structured under either socio-economic [9], or bio-physical categories [5,10,11]. Natural resource change occurs when unsustainable resource uses like fuelwood collection [12], conversion of more pristine land into agricultural land, increased settlement [13], happen in any given ecosystem. The geographical spread and quality of natural resources has been driven by human activities at local and global scale [13-15], in a short time scale leading to major impacts on local and regional ecosystem services and functionalities [16]. Conversely, climate and human activities are among the basic drivers [17,18], controlling and affecting the spatial distribution of vegetation and its changes [18-20]. Climatic factors influence the growth processes of natural vegetation on a short to long-term scale [21], restrict the geographical distribution of terrestrial vegetation [22], and determine the type and magnitude of regional ecosystem services [23,24].
With the combined effects of localized, regional [25,26], and global climate change and socio-economic activities [26,27], vegetation resources at different spatial scales [28] are undergoing interconnected change processes [18,20]. Globally, differentiation of vegetation cover resource and trends are driven by various factors, such as climate [29,30], landforms [31,32], land cover types [33], and human activities [34,35]. For example, de Jong et al., 2012 [36]., explained that global terrestrial vegetation activities had substantially declined with variations in climate change from 1982 to 2008.
The latest study by Skowno et al. 2021 [37]., highlights that South Africa has lost over 0.24% of natural habitats since 1990. It is estimated by Jewitt 2021 [37]; that the highest measure of losses are recorded between the east and southern Africa regional costs [37], with more significant loss recorded in the in-land non coasts grasslands, and savannas Mpumalanga and Limpopo [37]. Natural habitat loss caused by man and his activities such infrastructure development, animal, and crop husbandry [38] is the leading driver of biodiversity loss in mundane ecosystems in South Africa [38,39].
The increased loss of bionetwork has been recorded in recent years -2014-2018 [39], indicating that; the classic drivers of change for e.g., cropland expansion, human settlements, plantation forestry, and mining are escalating at an increasing rate [38,39].
Nature has been degraded by the aggregated drivers of unlimited actions [40], in the drive to meet basic material needs, and due to a growing world population [40]. The forest natural resource assessment [41], report stated that on average, 49 countries in sub-Saharan Africa have lost 0.5% of their forest cover resources between 1990’s – 2000 due to a multitude of drivers. Since the 1970’s according to IPES 2019 [40]., global extraction of biomass, fossil fuels, minerals, and metals increased six fold because of unlimited actions. Drivers are natural or human-induced factors [31] that cause changes to ecosystems [42] and can either be direct [31]: causing a physical change that can be measured [43], or indirect; change that is less measurable in terms of causality [44,45]. The combined effects of these drivers have resulted in significant changes in our natural resources and ecosystems [46]. A direct driver unequivocally influences ecosystem processes [47], while an indirect driver operates more diffusely, by altering one or more direct drivers [44,48]. Examples of driver include predominantly climate change [49], nutrient pollution, land conversions [50,51] leading to habitat modification [52-54], overexploitation, and invasive species and associated diseases [44,53]. The Millennium Ecosystem Assessment categories of indirect drivers of natural resource change are demographic, economic, socio-political, scientific, and technological, cultural, and religious [45].
With integrated effects of global climate change, regional and socioeconomic activities [55], vegetation and its associated natural resources at different spatial scales [56], are undergoing complex change processes [20,57]. At the regional scale, natural and anthropogenic drivers are strongly coupled [58]. Identification of natural and anthropogenic drivers of vegetation natural resource changes in any ecosystem is the basis for adapting to climate change and improve human activities [56]. Logically, distinguishing natural and anthropogenic drivers of vegetation natural changes has should be become the basis for ecological restoration [56]. Importantly, changes in the environment due to land use can negatively affect the functioning of the ecosystem [18,60]. These changes have been mainly driven by the expansion of agricultural activities and human settlements [35].
The interaction of humans with the environment to derive useful resources has altered the structure of the landscape and its natural resource [36,61]. Nuwarinda et al. 2021 demonstrated the recurrence of natural resource change in the Vhembe Biosphere. The most evident change based on area size in hectares was thicket/dense bush vegetation, natural woodland, and grassland vegetation. There are a plethora of drivers of vegetation or natural resource change as indicated above. There is a need to determine the most prevalent and significant drivers of change within the Vhembe biosphere to enhance the effectiveness of natural resource management, and such information is limited. The question is, which drivers of change are prevalent and significant in explaining the natural resource or vegetation change in the Vhembe Biosphere? Assessment and understanding the drivers of natural resource changes can provide quantitative data that will potentially assist with the development of natural resource management policies towards natural resource management, planning, and conservation.
MATERIALS AND METHODS
Study Area
We assessed natural resource change drivers in the Vhembe Biosphere region a study area located in Limpopo Province Figure 1 (Nuwarinda et al., 2021). The area constitutes noteworthy biodiversity hotspots and a source of countless ecosystem services to more than 1.5 million people [62], who live within and outside the biosphere boundaries [62,63]. In the study area, steady and fast economic growth is highly significant and relates to increased pressure and demand for natural resource exploitation [63]. Vhembe biosphere is located between latitude 22º07’32” and 23º34’14” S and longitude 28º39’32” and 31º33’49”E [62,63]. The study areas vegetation consists of three biomes [64] namely; savannah, grassland, and forest, with four bioregions that are home to 23 different vegetation types or biotopes [64,65], where eight of these biotopes are endemic to South Africa [64,66]. It also constitutes a bio-geographical node (Dombo et al., 2006) that include the Kalahari and Lowveld bioregions, which are characterized by temperate and tropical climatic conditions [67].
Vhembe biosphere is characterized by different and sparsely distributed soil types that include clay, sandy, and red-loam soils [68]. The common soil type in the Vhembe Biosphere is fertile red loam soil [68,69]. This soil type has a high-water holding capacity retaining water for long periods and is easily eroded by major erosive agents such as rain and wind [68]. Vhembe Biosphere has complex topographic features like Soutpansberg mountain ranges that contribute to climate patterns ranging from; temperature, humidity, clouds, and precipitation [70,71]. The mountain ranges potentially exert a high impact on the weather and climate patterns [72], in the study area and contribute to high rainfall levels and distribution of water drainage patterns like surface and groundwater in the low-lying areas of the Vhembe biosphere [70]. High average annual rainfall in the Vhembe biosphere is experienced in the summer season from October through March as the Inter-Tropical Convergence Zone (ITCZ) moves south [71], while the peak average rainfall months are January and February. (Figure 1).
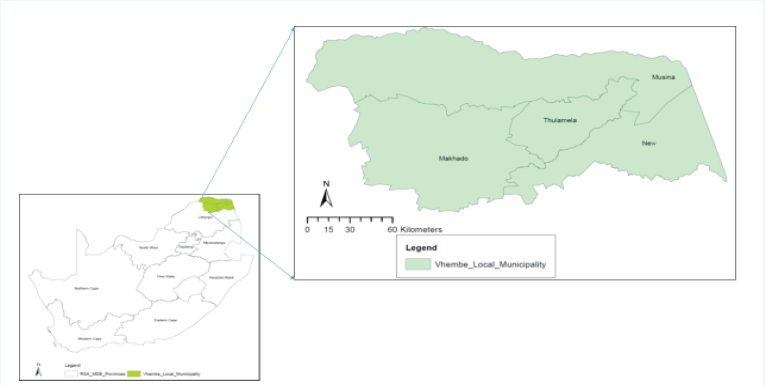
Figure 1: Study area Location.
Data used
The start off point was to pre-process acquired set of land cover dataset to ensure that it has applicable projections and clipped to properly suit the study area extent (Nuwarinda et al., 2021). Following to this, post-classification approach [73], was used to assess and detect natural resource change in the study area based on statistical interpretation and analysis [74]. 1990 and 2018 land cover images were obtained and converted from Universal Transverse Mercator (UTM) to GCS_WGS_1984 ALBERS [75], with a spatial resolution of 30m x 30m so as to easily tabulate data for change analysis (Nuwarinda et al., 2021). To identify the percentage change of natural vegetation resource cover change for study period from1990 to 2013, and 2013 to 2018, table 1 adopted and modified from Nuwarinda et al., 2021 was modified to show land use land cover classes for the study area in hectares and percentage change for each year 1990, 2013, and 2018 (Nuwarinda et al., 2021) followed by appropriate calculations to determine percentage change for land cover and land use. (Table 1).
| Distribution of Natural Resources in hectares (ha) in the study area | ||||||
| Natural resource distribution in Hectares %age |
1990 | 1990 | 2013 | 2013 | Hectares 2018 | 2018 |
| Indigenous forest | 13 211.91 (ha) | 1% | 16 880.49 (ha) | 5% | 7 402.92 (ha) | 1% |
| Thicket/Dense bush | 338 723.73 (ha) | 22% | 63 569.34 (ha) | 20% | 23 166.92 (ha) | 2% |
| Natural Wood land | 94 665.42 (ha) | 6% | 81 755.37 (ha) | 26% | 257 889.68 (ha) | 21% |
| Planted forest | 28 896.12 | 2% | 23 124.24 (ha) | 7% | 35 460.12 (ha) | 3% |
| Shrub land | 263 070.63 (ha) | 17% | 19 685.43 (ha) | 6% | 977.72 (ha) | 0% |
| Grasslands | 562 136.49 (ha) | 37% | 64 506.6 (ha) | 20% | 326 498.96 (ha) | 27% |
| Waterbodies | 2 719.44 (ha) | 0% | 4 483.71 (ha) | 1% | 8 953.64 (ha) | 1% |
| Wetlands | 5 788.8 (ha) | 0% | 1 125.27 (ha) | 0% | 3 561.04 (ha) | 0% |
| Barren land | 16 803.09 (ha) | 1% | 20 340.99 | 6% | 24 971.92 (ha) | 2% |
| Cultivated commercial | 132 246.9 (ha) | 9% | 10 846.8 (ha) | 3% | 365 644.92 (ha) | 30% |
| Residential Built-up | 74 070.27 (ha) | 5% | 9 220.14 (ha) | 3% | 147 701.88 (ha) | 12% |
| Mines | 3447.09 (ha) | 0% | 3 183.48 (ha) | 1% | 2 497.96 (ha) | 0% |
| Totals | 1535779.89 (ha) | 100% | 318721.86 (ha) | 100% | 1204727.68 (ha) | 100% |
In assessing natural resource change drivers, the study used bioclimatic data Table 2 [76], to evaluate and assess natural resource change across multiple natural resources in the Vhembe biosphere. Bioclimatic variables calculated from monthly and precipitation and temperature values from 1990 to 2018 were generated through interpolation [77], of average monthly climate data (Table 1) at 30 arc-seconds spatial resolution [78.79], a total of 35 variables were used as dependent variables in the natural resource change analysis [76]. Rainfall and mean temperature bioclimatic variables were used in tandem with topographic
variables and edaphic factors [80] to predict natural resource change. Bioclimatic variables were obtained from the WorldClim archives (http://www.worldclim.org/) of the global climate conditions. The WorldClim climatic data sets are long-term (30-year) mean annual measurements [81], containing grids of rainfall and temperature [81], as well as other summarised climatic layers like wettest, driest, coldest, and hottest months and quarters of the year [81].
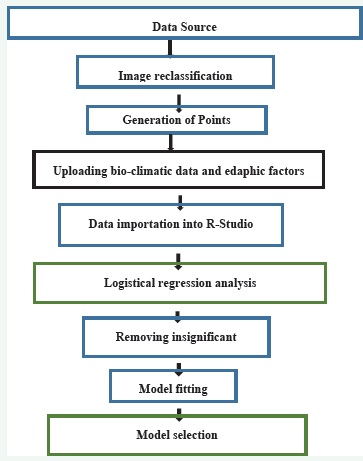
Figure 2: Steps taken for logistical regression analysis and model selection.
Historical climate data comprising 19 bioclimatic variables were downloaded from the WorldClim website (www.worldclim. org) at 30arc second (approximately 1 Km2) resolution. Digital elevation model (DEM) [82], derived from the Shuttle Radar Topography Mission (SRTM) [83], elevation data downloaded from the WorldClim website (www.worldclim.org) was also used to generate slope and aspect using ArcMap. Edaphic variables used in the study were also drawn from soil attributes from the soil layer map [84], including soil pH, soil organic carbon chemistry, and soil organic carbon, download via www.SoilGrids. org under the Open Database License (ODbL). The variables used in explaining the natural resource change in this study are presented in Table 1,2.
| Climatic | Variables | Source | Scale/resolution |
|---|---|---|---|
| Bioclimatic | BIO1 = Annual Mean Temperature BIO2 = Mean Diurnal Range (Mean of monthly (max-temp-min temp) BIO3 = Isothermality (BIO2/BIO7) (×100) BIO4 = Temperature Seasonality (standard deviation ×100) BIO5 = Max Temperature of Warmest Month BIO6 = Min Temperature of Coldest Month BIO7 = Temperature Annual Range (BIO5-BIO6) BIO8 = Mean Temperature of Wettest Quarter BIO9 = Mean Temperature of Driest Quarter BIO10 = Mean Temperature of Warmest Quarter BIO11 = Mean Temperature of Coldest Quarter BIO12 = Annual Precipitation BIO13 = Precipitation of Wettest Month BIO14 = Precipitation of Driest Month BIO15 = Precipitation Seasonality (Coefficient of Variation) BIO16 = Precipitation of Wettest Quarter BIO17 = Precipitation of Driest Quarter BIO18 = Precipitation of Warmest Quarter BIO19 = Precipitation of Coldest Quarter |
WorldClim 2.1: (Fick, S. E. and R.J. Hijmans, 2017) |
~1Km² |
| Minimum Temperature |
tmin 1-12 | ||
| Maximum Temperature |
tmax 1-12 | WorldClim 2.1: (Fick, S. E. and R.J. Hijmans, 2017) |
~1km |
| Average Temperature |
tavg 1-12 | WorldClim 2.1: (Fick, S. E. and R.J. Hijmans, 2017) |
~1km |
| Precipitation | prec 1-12 | WorldClim 2.1: (Fick, S.E. and R.J. Hijmans, 2017) |
~1km |
| Edaphic | |||
| Topography | Digital Elevation Model (DEM) Slope Aspect |
SRTM, https://www2.jpl.nasa.gov/ srtm/ Derived from DEM |
30m 30M |
| Soil Chemical Properties |
Nitrogen (cg/kg) pH Soil Organic Carbon (dg/kg) |
Soilgrid.org (Hengl et al., 2017) | 250m |
| Soil Physical Properties |
Sand (g/kg) Silt (g/kg) Coarse Fragments (cm3/dm3) Bulk Density (cg/cm3) |
Soilgrid.org (Hengl et al., 2017) | 250m |
Data preparation
To fully assess natural resource change drivers in the study area, 12 land cover classes (Nuwarinda et al., 2021) that were reclassified from SANLC 72 classes data set were used in this analysis including; indigenous forests; thicket/dense bush; natural woodland; shrubland; grassland; water bodies; and wetlands, barren land, cultivated commercial, built-up residential and mines (Nuwarinda et al., 2021). This data was reclassified to create a natural resource change map (Figure 3) with 12 classes indicating transformation and non-transformation natural resources. The 12 natural resource classes were further reclassified to only 2 classes, where the value of 1 was given to natural resources that changed (transformed) and 0 to natural resources that never changed (no transformation). The study applied logistic regression, a multivariate analysis model that employs the use of independent variables to predict the probability of a dichotomous event such as 1 = change and 0 = no change.
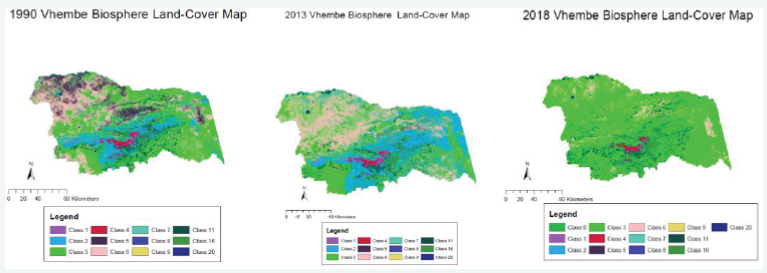
Figure 3: Land cover natural resources status maps of Vhembe biosphere.
A set of bioclimatic dependent variables were generated and run in a statistical software R-studio for regression analysis. The variables were selected based on their representation of the process believed to be natural resource drivers in the study area.
According to correlation analysis in this study, the correlation coefficient between dependent and independent variables is ranked from the highest to the lowest variable. The results indicate that average temperature (tavg) and minimum temperature are the main drivers of the natural resource change in the Vhembe district. Of all significant variables, tavg4 (6.02) is the highest correlated variable followed by tavg6, tavg10, and tavg5. Other environmental variables with negative estimates in the model are considered to have contributed negatively to the model.
From the results obtained, high average temperature and minimum temperatures registered from 1990 to 2018 in the study area were determined significantly to drive shrubland natural resources in the study area. For example, shrubland reduced in total area from 17% in 1990 to 6% in 2013 and 0% in 2018. This is attributed to the rise in temperature in the study area leading to; (i) shrubs drying off consistently, (ii) encroachment of man to harvest shrubs as firewood for space heating and domestic use leading to bare soils that were easily eroded by rains during the rainy season. High average temperatures registered in the study area that contributed to the drying of shrubs can be assumed to have later contributed to the occurrence of wildfires that destroyed shrubland.
The transformation of Thicket/Dense Bush natural resource to Natural Wooded Land was also recorded in 2013 (20% to 26%) and 2018 (2% to 21%) and indicated by a structural gradient in woody vegetation from open woodland to closed woodland and then to a forest. Important to note is that these two classes are adjacent to one another in the natural vegetation resource distribution table (Table 1). However, from a natural resource perspective, the change was seen as an improvement in the original data of 1990 and 2013/14 classification.
Generation of points
Points were generated using the space of 500m and 1000m and we eventually used the 500m to reduce the effect of spatial auto-correlation. The regression model used is useful for situations that predict the presence or absence of characteristics. The study used logistic regression using R studio wherein the model, probabilities were between 0 and 1, and only significant variables were used to develop the model. In the model, the calculation of R2 indicates the fitness of the model and its value in logistic regression of the binary response variable. For a very good fit of a logistic regression model, R2 should have values between 0.2 and 0.4, Z- values are the regression coefficient divided by the standard error. If the value is too big in magnitude, it indicates that the corresponding true regression coefficient is not 0, and the corresponding X-variable matters.
The P-value for each term tests the null hypothesis that the coefficient is equal to zero (no effect) [85,86,18]. A low P-value (<0.05) indicates that you can reject the null hypothesis [87,88]. The P-value is used to determine which terms to keep in the regression model [59,18]. If the P-value is less than or equal to the significant level, it can be concluded that there is a statistically significant association between the response variable and the term [89,85]. If the P-value is greater than the significance level, it cannot be concluded that there is a statistically significant association between the response variable and the term [89,86]. The model may be fitted without the term. If there are multiple predictors without a statistically significant association with the response, the model must be reduced by removing terms, one at a time [85,86].
Logistic Regression to determine drivers of natural resource change
Logistic regression analysis was used to determine drivers of change (dependent variables) with a set of independent variables such as climatic temperatures, topography, edaphic factors in the study area. Data were randomly split into 70% calibration and 30% validation. The advantage of using logistic regression as indicated by Mousavi et al 2011, is that; despite making an appropriate link function to the usual linear regression models, logistic regression does not assume linearity between the independent and dependent variable and does not assume variables having equal statistical variances [59]; In our study, logistical regression was used to analyse natural resource change drivers as the outcomes variable ‘natural resource change;’ had two categories where 1 (dependent variable) indicated change detected and 0 (independent variable) indicated no changed detected, this assisted in data description and explanation of the relationship between one dependent variable driver and the independent variables. The data mining analysis package “Rattle” [90] was run in a stepwise process within an R-statistical and programming software implemented in R-studio.
Validation of the logistic regression model.
To indicate the effectiveness and soundness of the model we used 30% of that data to validate the model using the AUC (Area Under the Curve) ROC (Receiver Operating Characteristics) curve [91,86]. The coefficient of variation (R2) and area-under the-curve (AUC) was used as indicators of the performance of the logistic regression [92,29]. AUC is a most used indicator for accuracy assessment for probability modelling results [93,94], with 0 and 1 signifying poor and good performance of the models [94]. The ROC curve has been recommended because it summarises model performance [91,94] overall conditions
a model could operate in [91,35,36], using all the information provided by the predictive model [97], and valid as a single threshold independent measurement of model performance [98],. The real value of AUC is that it provides a measure of the degree to which a species is restricted to be a part of the variation range of the modelled predictors [96] so that presences can be told apart from absences [96,99].(Figure 2)
RESULTS
Descriptive statistics for all the variables
In this study, we used long-term climatic elements of minimum temperature, maximum temperature, average temperature, and precipitation to determine their contribution to vegetation cover changes in the study area. Historical daily, monthly, and annual precipitation totals, and temperatures observed in Vhembe Biosphere were used between 1990 and 2018. Descriptive statistics were used to analyse the mean, standard error, minimum and maximum temperatures, and precipitation, where the confidence level of 85% of variables was determined.
Summary of land cover changes
According to Nuwarinda et al., 2021, natural resource change assessment based on the land cover change in the study area, for 1990 and 2013, indicated that, in 1990, grassland natural resource a dominant land cover in the Vhembe biosphere (Figure 3); with a total land cover area of 562,136.5 (ha), decreased to 64,506.6 (ha) in 2013 an equivalent of -89% change in natural resource area coverage (Nuwarinda et al., 2021). The study also noted that; thicket/dense bush and shrubland resources decreased from 338,723.7(ha) and 263,070.6 (ha) in 1990 to 63,569.34 (ha) and 19,685.43(ha) in 2013 at -81% and -93% change respectively (Nuwarinda et al., 2021). It is further noted in the study that; during the 2013-year, thicket dense bush natural resources decreased from 63,569.34 hectares to 23,166.92 hectares in 2018, a -6% decrease (Nuwarinda et al., 2021). This was followed by shrubland that decreased from 19,685.43 hectares to 977.72 hectares with a percentage change of -9%. While cultivated commercial area increased from 10,846.8 hectares in 2013 to 365,644.9 hectares in 2018 with a percentage change of 294%; the built-up area from 9,220.4 hectares in 2013 to 147,709.9 hectares in 2018 with a percentage change increase
of 135% respectively (Nuwarinda et al., 2021).
The study concluded that the observed changes in natural resources were largely attribute to the encroachment of man’s activities on vegetation cover resources like the building of residential areas, commercial farming as a means of meeting developmental and associated requirements in the study area, and non-anthropogenic factors like fluctuations in climate and temperature. (Figure 3)
What are the drivers of change using environmental variables?
A set of bioclimatic dependent variables were generated and run in a statistical software R-studio for regression analysis. We used all the variables in Table 1 using stepwise logistic regression to arrive at the data used in Table 2.
All the variables in the Table 2 were significant as they were the major drivers of natural resource change in the study area. The variables were selected based on their representation of the process believed to be natural resource drivers in the study area.
Results indicate that average temperature (tavg) and minimum temperature are the main drivers of the natural resource change in the Vhembe district. Of all significant variables, tavg4 (6.02) is the highest correlated variable followed by tavg6, tavg10, and tavg5. Other environmental variables with negative estimates in the model are considered to have contributed negatively to the model.
Logistic regression was done using R-studio with a list of significant environmental variables (Table 2) as derived from [78,79]. The list of variables used to explain natural resource change using stepwise logistic regression to arrive at the data used is presented in Table 2. (Table 3)
To test the accuracy of the model’s binary classifier, a receiver operating characteristic accuracy curve (ROC curve) was generated (Figure 4). Because of the high accuracy level of the ROC curve, it indicates that there was a significant change in natural resources in the study area. The overall performance of the model is measured by the ROC curve (Area under the curve). In our study, the performance of the model based on independent data sets was 0.85%. Based on the information used, 70% of the points were used for calibration, and 30% of the points were used for validation. ROC at 0 indicates that the model is weak
and at 1, it indicates that the Model is good (at AUC=0.85 signifies the quantity of loss which in this case, indicates high estimates of natural resource loss). (Figure 4)
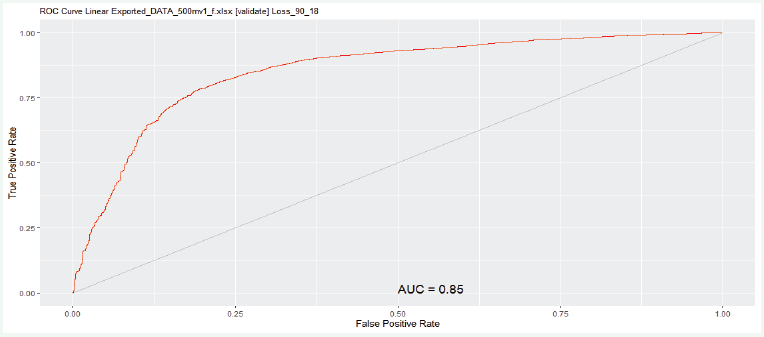
Figure 4: ROC Curve.
DISCUSSION
Variation in bioclimatic factors has the potential to drive every type of vegetation cover resource in any given environment at any given time. The distributions of vegetation cover resources will continue to shift as rising temperatures, rainfall variation, change in altitude, and soil properties continue to alter our natural ecosystems and intensify the already existing environmental concerns. Rising temperatures have the potential to affect every type of vegetation cover resources, their distribution, alter natural ecosystems, and amplify the existing environmental concerns. The impact of temperature fluctuations in any given ecosystem will include a shift of vegetation cover types and associated impacts on biodiversity, change in forest density and agricultural production, expansion of arid land, and relocations of populations.
Average temperatures recorded during the study period in Vhembe Biosphere seem to have contributed to the vegetation cover shift. Based on incremental high average temperatures recorded from 1990 to 2018, a significant reduction of shrubland vegetation cover resources to grassland natural resources was observed in the study area. This is further compounded by the advancement of barren lands in the area that was predominantly shrubland. Temperature variations also have the potential to increase the risks of drought, forest fires, and invasive species which are additional drivers and stressors to vegetation cover
resources in a given biosphere, and this is evident as a case in the Vhembe biosphere. Furthermore, temperature variations have the potential to influence precipitation wherein our study; lower average precipitation was recorded during the study period in the study area. High average temperatures and lower precipitation are assumed to have practically contributed to the transition of thicket/dense bush to natural woodland between 1990 to 2013 and 1990 to 2018. This is evidenced from the observed results obtained where high average temperature and minimum temperatures registered from 1990 to 2018 determined significantly to drive shrubland natural resources in the study area. For example, shrubland reduced in total area from 17% in 1990 to 6% in 2013 and 0% in 2018. This is attributed to the rise in temperature in the study area leading to; (i) shrubs drying off consistently, (ii) encroachment of man to harvest shrubs as firewood for space heating and domestic use leading to bare soils that were easily eroded by rains during the rainy season. High average temperatures registered in the study area that contributed to the drying of shrubs can be assumed to have later contributed to the occurrence of wildfires that destroyed shrubland.
Based on bioclimatic variables assessed, precipitation/rainfall variations in the study area show significant fluctuation during the study period. Compounded by unpredictable estimates of precipitation (Prec: 1 and Prec: 2) of the wettest, month, the driest month, and wettest quarters. Fluctuations in precipitation/rainfall regimes could have led to; (i) transformation/shift from indigenous forest to thicket/dense bush, (ii) barren land to the cultivated commercial and built-up residential area in the study area. The transformation of thicket/dense bush vegetation cover to natural wooded land was also recorded in 2013 (20% to 26%) and 2018 (2% to 21%) and indicated by a structural gradient in
woody vegetation cover from open woodland to closed woodland and then to the forest. Important to note is that these two classes are adjacent to one another in the natural vegetation resource distribution table (Table 1). However, from a natural resource perspective, the transformation was seen as an improvement in the original data of 1990 and 2013/14 classification.
The most interesting broad transformation to be detected was shrubland vegetation resource moving to grassland vegetation resource in the study area: 17% to 37% in 1990, 6% to 20% in 2013, and 0% to 27% in 2018. The major driving factors for the recorded driver were attributed to the average rainfall (precipitation) recorded in the study area. From further analysis, barren land reduced significantly from 6% in 2013 to
2% in 2018, this was attributed to man’s activities like building up of residential areas which are indicated by the increase in built-up residential from 5% in 1990 to 12% in 2018. There was an increase of cultivated commercial area from 9% in 1990 to 30 % in 2018 which could be attributed to consistent average rainfall registered in the study area for the period of study. This is confirmed by analysis of the digital natural resource change map where the original land cover characteristics of 1990 and 2018 can be determined.
From the vegetation cover resource distribution in the study area, it was also observed based on the rate at which natural vegetation cover transformed from one class to another; other factors also contributed to such a shift, including, agriculture expansion with overexploitation of vegetation based natural resources for potential economic purposes including commercial farming and urban development. Of importance to note is that the edaphic that were analysed in this study, like elevation, slope, soil properties, type, classes, and chemical composition did not contribute to the transformation of any vegetation cover class to another.
CONCLUSIONS
The impacts of temperatures and rainfall variations on vegetation cover resources vary widely, and can also be compounded by other factors. As temperatures rise, the distribution and composition of vegetation cover resources will continue to shift and transit from one class to another. Practically, based on the assessment results, indigenous forests transformed to thicket/dense bush, shrubland to grassland. However,
this transformation is not only affected by temperatures and precipitation but also other contributing factors isothermally, soil organic stock, and soil alkalinity. Vegetation cover resource management in the Vhembe biosphere will need a detailed natural resource management strategy as impact identified drivers continue to increase in the study area.
ACKNOWLEDGMENTS
The author wish acknowledge the contribution of Azwifaneli Davhula from OMPHA Environmental GIS for his support and advice in data analysis.
REFERENCES
2. Gaitan JJ, Oliva EG, Bran ED, Maestre FT, Aguiar MR, Jobbagy EG, et al. Vegetation structure as important as climate for explaining ecosystem function across Patagonia rangelands. J Ecol. 2014; 102: 1419-1428.
6. Begon M, Howorth RW. Townsend CR. Essentials of Ecology. 4th edn. Wiley, Cambridge, UK. 2014.
38. Barger NN, Gardner TA, Sankaran M, Belnap J, Broadhurst L, Brochier V, et al. Direct and indirect drivers of land degradation and restoration. In: Montanarella L, Scholes R, Brainich A, editors. The IPBES assessment report on land degradation and restoration. Bonn: Secretariat of the Intergovernmental Science-Policy Platform on Biodiversity and Ecosystem Services. 2018; 198–314.
42. FAO. Global Forest Resources Assessment. Main report. FAO Forestry 163. Rome. 2010.
45. Nelson GC, Bennett E, Berhe AA, Cassman KG, DeFries R, Dietz T, et al. Drivers of change in ecosystem condition and services. Ecosystems and Human Well-being: Scenarios. (eds S.R.Carpenter, P.L. Pingali, E. Bennett, & M. Zurek). Island Press, Washington DC, USA. 2005; 173–222.
46. MA (Millennium Ecosystem Assessment). 2005. Ecosystems and Wellbeing: biodiversity synthesis. World Resources Institute, Washington DC. USA. 86
47. Cardinale B, J Duffy E, Gonzalez A, Hooper D. Biodiversity loss and its impact on humanity. Nature. 2012; 486: 59-67.
52. IPBES (2018): The IPBES regional assessment report on biodiversity and ecosystem services for Africa. Archer, E. Dziba, L., Mulongoy, K. J., Maoela, M. A., and Walters, M. (eds.). Publisher: Secretariat of the Intergovernmental Science-Policy Platform on Biodiversity and Ecosystem Services, Bonn, Germany.
54. Pimm S, Raven P. Extinction by numbers. Nature. 2000; 403: 843-845.
66. Mucina L, Jurgens N, le Roux A, Rutherford MC, Schmiedel U, Esler KJ, et al. (2006c). Succulent Karoo Biome. In: Mucina, L. and Rutherford, M.C. (eds). The Vegetation of South Africa, Lesotho, and Swaziland. Strelitzia 19. South African National Biodiversity Institute, Pretoria.
68. Dombo L, Crafford J, Fouche P, Gaigher I, Hahn N, Linden J, et al. The Biosphere Reserve Nomination to the United Nations Educational Scientific and Cultural Organisation (UNESCO) Man and the Biosphere (MaB) Programme. Limpopo Province Department of Economic Development. Republic of South Africa: Environment and Tourism. 2006.
72. Kabanda TA. Climatology of Long term drought in the Northern region of the Limpopo Province of South Africa. Unpublished Ph.D. thesis. The University of Venda. 2004.
73. Kabanda TA, Munyati C. Anthropogenic-induced climate change and the resulting tendency towards land conflict; the case study of the Soutpansberg region, South Africa. In A. Mwiturubani and J van Wyk (eds). Climate change and Natural Resources Conflicts in Africa. Monograph No. 170, Institute for Security Studies. 2010.
78. Sluiter R. Interpolation methods for climate data. 2009.
81. Rajakaruna N, Boyd RS. Edaphic Factor. In S. E. Jørgensen, B. D. Fath (Ed). Encyclopaedia of Ecology. Academic Press. 2008; 1201-1207.
87. Favero LP, Belfiore P. Simple and Multiple Regression Models. In L.PFavero and P Belfiore (Ed), Data Science for Business and Decision Making Academic Press. 2019; 443-438.
88. Alam, U. Primer of Biostatistics. Yale J Biol Med. 2012; 85: 432–433.
89. Ferreira JC, Patino CM. What does the p value really mean?. J Bras Pneumol. 2015; 41: 485-485.
91. Graham JW. Rattle: A Data Mining GUI for R. The R Journal. 2009; 1: 45-55.
96. Swets JA. Measuring the accuracy of diagnostic systems. Science. 1988; 240: 1285-1293.
97. Mohamed B, Hassiba D, Alitouche TA. Evaluation measures for models assessment over imbalanced data sets. Rev Inf Eng Appl. 2013; 3: 27-38.


