Modelization of Atmospheric Pollution to Green House Gases CO2 of Arzew Industrial Pole
- 1. Department of Safety and Environment, Sonatrach Arzew, Algeria
- 2. Laboratory of Environmental Science and Material Studies, Oran 1-Ahmed Benbella, Algeria
- 3. Department of Biotechnology and Industrial Safety Engineer, Sonatrach Arzew, Algeria
Abstract
Algeria, a Mediterranean country closer to Europe participates and covers a certain part of the world energy demand through its natural gas and petroleum poles among which Arzew industrial pole. The present paper focuses on the quantitative and qualitative evaluation of the atmospheric pollution issued from petroleum and petrochemical activities since 1963. The evaluations allowed modeling the pollution using Areal Locations of Hazardous Atmospheres (ALOA) code. In this regards, a carbon atoms balance analysis has been carried out for the carbon and nitrogen at the input and output of plants of Liquefied Natural Gas (GNL) , Liquefied Petrol Gas (LPG), Ammonia, Methanol, industrial Electricity and Water as well as the energy used for the transformation of these products. The elements used for this evaluation were the quality certificate of gas, final products and the exploitation of the recorded gas flow rates and products. The results obtained were converted to equivalent carbon dioxide, carbon monoxide gas (CO2) with an oxidation factor of 0.995. This has allowed plotting the atmospheric emissions curves of CO2 since 1963 up to 2015, with an extrapolation up to 2035 by integrating the new projects in the zone under consideration and taking into account the likelihood evolution of the world energy demand. It is worthy of note that it is impossible to accurately evaluate the emission of Green House Gases (GHG) by equipments such as furnaces, boilers, torches because of the variation of the flow rates, chemical composition and gas combustion colorific capability of the equipment. Thus a global analysis input-output is made for each production plant. The resulting deviation from these two analyses represents the total emission of Gas CO2. The present work has been modeled by simulations using ALOA software code.
Keywords
• Environment
• Air
• Atmospheric pollution
• Climatology
• GHG
Citation
Tayeb A, Hamou A, Debbah S (2015) Modelization of Atmospheric Pollution to Green House Gases CO2 of Arzew Industrial Pole. JSM Environ Sci Ecol 3(1): 1015.
INTRODUCTION
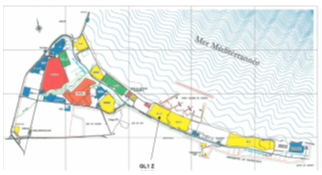
Figure 1: Arzew industrial zone.
The risks of climate change have been considerably discussed during these last decades [1,2]. The majority of scientists of all disciplines are convinced that this phenomenon is linked to Green House Gases (GHG). A global politics has been adopted by the states aiming to stabilizing the GHG emissions [3,4], followed by the ratification of Kyoto protocol for contending these emissions with the objective of 5.2% reduction of six GHG between 2008 and 2012 [5,6].
Such atmospheric emissions generate a variety of polluting factors in the immediate natural neighborhood of des industrial pole under investigation. furthermore, since a proportion of these pollutants are transported, to certain distance [7], bay the wind movement the contaminated natural space becomes evidently more large witch necessarily worsens the pollution problem. The epidemiologic and toxicological studies affirm that the atmospheric pollution presents higher hygienic risks [8,9]. As consequence, there exists a direct relationship between the over mortality and the fluctuations of pollutant ratios [10].
Determination of the study zone
The Arzew industrial platform covers an area of 2500 hectare (ha) where 935 ha are used for production plants and services. More than 900 ha are reserved for petrochemical industry and 400 ha are reserved for technical ways for canalization and passage of cables between the plants as well as between the plants and gaseous and petroleum gates. The platform has a number of gas liquefaction, refinery and petrochemical complex susceptible to generate atmospheric emissions. It also contains storage infrastructures for petroleum products (LNG, LPG, methanol, fuel, condensate...) localized in the different production plants. The industrial zone is characterized by an important number of atmospheric rejection waste points.
The main sources of atmospheric pollution are the industrial emissions of carbon dioxide (CO2 ) and nitrogen oxide (NOX) which is precursor of ozone (O3 ) and nitric acid (HNO3 ).
Qualitative evaluation of the green house gases (GHG)
- The observations and appreciations made on the GHG - CO2 quality had been carried out by following up the composition of rejected gases at some representative emission points present in the industrial zone.
- Since 2005 a follow up of these emissions has been made at some combustion towers, gas turbines exhausts, at some boilers chimneys and furnaces.
- This qualitative study has allowed noticing a greater instability of the chemical composition of the rejected gases to the atmosphere.
Quantitative evaluation of the green house gases (GHG)
In this study a quantitative and qualitative evaluation analysis is made on the atmospheric pollution of CO2 Gas generated by the industrial plants of Arzew industrial pole. The following points are developed:
1. Qualitative evaluation of fumes released by Ammonia, methanol, LNG and LPG production plants.
2. Quantitative evaluation of CO2 generated by all the plants of Arzew industrial pole since 1963 up to 2035.
3. Quantitative estimation and extrapolation of Gas CO2 up to 2035.
4. Modeling atmospheric pollution of Gas CO2 2030-2035.
5. Conclusion and recommendations.
The quantitative estimation of Gas CO2 emissions has been obtained. The method consists in the exploitation of the production loss opportunity and the lost energy of petroleum units with respect to the design process. The Self Consumption (SC) is an indicator of atmospheric pollution. This ratio is converted into the load gas. The SC is the difference between the input thermals and output thermals with respect to the input thermal energy. It is usually quantified by the self consumption coefficient which expresses the ratio of consumes thermals to input thermals. The self consumption is expressed by the following formula:
E: Energy input in thermal unit; S: Energy output in thermal unit; AC: Self Consumption of the complex.
The increase of SC is a consequence of the increase of torch and combustion gases due to the instable production, leftover, the starting of production units, to the over consumption of high pressure vapor, to electricity, gas leaks, cooling loops, corked cryogenic circuits and bad control and regulation. All these factors favor the increasing of AC which is the consequence to increasing GHG emissions. For the estimation of CO2 rejection, the case of the GL2Z plant is treated for 2009.
The present study will be make by applying a suitable method which was established in the context of French regulation system elaborated in March 31st, 2008 relevant to the verification and quantification process of declared emission of the case the CO2 quota exchange, observed during the period 2008-2012 [11,12].
The CO2 emissions are calculated from the quantity of burned gases at the tower [Nm3 ] and from their carbon concentration (inherent CO2 included) according to the following formula: CO2 emissions = Data activities x EF x OF. With: Data activities Quantity of burned gas= 32617045 Nm3 /month (average value from January 2008 to October 2009). EF: emission factor = tCO2 / Nm3 of torched gas.
Due to the lack of particular data of the sites, we will retain the emission factors given in the order: Type H gas: 2.14 10-3 tCO2 /m3 ; Type L gas: 1.82 10-3 tCO2 . The average composition is a little closer to a type of gas L. As a first approach, if more accurate data is used an average emission factor of 1.98 tCO2 10-3 / m3 . OF = Oxidation Factor = 0.995.
To facilitate the study, a specific computational code has been elaborated for each production unit of LNG, LPG, Ammonia, Methanol and electrical energy production [13]. In this conducted study, a computational code is developed on the background of materials balance for each investigated process as illustrated in figures 2 and 3 [14-20].
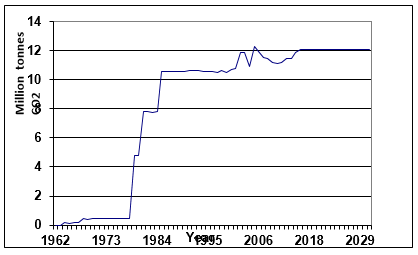
Figure 2: Quantitative evaluation of CO2 emissions at Arzew pole 1962-2030
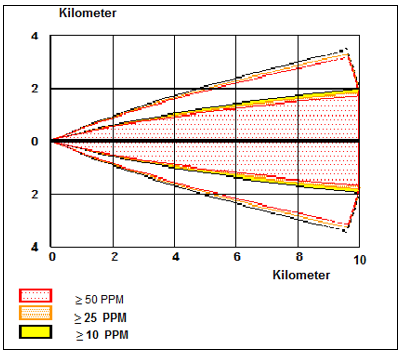
Figure 3: Projections of CO2 gases released by all the hydrocarbon and petrochemical units 2030-2035
The results obtained are shown in figures 2.
RESULTS AND DISCUSSION
The Figure 2 show the quantitative amounts of Gas CO2 rejected from all the petroleum and petrochemical plants of Arzew industrial pole. The figures show the increase of atmospheric pollution since 1963. It can be observed five stages of atmospheric pollution: Before 1963 there was absence of any industrial activity. There existed only a fish harbor and agricultural and animal breeding activities. The only source of atmospheric pollution was generated by domestic heating using woods and burning of domestic wastes which generated modest CO2 emissions.
Industrial emissions of Arzew pole shown in Figure 2 are in growth since 1963, of which there are five stages. The first bearing [1963-1968] shows that the average annual quantities of CO2 gas emission is about 0.45 million tons of CO2 , the second bearing [1969 - 1978] the amount increased to 4.7 Million tons of CO2 per year for the third level [1979-1985] throughput reached 7.3 million tons of CO2 per year, the fourth tier [1986 and 2013] annual rates oscillated between 10 and 11 million tones of CO2 per year. The final level for future emissions will exceed 12 million tons per year.
Modeling of atmospheric pollution
In this important step of this field study, modeling attempts of pollution are carried out. In this simulation the meteorological data of Arzew zone were taken into consideration for the period 2030-2035. In this period the annual average emissions of GHG were of the order of 12.4 Million tones of CO2 see Figure3 [22].
The obtained results given in Figure 3 show the following: A toxicity of CO2 with the following concentrations:
50 ppm scattered on an area of 10 km in length and 3.8 km in width, 25 ppm at a distance of 10 km and width of 3.9 km and 10 ppm with a width of 4 Km.
District: 13609 habitants with a sensible population of 1536 [23,24].
CONCLUSION
1. Greenhouse gas (GHG) emissions of CO2 emitted by all Arzew Pole industries are the order of millions of tons per year.
2. The carbon dioxide diluted in the fumes of boilers, furnaces and gas turbines is not a subject for recuperation.
3. Some production units, which has de carbonation section, reject pure CO2 to the atmosphere
4. The burned gases in torches, at all industrial plants are not energetically valorized.
5. Lack of renewable energy sources due to the higher exploitation costs.
6. Arzew platform is not covered by a network of air quality measure.
RECOMMENDATIONS
From this investigation the following recommendations are made:
1. Review of the energy strategy by opting for two renewable energy sources “solar” currently at higher cost with a conventional low cost energy source “petroleum and natural gas”. Inspiration from economical models for long term to regulating these emissions [25].
2. Investment in energetic valorization of torch gases before their combustion. Such as the installation of small gas turbines having as fuel the torch gases or their reinjection into the plant loading gas.
3. Evaluation of the global environmental impact of the industrial zone.
4. Predict in line counters and analyzers ahead of torches.
5. Arzew platform is not covered by a network of air quality measure [26,27].
6. Installation of CO2 collectors. It is worth mentioning that certain plants are equipped with decarbonation stations required for their functioning such as the production process of LNG and Ammonia. These units purify their loading gas by eliminating for the atmosphere pure CO2 . It is recommended to install a CO2 collector for emissions from the decarbonation stations. The plants concerned with LNG, Ammonia plate.
REFERENCES
- Simulator ALOHA: Areal Locations of Hazardous Atmospheres, National Oceanic and atmospheric Administration Office of Response and Restoration Emergency Response Division Seattle, Washington, December 2004.
- Barthelemy B, Courèges P. Risk management: Global optimization method, organization Press, 2nd ed. 2004.
- Tialdi D. Sustainable Development in international Law: An Analysis of Key Environmental Economic instrument. 22-27.
- André J. Hertig, of environmental impact studies civil engineering Treaty Federal Institute of Technology Lausanne. 2006; 23: 27.
- Mariotte M. Central Europe and the Kyoto Protocol on climate change, what benefit perspective. Chapter 2, 25-46.
- Pitoun Y. Inventory of regulations relating to air, technical engineering, environmental treaty GR520. 2.
- Levalois P, Pierre Lajoie. Air pollution and electromagnetic fields, presses Laval University. 1997; 7-8.
- Elichegaray C. Article: The ambient air pollution in France, sources, surveillance, preventive effects and main measures. Francophone review Laboratories. 2006; 27.
- Host S. Exposure to air pollution near traffic-related: some methods for which health risks. Journal of Epidemiology and Public Health. 2012; 60: 321-330.
- Eilstein D. Prolonged exposure to air pollution and mortality from respiratory diseases. French Journal of Allergology. 2010; 50: 51-61.
- Official Journal of the French Republic, French Decree of 31 March 2008 on the verification and quantification of emissions reported under the gas emission allowance trading system of greenhouse gases for the period. 2008 -2012.
- De Gerando B. Energies - Climate, emissions allowances of greenhouse gases: emissions trading system companies bénificiares communities and quota management tools. Editions Lamy. 2010.
- Lefebvre G. Chimie des hydrocarbures. Publication de l’institut français du pétrole, cours de l’école nationale supérieure du pétrole et des moteurs, Technip 1978.
- Simulator ALOHA: Areal Locations of Hazardous Atmospheres, National Oceanic And atmospheric Administration Office of Response and Restoration Emergency Response Division Seattle, Washington, December 2004.
- JM Lacome, G. Vincent, A. Baulig, MA Kordek, F. Fontaine, S. Tissot. INERIS - DRA No. 46053 - evaluation_aloha_46053.doc. Study Report INERIS DRA - 11-2006, No. 46053, Examination of the use of CAMEO software ALOHA emergency.
- Wolfgang Foerg, Wilfred Bach, Rudolf Stockman, Roy Scott Heiersted, Pentti Paurola, Arne Olav Fredheim, et al. A new LNG baseload process and the manufacturing of the main heat exchangers.
- IMO, Specialized Training for Liquefied Gas. Revised edition 1999 by the International Maritime Organization, IMO bublishing. 1999; 84-85.
- Sana H. Memory magister thesis. Modalization and optimization of Algerian LNG Downstream channels. IPA Boumerdes University, Faculty of hydrocarbons, Algeria, 2008.
- Rojey A, Durant B. Natural Gas, OPHRYS Publishing. 1994; 253-256.
- Rabah A. State doctoral thesis: Study, analysis and simulation of the primary reforming (Four of Industry Ammonia). Mentouri University, Constantine, Faculty of engineering, environmental engineering department. 2006; 253-256.
- Best Available Techniques for Pollution Prevention and Control in the European Fertilizer Industry Booklet No. 1 of 8: production of ammonia 2000 EFMA. 2000; 7- 18.
- Mercier C. Petrochemical industry and its potential implementation in developing countries, TECHNIP. 1966; 87-90.
- Given base "Climatologically Centre National"; they come from the Arzew station whose coordinates are: Latitude: 35 ° 49'N Longitude: 00 ° 16'W Elevation.
- Department of Planning and Development Territory (DPAT) 2007
- Department of Planning and Development Territory (DPAT)) - School year 2007-2008.
- Magne B, Moreaux M. A Hotelling model with a ceiling on the stock of pollution. J Economic Dynamics & Control. 2006; 30: 2875-2904.
- Morcheoine A working group, Guivarch A, Thieleke R, Delmas V, Lameloise P, Renaudot C, et al. ADEME Agency for Environment and energy management Directorate Air and Air Transport Department document "Classification criteria and implementation of quality monitoring stations of the Air". 2002.
- Pascale BP, Yann S. The zoning in urban area in 1999 INSEE first No. 765 in April 2001.


