On The Influence of Greenhouse Gases Emission on Global Warming
- 1. Department of Fundamental Research in Energy Engineering, AGH University of Krakow, Poland
- 2. Department of Mechanical Engineering and Science Shibaura Institute of Technology, Japan
Abstract
The paper presents a new approach to the anthropogenic global warming hypothesis compared to the commonly discussed and accepted theories based on the influence of increasing emission of greenhouse gases mainly carbon dioxide, methane nitrous oxide and water vapour - into our environment. The presented interpretation of the global warming phenomenon is based on an analysis of radiation properties, mainly absorptivity, of greenhouse gases and their influence on the intensity of heat transfer within the atmospheric gas layer. It is proven that an increase in actual greenhouse gases concentration does not play a substantial role in the global warming of the tropospheric air layer.
Keywords
• Global Warming
• Radiation Heat Transfer Analysis
• Greenhouse Gases
CITATION
Kolenda Z, Donizak J, Takasaki A, Szmyd J (2024) On The Influence of Greenhouse Gases Emission on Global Warming. JSM Environ Sci Ecol 12(2): 1094.
INTRODUCTION
“Warming of the climate system is unequivocal, as evidenced by observations of rising global average air and ocean temperatures, widespread melting of snow and ice and rising sea levels worldwide. Most of the observed increase in globally averaged temperatures since the mid-20th century is very likely due to the observed increase in anthropogenic greenhouse gas concentrations” [1].
“Human activities, principally through emission of greenhouse gases, have univocally caused global warming (…) Global greenhouse gas emissions have continued to increase (…) larges share and growth in gross CHG emissions occurring in CO2 from fossil fuels combustion and industrial processes” [2].
“The models predictions are wrong; the greenhouse effect debate is largely artificial without tangible proof. The greenhouse effect is not the cause of recent climate change, but only one of its possible components, and its proper climatic role in the recent past and future remains to be determined” [3].
The widely accepted opinion that the global warming phenomenon has been scientifically proven is represented by an influential group of members of the Intergovernmental Panel on Climate Change (IPCC) established in 1988 by the World Meteorological Organization under the auspices of the United Nations. The main conclusions of the IPCC are [4].
- warming of the climate system is unequivocal,
- well-mixed GHGs are the main drivers of atmospheric air temperature,
- there is more than a 95 percent probability that human- produced greenhouse gases such as carbon dioxide, methane and nitrous oxide have caused much of the observed increase in the Earth’s temperature over the past 50 years,
- warming from anthropogenic emissions from pre- industrial times to the present will persist for centuries to millennia and will continue to cause further long-term changes in the climate system,
- Climate-related risk to health, livelihoods, food security, water supply, human security and economic growth is projected to increase with global warming.
- The IPCC statement is also supported by many international scientific organisations [5], the Earth’s climate is changing in response to increasing concentrations of Greenhouse Gases (GHGs) and particulate matter in the atmosphere, primarily due to human activity (American Chemical Society, 2016- 2019), based on extensive scientific evidence, it is highly likely that human activities, especially greenhouse gas emissions, are the dominant cause of the observed warming. There is no alternative explanation supported by convincing evidence (American Geophysical Union, 2019),
- scientists have known for some time, from multiple lines of evidence, that humans are changing Earth’s climate, primarily through greenhouse gas emissions (U.S. National Academy of Sciences),
- Observations worldwide make it clear that climate change is occurring, and rigorous scientific research demonstrates that the greenhouse gases emitted by human activities are the primary driver (Statement on Climate Change from 18 Scientific Associations, 2009).
The Nongovernmental International Panel on Climate Change (NIPCC) was established in 2003 by a small group of U.S. and European scientists in Milan at a frequent U.N. climate conference. The NIPCC project was conceived and directed by S. Fred Singer, professor emeritus of experimental sciences at the University of Virginia. NIPCC presented a different assessment of anthropogenic warming in its Report Nature, not Human Activity Rules the Climate [6]. Their main conclusions concern the following problems:
• Humankind’s greenhouse gas contribution to current warming is insignificant; observed temperature patterns disagree sharply with those calculated from climate models,
• carbon dioxide is not causing significant global warming, the claim that carbon dioxide emission gives rise to anthropogenic climate changes has no physical basis, empirical evidence strongly suggests that the main case of warming or cooling on a decadal scale derives from solar activity modulating cosmic rays, which affect atmospheric cloudiness.
Doubts about the influence of greenhouse gases concentration (mainly CO2 ) on the greenhouse effect were raised by Arrhenius in a paper [7], in which he pointed to the possible impact of CO2 concentration in the atmosphere on the magnitude and variability of this effect. Arrhenius’ report is the first to quantify the carbon dioxide concentration on the greenhouse effect and speculated whether variation in its atmospheric concentration has contributed to long-term variation in climate. Arrhenius does not explicitly suggest that burning fossil fuels causes global warming. The fundamental question formulated by Arrhenius:
• Does the presence of heat-absorbing gases in the atmosphere have any effect on the average surface temperature?
HEAT TRANSFER IN THE ATMOSPHERIC AIR
The intensity of heat transfer inside the atmospheric air layer, mainly in the troposphere, is determined by infrared radiation from the Earth’s surface. Greenhouse gases such as carbon dioxide, methane, nitrous oxide, industrial hydrofluorocarbons, sulphur hexafluoride and water vapor play the most important role. Energy exchange depends on their emission-absorption properties, such as the temperature of the gases and radiation sources, the wavelength of radiation, the thickness of the gas layer and the concentration of the gas components. According to the literature [1,2,4,5] increase of these gases causes Earth’s atmosphere to warm by trapping more infrared radiation. The most crucial property responsible for heat transfer intensity is gas absorptivity. Still, an uneven distribution of the local absorptivity can play an essential role in the heterogeneous warming of the atmospheric layer, warming of oceanic water, sea-level rise, increasing the frequency and intensity of heat waves, hurricanes and other climate effects. The following analysis is simplified with assumptions that the greenhouse effect is not detectable above 5000 m, [3]. Let us consider radiation energy exchange in the gas layer as in (Figure 1) [8].
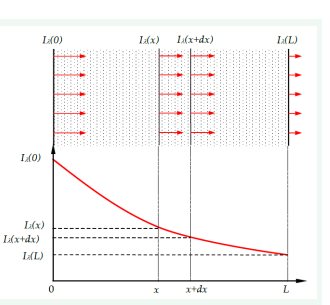
Figure 1: Energy flow through the absorbing medium.
It is known from experimental data that the change of intensity of the beam dIλ is proportional to the local intensity
(1)
Where Kλ is the concentration-dependent monochromatic extinction coefficient of the absorbing gas component. After integration across the gas layer
(2)
The fraction
Is absorbed by the gas layer of thickness L. In engineering practice, it is more convenient to work with total quantities obtained by integrating Eq (3) over the entire spectrum. It means that
(If TG ≅ TS i.e. if Kirchhoff’s law applies)
and it represents grey gas medium with monochromatic coefficients independent of wavelength and when the gas emissivity G ε is equal to gas absorptivity αG regardless of the source of incident radiation. In general form
5
Where TG is the gas temperature (tropospheric air), Pi is the partial pressure of the i-th component, L is the thickness of the gas layer, and P is the total mixture pressure. The above general equation can be simplified to
6
When the influence of temperature changes inside the gas layer is small compared to the impact of concentration changes of gas components. The justification for such a simplification is analysed in Appendix A1.
For further analysis and calculations, the Byun and Chen model [9] has been chosen based on Hotel’s experimental results [10]. For the temperature range 273 to 300 K, the grey approximation is given by the function [9]
Where a,b and c are constants. This relation allows analysis of absorptivity changes as functions of (Pi L) and Pi . After differentiation
8
and
or
10
The detailed analysis is limited to the effect of the radiative properties of carbon dioxide, water vapour and methane, as these are the gases mainly responsible for global warming. Other gases are not considered because their thermal properties (dependence of absorptivity on temperature and partial pressure) are missing from the literature.
Carbon Dioxide
Equation
11
is a grey approximation presented in (Figure 2) [9,10]. Then
![Absorptivity of CO2 vs (PCO2L) in a mixture with non-participating gases at a mixture pressure of 1 atm, [9,10].](https://www.jscimedcentral.com/public/assets/images/uploads/image-1721887097-1.PNG)
Figure 2: Absorptivity of CO2 vs (PCO2L) in a mixture with non-participating gases at a mixture pressure of 1 atm, [9,10].
12
and thus
13
and
14
The results of the calculations are presented in (Figure 3,4).
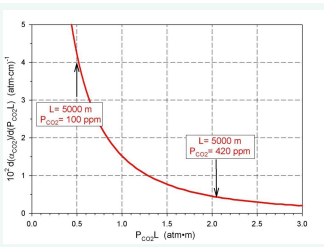
Figure 3: Relationship dα (CO2) /d (PCO2L) vs (PCO2L).
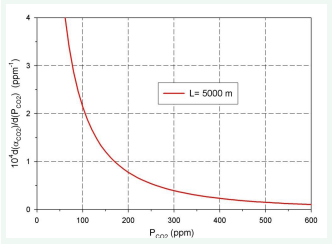
Figure 4: Relationship dα (CO2) /d (PCO2) vs (PCO2).
As can be seen, at constant air layer thickness, the total absorptivity increases as the CO2 (ppm) increases. Also, at constant CO2 , as the thickness of the air layer increases, the total absorptivity increases monotonously to the asymptotic value.
Eq. (12) allows to evaluate absorptivity changes ?αCO2 as the function of CO2 partial pressure changes
From relation
where ?PCO2 is arbitrary chosen intervals, relative ?αCO2 changes are
Assuming reference state PCO2=50 ppm and L=5000 m 2 1 ( ) P L CO =25(atm⋅cm) the values of γ are summarized in (Table 1) and presented on (Figure 5).
Table 1: Values of gas parameters as the function of PCO2
|
PCO2 ppm |
daCO 2 d (PCO 2 L) |
γ |
|
50 |
10.1 × 10⁻⁴ |
1.00 |
|
100 |
4.2 × 10⁻⁴ |
2.40 |
|
200 |
1.53 × 10⁻⁴ |
6.60 |
|
400 |
0.42 × 10⁻⁴ |
24.05 |
|
500 |
0.292 × 10⁻⁴ |
34.69 |
|
600 |
0.233 × 10⁻⁴ |
43.35 |
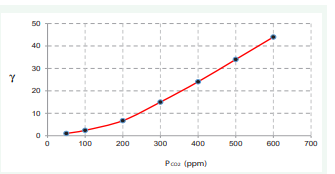
Figure 5: Values of γ vs CO2 pressure.
It means that for PCO2=420 ppm the value of γ is over 24 times greater in comparison to PCO2=50 ppm. Similar calculation can be done for concentration changes of H2 O and CH4 .
Water Vapour
Numerical data for calculation of the absorptivity as the function of PH20L have been taken from Hottel experimental data [10] for temperature 300 K and concentration range 0.005 to 0.04. The equation for absorptivity as the function of PH20L takes the form
17
and after differentiation
18
and
19
The results of the calculations are presented in (Figures 6-8).
![Absorptivity of H2 O d?H20 vs (PH2OL) in a mixture with non-participating gases at a mixture pressure of 1 atm, [9,10].](https://www.jscimedcentral.com/public/assets/images/uploads/image-1721887154-1.PNG )
Figure 6: Absorptivity of H2 O dαH20 vs (PH2OL) in a mixture with non-participating gases at a mixture pressure of 1 atm, [9,10].
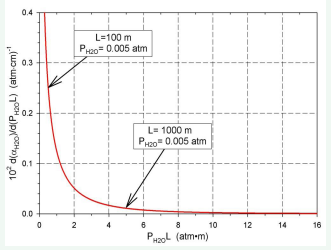
Figure 7: Relationship dαH20/d (PH2OL) vs (PH2OL)
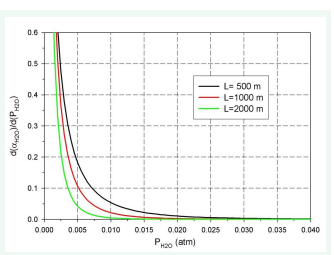
Figure 8: Relationship dαH20/d (PH2OL) vs ( PH2O)
Methane
According to Hottel’s data, the absorptivity of CH4 is described by the function
20
and after differentiation
21
22
The results of the calculations are presented in (Figure 9-11).
![Absorptivity of CH4 vs (PCH4L) in a mixture with non-participating gases at a mixture pressure of 1 atm, [9,10,12].](https://www.jscimedcentral.com/public/assets/images/uploads/image-1721887191-1.PNG)
Figure 9: Absorptivity of CH4 vs (PCH4L) in a mixture with non-participating gases at a mixture pressure of 1 atm, [9,10,12].
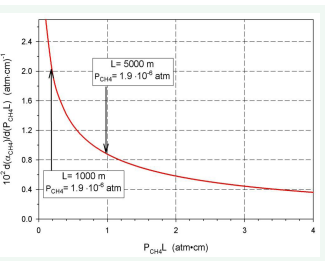
Figure 10: Relationship dαCH4/d (PCH4L) vs (PCH4L).
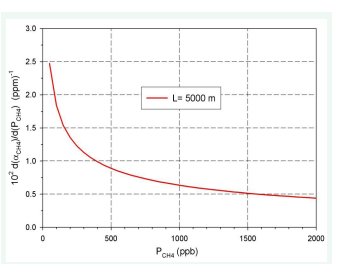
Figure 11: Relationship dαCH4//d (PCH4L) vs (PCH4).
A comparison of absorptivity values calculated for L=5000 m and actual concentrations of carbon dioxide, methane and water vapour to asymptotic values is presented in (Table 2).
Table 2: Real and asymptotic absorptivity values for L = 5000 m.
|
Component |
Actual Concentration |
Absorptivity |
|
|
Calculated |
Asymptotic |
||
|
Carbon dioxide |
420 ppm |
0.178 |
0.185 |
|
Methane |
1909 ppb |
0.0162 |
0.0748 |
|
Water vapour |
0.005 atm |
0.669 |
0.670 |
|
0.040 atm |
0.670 |
0.670 |
|
It is seen that for CO2 and H2 O, the actual values are very close to their asymptotic values, but absorptivities of H2 O are almost four times greater than CO2 . This means that the concentration of H2 O is the leading cause of the greenhouse effect. In the case of CH4 , the actual absorptivity compared to CO2 and H2 O is lower than its asymptotic values but still too low to significantly affect global warming.
PREDICTIONS OF CARBON DIOXIDE AND WATER VAPOUR ABSORPTIVITY CHANGES
The increase of absorptivity of the tropospheric air layer resulting in greenhouse gases increasing concentration with time t allows predicting climate changes in the future. The obtained results make it possible to estimate the growth rate of the global warming effect in the future based on general function;
23
Assuming linear dependence with time [13]
P (t)=A +Bt 24
the derivative
25
and
26
thus
27
For L= 5000 m and PCO2 = 420 ppm
and
thus
and
28
For water vapour, from a physical point of view
Thus
DISCUSSION
General conclusion - as the calculation results show:
Increasing greenhouse gas concentrations in the troposphere play a negligible role in intensifying the greenhouse effect: This conclusion concerns average values. In fact, the concentration of greenhouse gases is not homogeneous. Locally, concentration gradients occur, which causes absorptivity gradients and ultimately leads to local temperature gradients that are the causes of adverse climatic events.
Error Analysis
Carbon dioxide standard error of estimation for Eq. (11) = 0.007 and for constants: a = 0.185 ± 0.050, b =–0.3919 ± 0.059 and c = 0.400 ± 0.090 and correlation coefficient R = 0.9755.
Water vapour - standard error of estimation Eq. (17) = 0.01175, a = 0.664 ± 0.044, b = –0.3743 ± 0.0375, and c = 0.5203 ± 0.0352 and correlation coefficient R = 0.997.
Methane-standard error of estimation Eq. (20) = 0.0024, a = 0.0748 ± 0.0031, b = –0.2555 ± 0.0076 and c = 0.5927 ± 0.034 and correlation coefficient R = 0.998.
CONCLUSIONS
The IPCC calls for zero net greenhouse gas emissions by 2035 (via the Paris Agreement), and many climate scientists support this view. As noted above, the results of the calculations (see Figures 2-7) indicate that future increases in GHG concentrations will not significantly impact global warming but will lead to an increase in primary energy demand. This conclusion does not imply that all primary energy types, especially those from fossil fuels, are of equal value. This is especially true for the most environmentally dangerous coal. The energy conversion processes of coal are the most dangerous, especially the emissions of mutagenic, teratogenic and carcinogenic fractions, trace elements and organic substances. Finally, the authors are aware of any controversial opinions regarding our analysis. However, we are convinced that further basic research is needed to accept the IPCC conclusions.
AUTHOR CONTRIBUTIONS
Conceptualization, ZK and JD; methodology, ZK, JD and JS; resources, ZK, JD, JS and AT; visualisation, JD; writing-review and editing, JD.
ACKNOWLEDGMENTS
The present research was supported by the Polish National Agency for Academic Exchange (NAWA), within the Strategic Partnerships Programme, Project No. BPI/PST/2021/1/00023. The numerical results were obtained by computational power financially supported by the program “Excellence Initiative – Research University” for the AGH University of Krakow, Poland.
Appendix A
Influence of temperature and CO2 concentration changes on absorptivity of the tropospheric air layer. The analysis is based on the model proposed by Byun and Chen [9] for the total emissivity of carbon dioxide, which is as follows
A.1
where
A.2
and γ is a constant equal to 50 (cm2 /g), PCO2 is the partial pressure of CO2 (atm), T is the temperature of gas (K), RCO2 is the specific gas constant of CO2 , and L is gas layer thickness (cm). Thus, in general mathematical form
αco2 = f(T,Pco2 ) for fixedL
From mathematical rule
A.3
after differentiation of Eq. (A.1)
A.4
A.5
Assuming average values, the changes in absorptivity as a function of time
A.6
or
From Eqs. (A.1) to (A.7), the relative value
A.8
For data [13]
and
thus
This result justifies the approximations given by Eq. (6).
REFERENCES
1. IPCC Fifth Assessment Report-Impact, Adaptation and Vulnerability, Summary for Policymakers. 2014.
2. Synthesis Report of the IPCC Sixth Assessment Report (AR6), Summary for Policymakers. 2023.
3. Laroux M. Dynamic Analysis of Weather and Climate, John Wiley and Sons and PRAXIS PUBLISHING, 1998; 243.
4. IPCC – Contribution to the Sixth Assessment Report, Climate Change. The Physical Science Basis. 2021.
5. NASA Global Climate Change – Scientific Consensus: Earth’s Climate is Warming, NASA Jet Propulsion Laboratory, Ed. Earth Science Communication Team. 2022.
8. Bejan A. Heat Transfer. John Wiley and Sons. 1993; 552.
10. Hottel HC, Sarofim AF, Radiative Heat Transfer. McGraw-Hill. 1967; 228-233.
12. NOAA Global Monitoring Laboratory Earth System Research Laboratories. Trends in CH4. 2022.
13. Peixoto JP, Oort AH. Physics of Climate, Am Inst of Physics. 1992.


