Environmental DNA Metabarcoding and Morphological Assessment of the Macroinvertebrate Community in Asa River, Ilorin, Nigeria
- 1. Department of Zoology, Kwara State University, Nigeria
- 2. Department of Environmental Sciences, University of South Africa, South Africa
Abstract
Freshwater ecosystems sustain biodiversity and human livelihoods but are increasingly degraded by anthropogenic pressures, necessitating reliable biomonitoring for effective management. Asa River is a key source of fisheries and domestic water in Ilorin, Nigeria, yet it is highly vulnerable to point and non-point pollution, requiring continuous ecological assessment. Previous evaluations relied solely on morphological identification of macroinvertebrates, which is constrained by taxonomic subjectivity and limited detection of cryptic taxa. This study therefore integrated environmental DNA (eDNA) metabarcoding with conventional morphology to characterize macroinvertebrates diversity to assess the ecosystem health of the Asa River based the macroinvertebrate Family Biotic Index (FBI). Sampling was conducted from 2023 to 2025. Physical and chemical variables were measured using standard methods and formulated into a Water Quality Index (WQI). Macroinvertebrate assemblages were analyzed using diversity indices, BENTIX and Biotic Index, while community patterns were explored with Non-Metric Multidimensional Scaling (NMDS) and canonical Correspondence Analysis (CCA). WQI values ranged from 89.3 to 305.5, indicating generally poor water quality. Morphological identification showed dominance of Mollusca (> 70%), whereas eDNA revealed Insecta as the most abundant group (≈ 38%). BENTIX scores ranged from 2.15 to 3.35, suggesting degraded ecological conditions. The NMDS indicated marked seasonal shifts in community structure, and CCA identified total phosphorus, total nitrogen and dissolved oxygen as key drivers of taxonomic distribution. The findings demonstrate eDNA metabarcoding complements, but does not replace, morphological assessment, and that integrating both approaches provide a more robust evaluation of river health. Asa River is currently dominated by pollution-tolerant taxa, reflecting its poor ecological status.
Keywords
• Macroinvertebrates
• Ecological-Health
• Environmental variable
• CCA
• Diversity indices
• BENTIX
Citation
Iysa MD, Ramulifho P, Kafayat I (2026) Environmental DNA Metabarcoding and Morphological Assessment of the Macroinvertebrate Com munity in Asa River, Ilorin, Nigeria. JSM Environ Sci Ecol. 14(1): 1111.
INTRODUCTION
Freshwater ecosystems support a high proportion of global biodiversity and provide essential ecosystem services, including water supply, nutrient cycling, and food resources [1]. Monitoring biological communities is therefore fundamental for evaluating the ecological condition of rivers, streams, and for guiding water resource management. Aquatic macroinvertebrates are widely used as bioindicators of water quality due to their sensitivity to environmental change and their well established ecological roles [2]. Macroinvertebrates are an indispensable part of aquatic ecosystems and are often used as indicators of water quality and ecological state of these systems [3,4]. There is a global acceptability of the valuable roles’ macroinvertebrates have in the monitoring and assessment of river health because they are regarded one of the best and efficient ways to monitor the state of aquatic ecosystems [5]. Macroinvertebrates involve in the decomposition and circulation of nutrients in aquatic ecosystems [6]. They are sensitive to low-level pollutants and can be used for early detection of river degradation [7]. Conventional biomonitoring is based on morphological identification of collected organisms, but this approach can be limited by taxonomic complexity, processing time, and difficulties in identifying early life stages and cryptic taxa. In recent years, environmental DNA (eDNA) metabarcoding has emerged as a promising molecular technique for detecting aquatic organisms from water samples and for complementing conventional biodiversity assessment methods [8].
However, most comparative studies between eDNA metabarcoding and morphological methods have been conducted in temperate regions, while tropical African rivers remain poorly represented in the literature. The performance of eDNA metabarcoding in detecting macroinvertebrate diversity in Nigerian river systems, and its agreement with conventional morphological surveys, is therefore still largely unknown. This study investigates macroinvertebrate community composition and diversity in the Asa River, a major tributary of the River Niger in north central Nigeria. The river exhibits a gradient of ecological conditions along its course, ranging from minimally disturbed forested headwaters to downstream sections heavily impacted by anthropogenic activities. Although the river plays a crucial role in regional freshwater biodiversity, previous research has primarily focused on environmental variables, with aquatic fauna particularly macroinvertebrate community structure and diversity remaining largely understudied.
To fill this gap, this study integrates eDNA metabarcoding and traditional morphological identification to assess macroinvertebrates diversity in the Asa River. Specifically, aim to (1) compare macroinvertebrate community structures identified by both methods, (2) evaluate the complementarity of eDNA and morphological surveys, (3) analyse key environmental drivers influencing macroinvertebrates community composition and to assess the ecological health of the river.
MATERIALS AND METHODS
Study Area
This study was conducted along the Asa River, Nigeria. The Asa River extends approximately 116 km, serving as a major tributary of the River Niger. Thirty sampling sites were established at intervals to achieve adequate spatial coverage at three stations (Dam, Laduba and Afon) with 10 sampling sites each. All sampling took place under stable weather conditions to minimize environmental fluctuations (Figure 1). The river lies between latitude 8°28” and 8°52” N and longitude 4°35” and 4°45”E. The coordinates of the sampling stations are Dam – 8°24’25”N, 4°33’45” E; Laduba – 8°20’93” N, 4°33’76” E; Afon – 8°26’29” N, 4° 31’1” E were visited monthly during the study period. The selection of sampling sites was based on the presence and absence of significant human impacts. Fewer anthropogenic activities are occurring at Afon compared to other stations.
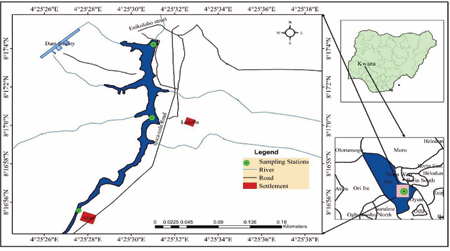
Figure 1: Map of Asa River showing location of sampling stations.
Sampling
The sampling was conducted between February 2023 to January 2025 in sites of station. Water sampling and sample preservation were conducted in accordance with the standard methods for the examination of water and wastewater [9]. One liter of water samples was collected in sterile bottles along the shoreline (littoral zone) and in the pelagic zone of each sampling station from multiple points to maximize detection probability. Bulk sampling for macroinvertebrates in the littoral zone was done with D frame (50cm by 30cm; 500µm mesh size) kick-net at each sampling site. At each station in the open waters, Eckman grab was used to collect sediment in the profundal, macroinvertebrates in them picked and preserved (Figure 1).
For eDNA sampling, 1 L of surface water was collected at each station using sterile polyethylene bottles, which were pre-treated with a 1:10 bleach solution and rinsed thoroughly with ultrapure water. Field equipment, including forceps and filtration devices, was decontaminated sequentially using a 10 min bleach soak, followed by rinsing with tap water and ultrapure water to eliminate potential cross-contamination. Water samples were stored in light-proof containers at −20°C and transported to the laboratory within 6 h for further processing.
Environmental Parameter Measurement
Water quality parameters were recorded in situ using a multiparameter water quality meter (portable HANNA multi-probe meter (HI 98129)). The probe meter was calibrated prior to use at the sampling sites. Measurements included pH, Dissolved Oxygen (DO), Electrical Conductivity (EC), Total Dissolved Solids (TDS) and water Temperature (T). Additional water samples were collected for laboratory analysis to determine Total Nitrogen (TN), Total Phosphorus (TP), Chemical Oxygen Demand (COD) and Total Organic Carbon (TOC). Water transparency depth were determined with a Secchi disk attached to a calibrated cord.
eDNA Extraction, PCR Amplification and Sequencing
eDNA filtration was carried out with 0.45µm pore sterivex unit filters using a peristaltic pump; filter membrane was preserved inside a 5ml bead protube containing the unique bead mix. Three replicates collected per site to ensure consistency. Negative controls were incorporated at each step to monitor contamination. DNA extraction and PCR setup were performed in a dedicated trace-DNA laboratory, which was physically isolated from any areas handling PCR amplicons to prevent cross contamination. DNA extraction protocols from filters were based on the DNeasy PowerWater Kit protocols. All DNA replicates and blank controls were extracted using a DNeasy PowerWater Kit (QIAGEN, Hilden, Germany), to prevent contamination during field handlings, transport and DNA extractions. Each reaction included 10µL of 2x Taq Plus Master Mix II, 2µL of the template DNA, 1µL of upstream and downstream primers each, and 6µL of enzyme-free water in a total reaction volume of 20µL. The extracted DNA samples were stored at −80°C for subsequent analysis. After the extraction of genomic DNA was completed, 1% agarose gel electrophoresis was performed to detect the quality of the extracted DNA to ensure its integrity and purity.
Subsequently, PCR designed to amplify the ~ 400 bp V4 region of the nuclear small subunit 18S rRNA gene using specific primers of the connector sequence of the fusion sequencing platform. The primer sequences were Uni18SF (5′-AGGGCAAKYCTGGTGCCAGC-3′) and Uni18SR (5′-GRCGGTATCTRATCGYCTT-3′) [10] were used. The PCR amplification was performed under the following conditions: 95oC pre-denaturation for 30 s;95°C denaturation for 5 s, 54°C renaturation for 30 s, 72°C extensions for 10 s, 40 amplification cycles; 72°C extensions for 5 min; 4°C preservation. The PCR products were further purified after detection by 2% agarose gel electrophoresis. The equipment and reagents used in the DNA extraction and the PCR amplification were all sterile in the state or sterilized to avoid cross-contamination during the operation.
The PCR products obtained from the DNA amplification were pooled into a single tube with equimolar quantities. All libraries were quantified using a Qubit R 4.0 fluorometer to ensure uniform cluster generation and high-quality sequencing output. The final sequencing was performed on an Illumina MiSeq™ platform (2 × 250 bp, paired-end sequencing) (Negclab Howard, Washington, USA), with all libraries sequenced at equal concentrations. Adapter sequences and low-quality reads were removed before subsequent bioinformatics analysis.
Bioinformatics and Taxonomic Identification
Raw sequencing reads were first demultiplexed and trimmed to remove adapter sequences using Cutadapt (Martin, 2011). Paired-end reads were merged using PEAR [11], and low-quality sequences (Q < 20) and singletons were filtered out. Molecular Operational Taxonomic Units (MOTU) were clustered at a 97% similarity threshold using UPARSE [12]. Taxonomic assignments were performed by BLASTn searches [13] against a reference database with ≥ 90% sequence identity and ≥ 90% query coverage criteria.
A conservative approach was adopted to remove the low abundance threshold in order to minimize potential sequencing errors. The final species inventory was validated by cross-referencing with morphological identifications from traditional macroinvertebrate surveys. Community composition matrices were constructed based on species presence–absence and relative abundance, and station (dam, laduba and afon) analyses were conducted to assess differences between eDNA and morphological methods.
Data Processing
Asa River ecological system health evaluation based on water quality index (WQI). The computation of the WQI values based on established threshold limit values for each parameter, as detailed in [14]. The macroinvertebrates community composition was assessed from both eDNA metabarcoding and morphological methods. The relative abundance of macroinvertebrates species detected through morphological surveys calculated based on individual counts, whereas the eDNA based species abundance was standardized using Total Sum Scaling (TSS) to mitigate sequencing depth variations [15].
To assess species diversity, both α-diversity and β-diversity indices were calculated. Shannon–Wiener diversity and Simpson’s diversity were used to quantify α-diversity. β-diversity was assessed using Bray–Curtis dissimilarity, with community structure differences visualized with Non-Metric Multidimensional Scaling (NMDS). To test for significant differences in community composition across stations, Analysis of Similarities (ANOSIM) employed [16].
The data were imported into MEGAN and sequences were aligned using ClustalW. Classification was attributed using the software MEGAN Community Edition. Two taxonomic [α diversity indices (i.e., Shannon–Weiner Index and Simpson Index) were calculated using the “alpha_diversity.py” script in the QIIME toolkit. Non metric multidimensional scaling (NMDS) was performed on the community matrix involving OTUs and taxa levels, as described in [17]. Community structure analyses and Analysis of Similarities (ANOSIM) were performed using the “vegan” package in R 4.2.3. The “ggplot2” package was used to visualize relative abundance heatmaps, diversity index boxplots, and cluster dendrogram.
Environmental drivers of macroinvertebrates community composition were explored using Canonical Correspondence Analysis (CCA), which examined the relationships between macroinvertebrates composition and environmental parameters. CCA was performed with PAST v4.03. Multivariate analyses, Non-Metric Multidimensional Scaling (NMDS), was conducted using the “ade4” package. Data handling and processing were performed with the “dplyr” package while phylogenetic diversity metrics were calculated using the “picante” and “tidytree” packages.
Statistical Analysis
Rarefaction was applied to the reads to homogenize the sequencing depth. Reads were rarefied to the read count of the lowest sample in each marker. The “rarefy” function from the vegan package used to OTU rarefaction. Bray–Curtis dissimilarity was calculated with square root transformed morphological abundance and molecular reads matrices to assess sample dissimilarities. The degree of correspondence between the ordinal results obtained for morphological and molecular datasets was evaluated with a procrustean analysis followed by a residual difference by station. Procrustean plots were generated from the ordinal results of morphological and molecular based Non-Metric Multidimensional Scaling (NMDS) based on the Bray–Curtis distance matrixes. CCA were performed on the Bray–Curtis dissimilarity matrix to elucidate the relationship between environmental variables and the macroinvertebrate community composition. All statistical analyses were performed with OTUs due to low taxonomic assignment. All the statistical analyses were conducted in R 4.2.3. The macroinvertebrate index estimated based on [18] Family Biotic Index (FBI). The macroinvertebrate tolerance value based on [19]. Benthic macroinvertebrate and benthic habitat based on BENTIX index were used based on [20].
RESULTS
Physical and Chemical Parameters
The Asa River studied displayed great variability in physicochemical parameters within the stations (Table 1). Environmental variability related to spatial temporal changes, such as temperature (24.03-29.2)0C. Transparency (35.46-201) cm. pH (6.4-8.93). TDS (33.03 285) mg/l. Total Phosphate TP (0.01-2.19) mg/l. DO (6.24 9.3) mg/l. BOD (1.93-11.3) mg/l. COD (0.6-228.5) mg/l. EC (66.5-502) µS/cm. Sulphate (7.3-71.8) mg/l. Total Nitrogen TN (0.17-1.9) mg/l. Organic Matter (OM) (15.2-35.1) mg/l and Total Organic Carbon (TOC) (8.8-20.4) mg/l.
Water Quality Index (WQI)
The WQI based on Asa River environmental spatial temporal variation during the study period ranged between 89.3-305.5 (Table 1). The lowest WQI occurred during the rainy season 2023 at Laduba station and highest during rainy season 2024 at Dam station.
Table 1: Seasonal WQI values of stations of Asa River, Ilorin, Nigeria and their Status.
|
SEASON |
STATION |
WQI |
QUALITY STATUS |
|
RAINY
2023 |
DAM LADUBA AFON |
147.5 |
Unfit for drinking/fit for domestic use & aquaculture |
|
89.3 |
Very poor |
||
|
100.3 |
Very poor |
||
|
DRY
2023 |
DAM LADUBA AFON |
191.4 |
Unfit for drinking/fit for domestic use & aquaculture |
|
214.1 |
Unfit for drinking/fit for domestic use & aquaculture |
||
|
186.3 |
Unfit for drinking/fit for domestic use & aquaculture |
||
|
RAINY
2024 |
DAM LADUBA AFON |
305.5 |
Unfit for drinking/fit for domestic use & aquaculture |
|
234.6 |
Unfit for drinking/fit for domestic use & aquaculture |
||
|
230.1 |
Unfit for drinking/fit for domestic use & aquaculture |
||
|
DRY
2024 |
DAM LADUBA AFON |
256.6 |
Unfit for drinking/fit for domestic use & aquaculture |
|
291.1 |
Unfit for drinking/fit for domestic use & aquaculture |
||
|
250.8 |
Unfit for drinking/fit for domestic use & aquaculture |
Status classification with reference to [14].
Excellent- 0-25; Good- 26-50; Poor- 51-75; Very poor- 76-100; above 100- Unfit for drinking/ fit for domestic use aquaculture
MACROINVERTEBRATE COMMUNITY IN ASA RIVER
Morphological
A total of 1421 individuals were estimated, identified and belonged to 3 phyla (Mollusca, Arthropoda and Annelida) and 4 classes (Bivalves, Gastropoda, Insecta and Oligochaeta). Mollusca was the most abundant group, which had 26 genera (approximately 70.8% of the total individual number), the Bivalves constitute 39.5% of the total individual number. Sphaerium sp. and Musculium sp. dominant at all stations and seasons with 5-10 ind/m3. The Gastropoda constitute 31.3% of the total individual number. Aylacostoma sp. is dominant at all stations and seasons with 5-10 ind/m3. The phylum Arthropoda is dominated by the class Insecta which had 29 families (approximately 27.8% of the total individual number). The phylum Annelida is made up of the class Oligochaeta which had approximately 1.4% of the total individual number.
Environmental DNA Metabarcoding (Molecular)
Original reads for 18S-V4 were clustered for Dam, Laduba and Afon station having 7533, 4615 and 9860 Operational Taxonomic Units (OTUs) respectively. The taxonomic assignment was performed using BLAST and the NCBI database at 97% similarity, the macroinvertebrate were classified into 5 phyla (Mollusca, Arthropoda, Annelida, Porifera and Platyhelminthes), 7 classes (Bivalvia, Gastropoda, Insecta, Oligochaeta, Hirudinea, Hydrozoa and Turbellaria), 22 order (Unionida, Venerida, Cerithioidea, Truncatelloidea, Ampullarioidea, Planorbidea, Lymnaeoidea, Plectoptera, Ephemeroptera, Tricoptera, Coleoptera, Megaloptera, Anisoptera, Zygoptera, Isoptera, Diptera, Hemiptera, Tubificida, Rhynchobdellida, Anthoathecata, Tricladida and Dugesia) and 66 families.
Taxonomic Composition of Macroinvertebrate Communities
The relative abundance heatmap displays the top 30 macroinvertebrate families detected across the three sampling stations (Dam, Laduba, and Afon) for both eDNA and Morphological (morph) methods. There is a clear visual difference in dominance patterns between the two methods. Mycetopodidae and Hyriidae show high relative abundance in specific eDNA samples (Laduba) compared to the morphological results (Figure 2).
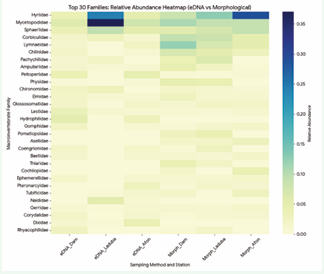
Figure 2: Comparative taxonomic composition of macroinvertebrate families in the Asa River as revealed by eDNA metabarcoding versus morphological surveys.
The eDNA profile for Laduba stands out with a high concentration of specific bivalve families (Mycetopodidae), whereas the morphological profiles for the three stations appear more homogenized in their distribution of common families. Dominant families Hyriidae and Mycetopodidae appear as the most abundant across multiple stations, especially within the eDNA datasets, while families at the bottom of the heatmap Rhyacophilidae and Dixidae maintain a consistently low relative abundance.
Species Diversity Patterns and Community Structure Variability
α-diversity indices revealed significant differences between the two methods (Figure 3). Morphological surveys yielded significantly lower Shannon (H′, p > 0.05) and a lower Simpson diversity index (1- D, p < 0.05) compared to eDNA analysis (Figure 3). The alpha diversity boxplots compare the Shannon and Simpsons of macroinvertebrate communities identified by each method across the study stations. The greater variance in eDNA diversity indices suggests molecular biomonitoring is highly sensitive to station-specific environmental conditions.
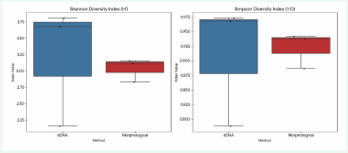
Figure 3: Comparison of Shannon–Wiener index and Simpson index values between eDNA and morphological surveys.
β-diversity analyses performed, NMDS (Figure 4) showed distinct community structures observed by the two approaches. The NMDS plot shows a clear separation between the eDNA samples (blue) and the morphological samples (red). This suggests that the two techniques provide significantly different perspectives on Asa River macroinvertebrate diversity and structure, likely due to the higher taxonomic resolution and detection of cryptic species in the eDNA dataset. Significant difference p < 0.05 suggests the similarity between your two approaches is statistically significant (Figure 5).
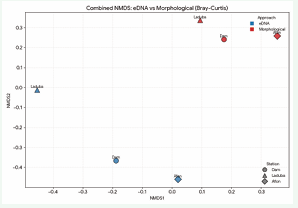
Figure 4: Non-Metric Multidimensional Scaling (NMDS) based on Bray–Curtis dissimilarity indices, were applied to analyse macroinvertebrates community β-diversity patterns under different survey methods.
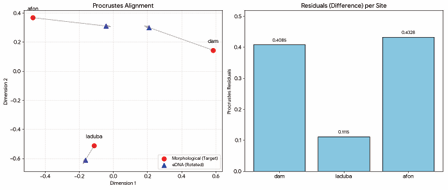
Figure 5: Comparison of NMDS through Procrustes analysis between morphological and eDNA. Residual values from comparing morphological identification and the molecular identifications.
The arrows connect the same station across both methods the shorter the line, the more the two methods agree on the macroinvertebrate’s community composition of that station. The Procrustes correlation rotation indicates a value closer to 1 suggests that the eDNA results closely match the morphological results in terms of station similarity. High residual indicates the morphological and eDNA methods gave very different results for afon station while low residual indicates that both methods agreed closely on the community structure at laduba station.
The disparity (M2) between eDNA and morphology is 0.3666, this value represents the overall sum of squared differences between the two ordinations. A lower value indicates higher congruence between the two techniques. Residuals per station bar chart shows the specific error for each station. Laduba shows the smallest residual approximately 0.11, depicting the two methods are most consistent at this location. Afon and Dam show larger residuals (≈0.41 - 0.43), indicating more significant differences in macroinvertebrates composition detection between morphology and eDNA at these stations.
The significant differences in macroinvertebrates community composition across Asa River stations. The Analysis of Similarities (ANOSIM) results (Figure 6) demonstrate a differences between the two approaches.
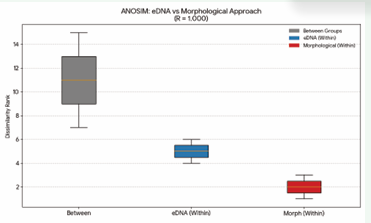
Figure 6: The analysis of similarities based on Bray-Curtis distances on square-root transformed abundance data to balance the influence of high-read eDNA families against lower morphological counts.
Analysis of similarity of macroinvertebrates composition in Asa River based on eDNA and morphology. Between the two methods (Gray) illustrates the highest dissimilarity ranks, indicating that any comparison between an eDNA sample and a morphological sample yields a high degree of difference.
Within eDNA (blue) illustrate moderate dissimilarity ranks, reflecting the variation in community composition across the Dam, Laduba, and Afon stations. Within morphological (red) shows the lowest dissimilarity ranks, suggesting low differences in community composition at stations. The morphological identifications are more similar to one another than they are to the eDNA identified (Figure 7).
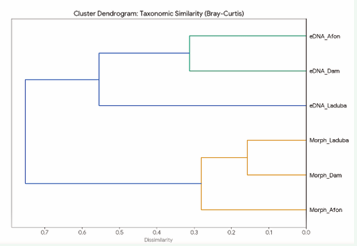
Figure 7: The tree-like visualization based on Bray-Curtis dissimilarity on square-root transformed composition data to show how the eDNA and Morphological macroinvertebrates group together.
This tree-like visualization uses Bray-Curtis dissimilarity on square-root transformed taxonomic abundance data to show how the eDNA and morphological macroinvertebrate taxa group together. The most significant branch separates the eDNA samples from the morphological samples. This aligns with the ANOSIM result of R =1.0, confirming that method choice is the dominant factor in community composition. Within the eDNA reads, Afon and Dam show the highest similarity, while Laduba is more distinct. The morphological counts are more tightly clustered together, indicating higher similarity in community structure when using morphology-based identification across the three stations.
The Canonical Correspondence Analysis (CCA) identify specific environmental gradients influence the spatial distribution based on abundance of macroinvertebrate taxa. The analysis highlights how specific environmental variables particularly nutrient levels, oxygen demand, and conductivity shape macroinvertebrate community structure in Asa River. Bivalves and Oligochaetes responded strongly to oxygen-related variables and organic matter, while insect taxa showed resilience across varying water mineral content. The distribution patterns (abundance decreasing from the Dam to Afon station) of Gastropoda and Hirudinea suggest sensitivity to nutrient enrichment, which could serve as a potential bioindicator of eutrophication in stations of the river (Table 2,3).
Table 2: Asa River Macroinvertebrate BI score.
|
Station |
Morphological |
Molecular (eDNA) |
|
Dam |
5.2 |
4.6 |
|
Laduba |
5.5 |
4.2 |
|
Afon |
5.4 |
4.0 |
Based on [18]. Ecological Status keys: Excellent- 0-3.75; Very good- 3.76-4.25; Good-4.26-5.00; Fair- 5.01-5.75; Poor- 5.76-6.50
Table 3: Asa River Soft Bottom Benthic Habitat Based on BENTIX Index.
|
Approach/ STATION |
DAM |
LADUBA |
AFON |
|
Morphological |
2.15 |
2.92 |
2.43 |
|
Molecular (eDNA) |
2.53 |
3.35 |
2.67 |
Based on [20]. Ecological Quality key: Normal- 4.5-6; slightly polluted- 3.5-4.5;
moderated polluted- 2.5-3.5; heavily polluted 2.0-2.5; Azoic 0.
DISCUSSION
Asa River Water Quality Index (WQI)
The Asa River physicochemical parameters revealed considerable spatial and seasonal variability which represent a foundational approach to understanding its ecological status and potential for sustainable utilization. The Asa River WQI were estimated from its water physical and chemical parameters based on their importance in drinking, recreational and irrigation water quality index.
The WQI values (Table 1) of Asa River water fell predominantly within the category classified as “Unfit for drinking but suitable for domestic use and aquaculture” across all sampling stations and both seasonal periods. However, at Laduba Station during the rainy season, 2023, the WQI value fell into the “Very Poor” category (76–100), indicating more severe water quality degradation at this station and season.
Environmental Influences on macroinvertebrates
Community Structure
Canonical correspondence analysis (CCA) identified key environmental variables shaping macroinvertebrates community composition (Figure 8). Its indicates that there are differences in environmental associations between eDNA and morphological methods, reflecting their respective detection advantages. Bivalves were found to be positively associated with sulphate, Chemical Oxygen Demand (COD), pH, Dissolved Oxygen (DO), Total Organic Carbon (TOC), and biological oxygen demand (BOD) in Dam and Laduba stations reflecting the different oxygen requirements of different taxonomic groups [21].
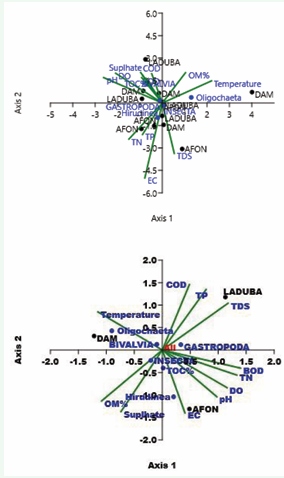
Figure 8: Canonical Correspondence Analysis (CCA) of environmental variables influencing Asa River macroinvertebrate community distribution. Black circles represent the sampling stations, while blue circles represent specific taxonomic group. Green lines represent the environmental variable vector.
Oligochaeta showed a strong positive correlation with temperature and Organic Matter (OM) concentration in morphological derived communities, only at the Dam station, indicating a more localized ecological preference. Class Insecta members correlated positively with Total Dissolved Solids (TDS) and were found across all stations, suggesting a broad tolerance or adaptation to elevated mineral content in the water.
Gastropoda and Hirudinea were most abundant in Afon and Laduba stations, with their distribution closely associated with higher concentrations of Total Phosphate (TP), Total Nitrogen (TN), and Electrical Conductivity (EC) factors often linked with nutrient enrichment and organic pollution. The Total Phosphorus (TP), pH, water Temperature (T), Total Dissolved Solids (TDS) significantly influenced eDNA-derived communities. This complementarity indicates that a single approach may underestimate the complexity of the environment community relationship in Asa River systems.
Asa River Ecological Assessment
The ecological assessment of freshwater systems is increasingly guided by the evaluation of Biological Quality Elements (BQEs), including benthic macroinvertebrates [22]. A comprehensive characterization of these biological assemblages on Asa River which provides valuable insight into ecosystem functioning and health. These biological indicators are essential for evaluating the ecological status of aquatic ecosystems. The Benthic Macroinvertebrate Index (BENTIX) and Biotic Index (BI) were ecological index used in this study.
Benthic Macroinvertebrate Index (BENTIX) of Asa River
Morphological identified macroinvertebrate data, the BENTIX value for Asa River estimated (Table 3). This score categorizes the river as moderately polluted at Laduba station and highly polluted at Dam and Afon stations, suggesting that the soft-bottom sediments are moderately enriched with organic matter from both external (allochthonous) and internal (autochthonous) sources [20]. The relatively low index value also reflects low macroinvertebrate diversity and indicates a degraded ecological condition of the sediment. In contrast, BENTIX estimated for environmental DNA (eDNA) metabarcoding data are 2.53, 3.35 and 2.67 for Dam, Laduba and Afon station respectively. These higher scores suggest slightly improved biodiversity and ecological status compared to the morphological assessment. According to [23], such a score indicates slight pollution, with moderate organic enrichment of the sediment and relatively better ecological conditions.
Biotic Index (BI) Assessment of Asa River
Based on morphological identification of macroinvertebrates, the Hilsenhoff Biotic Index (BI) values for the three sampling stations on the Asa River Dam, Laduba, and Afon, were 5.2, 5.5, and 5.4, respectively, indicate fair water quality associated with moderate organic pollution and reduced macroinvertebrate diversity. In contrast, BI scores for environmental DNA (eDNA) metabarcoding are lower 4.6 (Dam), 4.2 (Laduba), and 4.0 (Afon) indicating good to very good water quality [18]. These results suggest higher macroinvertebrate diversity and a healthier ecological condition. Overall, while both approaches point to moderate organic enrichment, the molecular analysis indicates better biodiversity and ecological integrity in Asa River compared to traditional morphological assessments.
Comparative Analysis of Macroinvertebrates Taxonomic Community in Asa River
A typology of Asa River was developed based on the similarities and dissimilarities in taxonomic assemblages of macroinvertebrates. This typological analysis is aimed at differentiating biotic patterns across space and time. Quantitative biocoenotic differentiation among stations was performed using an Analysis of Similarities (ANOSIM), along with a Non-metric Multidimensional Scaling (NMDS) plot, as illustrated in (Figures 4-7). This reflects a strong temporal influence on community structure, likely driven by seasonal hydrological and ecological changes. This typological assessment was spatially based on the three main sampling stations Dam, Laduba, and Afon. Molecular data showed that the taxonomic assemblages at Laduba and Afon were both completely similar to that of the Dam station, suggesting a shared community structure. However, a more detailed analysis indicated that while Laduba’s taxonomic composition aligned closely with that of the Dam, it differed from Afon’s, indicating subtle but notable spatial variations in diversity among stations. These findings underscore the influence of both temporal (seasonal) and spatial (station-based) factors on the ecological structure of Asa River’s macroinvertebrate communities. High reads for Peltoperlidae and Baetidae across stations while consistent counts for Hyriidae and Mycetopodidae. Apatania and Philopotamidae not present in morphological counts while captured Capniidae and Brachycentridae had zero reads in the eDNA reads. The ANOSIM R value of 1.0 indicates that the dissimilarities between the eDNA and morphological macroinvertebrates composition are significantly greater than any dissimilarities within the stations. This suggests that the two methods provide distinctly different profiles of macroinvertebrate community at the sampling stations. Within each method, the stations (Dam, Laduba, Afon) show varying degrees of similarity. For instance, the morphological approach shows a tighter grouping for the stations in the top-right quadrant, while the eDNA approach spreads the stations further apart along the NMDS axes, indicating a higher sensitivity to site-specific community variations This is supported by the strong correlation in the Procrustean analysis along the environmental variables, in contrast to similar studies conducted in other aquatic habitats, such as ponds and rivers, where such correspondence is rarely observed [24-26].
Comparison of eDNA and Morphological Methods for Assessing Macroinvertebrate Diversity
A total of 22,008 OTUs were clustered for macroinvertebrates based on eDNA metabarcoding analysis. Taxonomic assignments using the NCBI GenBank database classify macroinvertebrate organisms from five phyla, comprising seven classes, 22 orders, 66 families, and 104 genera. In contrast, morphological identification yielded 1,421 individuals, classified into three phyla, four classes, and 26 genera. Notably, all taxa identified through morphological analysis were also detected using genetic methods, demonstrating a strong congruence between eDNA metabarcoding and traditional morphological approaches. Several taxonomic groups were exclusively detected through eDNA, including the phyla Porifera and Platyhelminthes, as well as the classes Hydrozoa and Turbellaria, along with their associated orders, families, and genera. This highlights the added sensitivity of the eDNA method in uncovering taxa that may be underrepresented or missed entirely in morphological surveys. The study indicates improve resolution of biodiversity assessments, a framework that builds on the advantages of eDNA and morphology using a series of taxonomic and sampling station filters.
Community composition analysis further revealed method-dependent differences in β-diversity patterns. The β-diversity analysis, based on Bray–Curtis, highlighted that eDNA detected a more diverse array of taxa across stations, particularly rare taxa that morphology missed [27]. The NMDS ordinations confirmed this finding, showing that eDNA detected a more nuanced variation in community composition across spatial gradients. This indicates that eDNA is better suited for capturing spatial turnover of taxonomic groups, particularly those that are cryptic or patchily distributed [28], such as Hydrozoa and Turbellaria. In contrast, morphological surveys provided a more stable representation of species composition across stations, as they primarily detected more abundant and easily sampled species [29].
Integration of eDNA and Morphological Methods for Macroinvertebrate Diversity Assessment
The integration of eDNA metabarcoding and morphological methods provides a more comprehensive understanding of macroinvertebrate diversity in the Asa River, highlighting the complementary strengths of these approaches. Results demonstrate combining both methods significantly improved macroinvertebrate taxonomic detection. This confirms the advantage of integrating eDNA’s high detection sensitivity with morphological assessments of ecological traits and biomass estimation. Shannon and Simpsons diversity analysis further revealed that the integrated approach yields eDNA method shows a wider range of diversity values, reaching a maximum of 3.81 at the Dam station. The morphological method exhibits more consistent, though generally lower, median diversity across the sites, with values ranging from 2.83 to 3.16. The low outlier in the eDNA group corresponds to the Laduba station (H’ = 2.15), which reflects the dominance of specific bivalve families observed in the previous heatmap. Simpson Diversity (1- D) both methods indicate high community evenness, with most values exceeding 0.88. Consistent with the Shannon index, eDNA at the Dam station yielded the highest evenness (0.97), while Laduba showed the lowest due to its highly skewed relative abundance profile.
It has been proposed that eDNA can revolutionize biodiversity assessments given its ability to sample broad biodiversity in one stroke [30,31]. Comparing the outputs of these two approaches provide insight into biodiversity detection efficiency and reveals complementary strengths, as emphasized by [32] and [33]. eDNA-based biodiversity assessments should complement morphological approaches [34,35]. While there is currently no standardized protocol for fully integrating species lists from both methodologies [36], such comparative analyses are crucial for evaluating ecological data reliability and completeness. Nevertheless, due to potential biases during DNA extraction, amplification, and bioinformatics processing, integrating both methods yields a more comprehensive and reliable picture of aquatic biodiversity [36].
CONCLUSION
The overall ecological status of Asa River can be classified as moderately degraded base on the ecological used in the study. Water and sediment conditions are moderately suitable for sustaining diversity of anthropogenic stress tolerant species. While morphological assessments indicate reduced diversity and dominance of tolerant taxa, the eDNA approach uncovers higher biodiversity and evenness, revealing species that are not detected by morphology. These findings emphasize the value of integrating molecular techniques into long term monitoring programs to enhance environmental assessment and biodiversity conservation strategies for Asa River. This eutrophic status highlights the urgent need for targeted restoration and management strategies to mitigate nutrient loading and preserve the ecological integrity of the river.
To support the sustainable management and restoration of Asa River, public awareness campaigns and environmental education programs should be implemented to inform and engage local communities on the responsible use of the river’s water resources. Additionally, targeted removal of excessive macrophyte growth is advised to help restore ecological balance and improve water quality. The continued use of macroinvertebrates composition as bioindicators is strongly encouraged; their sensitivity to changes in trophic status and environmental conditions makes them valuable tools for long-term monitoring. These biological indicators can be instrumental in evaluating the effectiveness of ongoing and future restoration initiatives, thereby supporting adaptive management strategies aimed at enhancing the ecological integrity of Asa River.
REFERENCES
- Apostolaki S, Akinsete E, Koundouri P, Samartzis P. Freshwater: The importance of freshwater for providing ecosystem services. Encyclopedia of the World’s biomes. 2020: 71-79.
- López-López E, Sedeño-Díaz JE. Biological indicators of water quality: The role of fish and macroinvertebrates as indicators of water quality. In Environmental indicators. Dordrecht: Springer Netherlands. 2014; 643-661.
- Whitfield AK, Elliott M. Fishes as indicators of environmental and ecological changes within estuaries: a review of progress and some suggestions for the future. Journal of Fish Biology, 2002; 61; 229-250.
- Borja A, Miles A, Occhipinti-Ambrogi A, Berg T. Current status of macroinvertebrate methods used for assessing the quality of European marine waters: implementing the Water Framework Directive. Hydrobiologia, 2009; 633: 181-196.
- Bonada N, Prat N, Resh VH, Statzner B. Developments in aquatic insect biomonitoring: a comparative analysis of recent approaches. Annu Rev Entomol. 2006; 51: 495-523.
- Chris Gibbins, Damià Vericat, Ramon J Batalla. When is stream invertebrate drift catastrophic? The role of hydraulics and sediment transport in initiating drift during flood events. Freshwater Biology. 2007; 52: 2369-2384.
- Compin A, Céréghino, R. Sensitivity of aquatic insect species richness to disturbance in the Adour–Garonne stream system (France). Ecological Indicators. 2003; 3: 135-142.
- Chang H, Ye T, Xie Z, Liu X. Application of environmental DNA in aquatic ecosystem monitoring: opportunities, challenges and prospects. Water. 2025; 17: 661.
- APHA (2005) Standard Methods for the Examination of Water and Wastewater. 21st Edition, American Public Health Association/ American Water Works Association/Water Environment Federation, Washington DC, USA. Applied to Biomonitoring Mol Ecol Resour. 2005; 18: 1381–1391.
- Zhan Aibin, Martin Hulak, Francisco Sylvester, Xiaoting Huang, Abisola A Adebayo, Cathryn L Abbott, et al. High sensitivity of 454 pyrosequencing for detection of rare species in aquatic communities. Methods in Ecology and Evolution. British Ecological Society, 2013; 4: 558-565.
- Zhang J, Kobert K, Flouri T, Stamatakis A. PEAR: a fast and accurate Illumina Paired-End reAd mergeR. Bioinformatics. 2014; 30: 614-620.
- Edgar RC. Search and clustering orders of magnitude faster than BLAST. Bioinformatics. 2010; 26: 2460-2461.
- Altschul SF, Madden TL, Schäffer AA, Zhang J, Zhang Z, Miller W, et al. Gapped BLAST and PSI-BLAST: a new generation of protein database search programs. Nucleic Acids Res. 1997; 25: 3389-3402.
- Noori R, Berndtsson R, Hosseinzadeh M, Adamowski JF, Abyaneh MR. A critical review of the application of the National Sanitation Foundation Water Quality Index. Environ Pollut. 2019; 244: 575–587.
- Melendy SA, Olson JR. Identifying Key Environmental Drivers of Reach-Scale Salmonid eDNA Recovery with Random Forest. Environ DNA. 2024: 6; e70001.
- Somerfield PJ, Clarke KR, Gorley RN. Analysis of similarities (ANOSIM) for 2-way layouts using a generalised ANOSIM statistic, with comparative notes on Permutational Multivariate Analysis of Variance (PERMANOVA). Austral Ecol. 2021: 46; 911-926.
- Mattia Saccò, Nicole E White, Matthew Campbell, Sebastian Allard, William F Humphreys, Paul Pringle, et al. Metabarcoding under Brine: Microbial Ecology of Five Hypersaline Lakes at Rottnest Island (WA, Australia). Water. 2021; 13; 1899.
- William L Hilsenhoff. Rapid field assessment of organic pollution with a family-level biotic index. Journal of the North American Benthological Society. 1988: 7; 65-68.
- Rossaro B, Boggero A, Lods-Crozet B, Free G, Lencioni V, Marziali L, et al. A benthic quality index for European alpine lakes. Fauna norvegica. 2012: 31; 95-107.
- Simboura N, A Zenetos. Benthic indicators to use ecological quality classification of Mediterranean soft bottom marine ecosystems, including a new Biotic Index. Mediterranean Marine Science. 2002; 3: 77.
- Han Lai, Sheng Bi, Huadong Yi, Haiyang Li, Xuchong Wei, Gongpei Wang, et al. Characteristics of demersal fish community structure during summer hypoxia in the Pearl River Estuary, China. Ecol Evol. 2024; 14: e11722.
- 2. Caroni R, van de Bund W, Clarke RT, Johnson RK. Combination of multiple biological quality elements into waterbody assessment of surface waters. Hydrobiologia. 2013; 704: 437-451.
- Boggero Angela, Silvia Zaupa, Roberta Bettinetti, Marzia Ciampittiello, Diego Fontaneto. The Benthic Quality Index to Assess Water Quality of the Yalong Bay. Chin J Ecol. 2020: 40; 412–426.
- 3. Brown PD, JM Craine, D Richards, A Chapman, B Marden. DNA Metabarcoding of the Phytoplankton of Great Salt Lake’s Gilbert Bay: Spatiotemporal Assemblage Changes and Comparisons to Microscopy. Journal of Great Lakes Research. 2022; 48: 110-124.
- Nistal-García A, García-García P, García-Girón J, Borrego-Ramos M, Blanco S, Bécares E. DNA metabarcoding and morphological methods show complementary patterns in the metacommunity organization of lentic epiphytic diatoms. Sci Total Environ. 2021; 786: 147410.
- Vasselon V, F Rimet, I Domaizon, O Monnier, Y Reyjol, A Bouchez. Assessing Pollution of Aquatic Environments with Diatoms’ DNA Metabarcoding: Experience and Developments from France Water Framework Directive Networks. Metabarcoding and Metagenomics. 2019; 3: 101-115.
- McElroy ME, Dressler TL, Titcomb GC, Wilson EA, Deiner K, Dudley TL, et al. Calibrating environmental DNA metabarcoding to conventional surveys for measuring fish species richness. Front Ecol Evol. 2020; 8: 276.
- Penaluna BE, Cronn R, Hauck LL, Weitemier KA, Garcia TS. Uncovering the hidden biodiversity of streams at the upper distribution limit of fish. J Biogeogr. 2023; 50: 1151–1162.
- Maiello G, Bellodi A, Cariani A, Carpentieri P, Carugati L, Cicala D, et al. Fishing in the gene-pool: Implementing trawl-associated eDNA metaprobe for large scale monitoring of fish assemblages. Rev Fish Biol Fish. 2024; 34: 1293-1307.
- Altermatt F, Little CJ, Mächler E, Wang S, Zhang X, Blackman RC. Uncovering the complete biodiversity structure in spatial networks: The example of riverine systems. Oikos, 2020; 129: 607-618.
- Pawlowski J, Kelly-Quinn M, Altermatt F, Apothéloz-Perret-Gentil L, Beja P, Boggero A, et al. The Future of Biotic Indices in the Ecogenomic Era: Integrating (e)DNA Metabarcoding in Biological Assessment of Aquatic Ecosystems. Sci Total Environ. 2018; 637-638: 1295-1310.
- Mächler E, Little CJ, Wüthrich R, Alther R, Fronhofer EA, Gounand I, et al. Assessing different components of diversity across a river network using eDNA. Environ DNA. 2019; 1: 290-301.
- Heine P, Hausen J, Ottermanns R, Ross-Nickoll M. Comparing eDNA metabarcoding with morphological analyses: Fungal species richness and community composition of differently managed stages along a forest conversion of Norway spruce towards European beech in Germany. For Ecol Manag. 2021; 496: 119429.
- Groendahl, S., Kahlert, M., and Fink, P. The best of both worlds: A combined approach for analyzing microalgal diversity via metabarcoding and morphology-based methods. PLoS ONE, 2017: 12; e0172808.
- Seymour M, Edwards FK, Cosby BJ, Kelly MG, de Bruyn M, Carvalho GR, et al. Executing multi-taxa eDNA ecological assessment via traditional metrics and interactive networks. Sci Total Environ. 2020; 729: 138801.
- Schenekar T, Schletterer M, Lecaudey LA, Weiss SJ. Reference databases, primer choice, and assay sensitivity for environmental metabarcoding: lessons learnt from a re-evaluation of an eDNA fish assessment in the Volga headwaters. River Res Appl. 2020; 36: 1004.