Factors that determine the willingness to pay for private health policy in the Sunyani Municipality, Bono Region of Ghana
- 1. University of Energy and Natural Resources, Department of Mathematics and Statistics, Ghana
- 2. University of Mines and Technology, Department of Mathematical Sciences, Ghana
Abstract
Background: Since the commencement of the National Health Insurance Scheme (NHIS) in Ghana, some major conditions are not covered under the system, as they are considered expensive to treat. Individuals have to cough up additional monies to pay for certain services. It is important to have a health insurance plan in place to ensure that critical health conditions do not impair one’s financial independence.
Aim: The motive of this study is to find out the willingness of individuals to pay for a private health policy and the factors that may affect their decision.
Methods and material: The study was conducted in the Sunyani Municipality, Bono Region of Ghana. A multi-stage sampling technique was used to select respondents. This study is a cross-sectional study that collects both quantitative and qualitative data on 150 respondents using a structured questionnaire. We present descriptive statistics of the variables and then build a model to establish the relationship between a dichotomous willingness to pay (wtp) response variable and factors that determine one’s wtp. We arrived at this using a logistic regression model. We checked the predictive power of this model using the receiver operating characteristic (ROC) curve. We analyzed Statistically using STATA version 14.1.
Results: Our results shows that, majority (65.33%) of the respondents are wtp for a private health policy. Willingness to pay for a private health policy is significantly associated with spouse who are employed and having the ability to contribute for the private health policy.
Conclusion: The findings from this study would help industry players to model a policy that can be supported in the long run and assist insurance firms to decide whether or not it is feasible to follow through with independent secondary and tertiary health care plans.
Keywords
Cross-sectional study; Descriptive statistics; Logistic regression; Multi-stage sampling; National health insurance scheme; Operating characteristics curve; Private health policy; Questionnaire
Citation
Kumi W, Ahoba MB, Iddrisu AK, Yaw O (2020) Factors that determine the willingness to pay for private health policy in the Sunyani Municipality, Bono Region of Ghana. JSM Math Stat 5(1): 1018.
BACKGROUND
Health, as defined by the World Health Organization, is the state of complete physical, mental and social well-being, and not merely the absence of disease or infirmity [1]. Demand for healthcare differs from demand for other market goods because most consumers require some form of health care at some point in their lives without which they could lose their lives or suffer significant reduction in quality of life [2]. The need to use healthcare is more compelling service than other services because the outcome for using or not using healthcare services involves more than just economic well-being [1,2]. This calls for the need to have a sustainable health policy. Health policy is a set of decisions, plans, and actions to be followed to accomplish specific health care goals within the society [3].
The World Health Organization acknowledges equity in health financing as one of its three main priorities in the health care system (WHO, 2010). According to Kusi and colleagues [4], equal funding of healthcare and financial risk management indicates that access to healthcare does not bring untold misery on the concerned household. In Ghana, the government introduced the National Health Insurance Scheme (NHIS) in 2004, to provide Ghanaian citizens with fair access to and financial coverage of basic health care services [5]. This move was in line with the WHO’s global recognition of universal coverage as a high priority target for any financing mechanism for healthcare [6-8]. Despite the provision of the NHIS, some major conditions are not covered under the system, as they are considered expensive to treat. Most successful health insurance schemes in Africa are affiliated with the formal sector of developing countries designing health insurance schemes [9]. These schemes do not involve individuals in the informal sector, who live mostly in rural areas [10,11].
In the face of health-related contingencies, health care plans offer financial security. It is therefore crucial to have a health insurance scheme in place to ensure that it does not impair financial freedom, no matter how serious an illness is [12-14]. In view of this, an independent health care system is very necessary in order to achieve the specific health care goal of covering the levels of health care provision that the NHIS fails to cover. For the new system to run efficiently, factors such as income level of individuals, their ability and willingness to pay, amount that individuals are willing to pay for either a secondary or tertiary policy or both, whether they need the policy for themselves, their dependents or both themselves and dependents need to be considered.
According to Varian [15], willingness to pay (wtp) is the maximum price at or below which a consumer will definitely purchase a single unit of the product. This is in line with the standard economic view of the price of consumer reservations. In the determination of the maximum amount of money one is willing to pay in return for a specific benefit [16]. In the absence of real-world experience, the wtp for health insurance in lowincome countries is measured by contingent valuation (CV) methods. The contingent valuation methods directly determine what individuals would be willing to pay for a hypothetical health insurance package [15,17].
Precisely gagging consumers’ willingness to pay for a product or service is a key to formulating competitive strategies, performing value assessments, and creating new products [18]. It is also vital for various pricing strategies to be introduced, such as non-linear pricing, one-to-one pricing, and tailored promotions.
Increasing the usage of health care is a crucial priority for many developing countries, as it will boost the health status of the community. Increased opportunity to health services will create equitable health care solutions to the population. However, there are people who still do not make good use of the health care offered, particularly for financial reasons. Financing health care is a global challenge. In the resource-constrained environment of developing countries however, this challenge frequently assumes epic proportions. There is no doubt that health insurance policies are a crucial matter, dealing with both economic and social challenges [19-21]. In the face of rising health care prices at micro and macro levels, health insurance is becoming a realistic option for funding health care in Ghana. This is therefore a means of mobilizing private funds to enhance the quality of health care at the macro stage.
The choice to use health services can often influence the purchasing power of consumers and the quality of health services. Among other considerations in the procurement of health insurance, the price of health care proved to be a significant barrier to certain individuals who would choose to access health care facilities [22-25]. Market demand adjustments can affect the degree and frequency of use of resources and the revenues collected as well as enhancing consumer access to healthcare.
Even though the NHIS has relatively made health care provision affordable, it does not have certain provisions that people may need. It is not out of place to find instances where people needed certain health services for either themselves or their dependents but unfortunately could not get them due to the fact that those conditions were not covered under the NHIS. This causes a lot of financial burden on the people involved, as they would need to cough up additional money immediately to pay certain services or buy some lifesaving drugs. It could be that at the time of emergency, an affected individual may not be in the position to provide the amount of money needed. This could have very bad consequences for the member or his ailed dependent.
Globally, exposure to quality health services remains a big challenge for most health systems. In that regard, a lot of countries have introduced different health financing methods to provide quality basic health care to all its citizens. The National Health Insurance Scheme (NHIS) is one of the mechanisms used by the government of Ghana to offer affordable health care services to all residents. The NHIS was established in 2003 by the Act of parliament (ACT 650, Amended Act 852) and it successfully kicked off in 2004. Under the NHIS Amended Act 852 (2012), every Ghanaian is expected to enrol in a health insurance scheme. The goal of the NHIS is to provide equitable access for all by removing financial barriers to access basic health care services to Ghanaian citizens.
The scheme is financed through a central National Health Insurance Fund (NHIF) which is sourced from the National Health Insurance Levy (NHIL) (2.5% tax on selected goods and services), 2.5% of Social Security and National Insurance Trust (SSNIT) contributions largely coming from formal sector worker’s, premium payers also make payments and renew their membership annually to benefit from scheme and donor funds. Ghana’s current NHIS policy (Act 852) allows the following category of people to be exempted from paying premium; pregnant women, indigents, persons with mental disorder, social security recipients and pensioners, elderly (70 years and above) and differently-abled persons as determined by the Ministry of Gender.
In 2014, 40 percent of the population comprising of approximately 10.5 million Ghanaians were covered under the NHIS, with numbers rising from 0.5 per capita to 3 per capita between 2005 and 2014 on outpatient and inpatient visits to health facilities. Also, considering the per capita system, one disadvantage is that the provider may be tempted to supply the client with fewer than required resources.
The NHIS does not attempt to treat all ailments endured by covered participants. Nevertheless, other prevalent diseases such as malaria, cholera, upper respiratory tract infections, diarrheal diseases, are classified as NHIS-related diseases.
Ghanaians critics against NHIS have claimed that the policy is not financially viable owing to the significant proportion of NHIS participants under the non-co-payment premium exception (making part-payment to insurance provider under defined conditions) combined with high medical supplies / logistics and health care distribution costs. The satisfaction of NHIS patients with quality of health care at NHIS-accredited health facilities still remains poor, particularly with regard to the hesitation of unmotivated medical personnel, long waiting periods, separate treatment for NHIS-insured and non-NHIS-insured customers, quality of medications covered by NHIS, and some inadequate treatment methods.
Furthermore, in most cases, one cannot predict the onset of illness and the opportunity to demand medical services always keeps rising incidentally. It is difficult for clients to adhere to the above-mentioned treatments. They are faced with the alternative of finding greater coverage and care by heading to other nonNHIS health facilities willing to pay for treatment unless they are willing to leverage their personal link to access the services they require. The willingness to pay for a private insurance program would rely on the personality and socio-economic background of the person, as well as their capacity to manage and contribute to the scheme.
In Ghana, the NHIS Act, 2003 (Act 650) established two (2) forms of private health insurance schemes: Private Mutual Health Insurance Scheme (PMHIS) and Private Commercial Health Insurance Scheme (PCHIS) [5]. The PMHIS is defined as a health insurance scheme run solely for the benefit of its participants. PCHIS is defined as a health insurance that functions on the basis of profit-based business principles. The private health insurance scheme allows for the underwriting of all or any of duplicate, complementary and supplementary insurance policies.
Contingent valuation theory and observational research have demonstrated that experiments in developing countries may be conducted to extract accurate and credible health-related willingness to pay data [9]. Such a legitimate and accurate willingness to pay details to the target demographic will promote the design and implementation of the scheme. Generally, the ability to pay data is seldom obtained or used as part of the design of health insurance policies in developing countries [9]. Before the introduction of an independent secondary and tertiary health care system to complement the NHIS, there is a need to ascertain the specific needs of individuals, with respect to the health care plans, so that with the appropriate actuarial and statistical models, very good policies, tailor-made for them, can be developed. It is also important to look at market price reactions by people’s desire and capacity to pay. The focus of the study is to ascertain the ability and willingness of individuals to subscribe to and pay for the independent secondary and or tertiary health care plans and to determine factors that affect individual’s willingness to subscribe to the policy.
HEALTH CARE FINANCING IN GHANA
The Ghanaian health system has evolved over time. Before independence, healthcare was paid for out of pocket. After independence, the socialist government headed by Dr. Kwame Nkrumah sought to eliminate all obstacles of access to health care and to guarantee that all had access to health insurance irrespective of their socio-economic status. As such, consumer fees were eliminated and health insurance was now open to everyone and funded by general taxation and donation funding
The free health insurance that was part of the public agenda was also endorsed by the 1967 Arusha Agreement, which aimed to guarantee equal access to social services for the poor and those residing in impoverished rural areas. These entirely tax-funded insurance initiatives tried to fix some of the inequities in the nationwide provision of health services. Attention was paid to building a wide variety of primary health care services across the country, encouraging and supporting preventive initiatives such as immunization and antenatal care.
With the country’s economy crashing under extreme macroeconomic difficulties in the mid-1970’s, there was limited economic growth and the free healthcare policy was [5]. The problem has been worsened by an uncertain political climate by repeated military interference in government. This led to the implementation of usage fees in the mid-1970s and substantial hikes in the fees in the 1980’s. Again, this financing plan was inadequate to satisfy the growing need for the sector’s services. In reaction to these problems, the government launched a ‘cash and carry’ scheme in the mid-1980s. This framework saw the total elimination of government subsidy, with people charging the entire expense of health care. The fundamental principle underpinning the ‘cash and carry’ scheme was inevitably undermined when it, in effect, deprived the vulnerable and generated large disparities.
The quest for an appropriate financing mechanism contributed to Act 650 in 2003. The National Health Insurance Scheme (NHIS) was created by this Act. This was intended to remove all financial obstacles generated by earlier health reforms. The goal of the NHIS is to provide participants with access to health coverage without having to pay at the point of access and to provide affordable medical care. We present the historical creation of funding for health care in Ghana in Table 1.
THE NATIONAL HEALTH INSURANCE SCHEME (NHIS)
Ghana became the first sub-Saharan African nation to adopt NHIS in 2003 through an Act of parliament (ACT 650, Amended Act 852) and wasfully introduced in 2004. The NHIS was established to replace the cash and carry system of health care delivery, also known as the out-of-pocket (OOP) payment system. This scheme was set up with the aim of providing equal access and financial support of basic health care services to Ghanaians. Under NHIS, as amended by Act 852 (2012), every Ghanaian is required to participate in a health insurance scheme .
The NHIS funding comes from 2.5% Value Added Tax (VAT) levy on selected goods and services, 2.5% of workers Social Security and National Insurance Trust (SSNIT) contribution, parliamentary approval from the consolidated fund, donations, grants, gifts, and other charitable contributions, money that may accrue from the investment by the National Health Insurance council (NHIC) and from graduated premium contributions by those in the informal sector.
The NHIS does not seek to treat all diseases suffered by insured participants. However, many popular diseases such as malaria, upper respiratory tract infections and diarrheal diseases, are included in the NHIS benefits list. Likewise, NHISinsured participants are entitled to medical emergency treatment such as road traffic accidents. Also, under the free NHIS program for pregnant women, pregnant women are excluded from NHIS premium fees. Diseases such as cancers that are fairly rare are not covered by NHIS.
PRIVATE HEALTH INSURANCE SCHEME (PHIS)
The National Health Insurance Authority (NHIA), established under Act 650 is mandated by National Health Insurance Act, 2012 (Act 852) to regulate Private Health Insurance Schemes (PHIS) in Ghana. In carrying out its regulatory functions, the Authority shall register, authorize and supervise the operation of PHIS in Ghana. The law established two (2) types of private health insurance schemes: Private Mutual Health Insurance Scheme (PMHIS) and Private Commercial Health Insurance Scheme (PCHIS) [26]. The PMHIS is described as a health insurance scheme run solely for the benefit of its members. It may be community based, occupational as in associations or faith-based. PCHIS is characterized as a health insurance that operates on the basis of market principles for benefit.
The PHIS allows for the underwriting of all or any of duplicate, complementary and supplementary insurance policies. The duplicate allows for reproducing healthcare provision provided by the NHIS in which case an individual who opts for the PHIS is covered and taken care of by the NHIS. The complementary allows the PHIS to assist the NHIS benefit package by providing coverage for all or part of the cost of benefits not covered by the NHIS, in which case an individual can use either of the NHIS or the PHIS at any point in time. The supplementary allows PHIS to provide coverage for health services not covered by the NHIS, with the cost of the services being fully borne by the PHIS.
As at 2018, there were fourteen (14) licensed private commercial health insurance schemes in Ghana - Acacia Health Insurance, Ace Medical Insurance, Apex Health Insurance, Cosmopolitan Health Insurance, Beige Care Health Insurance, GLICO Healthcare, Kaiser Global Health, Liberty Medical Health Scheme, Metropolitan Health Insurance Ghana, NMH Nationwide Medical Health Insurance Scheme, Phoenix Health Insurance, Premier Health Insurance Company, Takaful Ghana Health Insurance and Vitality Health Systems [26].
METHODS
In this section, we present a brief description of study setting and the source of data. Thereafter, we introduce the response variable which is willingness to pay (wtp) for a private health policy. We will also describe potential determinants (predictors) of this response variable. This is followed by a description of the statistical methods that would be used to describe the relationship between the response variable and the predictors of the response variable.
Study setting and data source
The study was conducted in the Sunyani Municipality with the map shown in Figure 1.
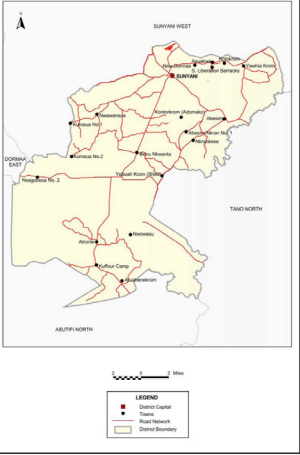
Figure 1: Map of Sunyani Municipality.
Sunyani Municipality is one of the twenty-seven (27) administrative districts in the Brong Ahafo Region of Ghana. It lies between latitudes 70 20’N and 70 05’N and longitudes 20 30’W and 20 10’W and shares boundaries with Sunyani West District to the North, Dormaa East District to the West, Asutifi District to the South and Tano North District to the East. The municipality has a total land area of 829.3 square kilometres (320.1 square miles).
The population of Sunyani Municipality, according to the 2010 Population and Housing Census is estimated at 123,224 with an annual growth rate of 3.8 percent [8]. The population density of the municipality is 148.6 persons per square kilometre (Assembly, 2017). The population in the municipality is generally concentrated in the three largest localities (Sunyani, Abesim and New Dormaa) which hold about 74.3 percent of the population, with only 25.7 percent distributed among the other settlements. Sunyani, the municipal capital, accommodates about 60% of the total population.
Residents of Sunyani Municipality were the population of interest for the study. An estimated population of 200,000 was used.
A multi-stage sampling technique was employed in this study. Simple random sampling was first used to choose 4 out of the 18 settlements in the municipality. Convenience sampling was then used to select 40 participants each from Sunyani and Abesim and 35 each from Fiapre and Odumase.
The research instrument employed in the collection of data was the survey questionnaire. The questionnaires had both close and open ended questions. Respondents were approached in the selected settlements to answer the questionnaires. English was used as a language medium in the administration of the questionnaire. For the literates, the questionnaires were self-administered. However, for the illiterates the questions were translated verbally to Twi (Ghanaian language) and their corresponding answers orally were documented in the questionnaires. The questionnaires were read thoroughly and explained comprehensively ensuring full understanding of every individual. To encourage truthful responses, the purpose of the study was briefly explained to the respondents and strict confidentiality was assured. Once completed, questionnaires were immediately collected.
The response variable of interest
As stated earlier, the response variable in this study is a dichotomous willingness to pay variable (which takes a value of 0 if an individual is not willing to pay or 1if an individual is willing to pay). The percentage distribution of this variable is presented in Table 1.
Table 1: Chronological development of health care financing in Ghana.
|
Year |
Event |
Rationale |
Features |
Sources of Financing |
Results |
|
1957 |
Using the British system as a framework for national health service |
Driven by early Economic performance, natural resources, and a strong export base |
- Everyone has the right to free health care
- Delivery of health care across a network of public-owned facilities |
General revenue |
Unsustainable with a downturn in economic results, the scheme proved to be too costly |
|
1985 |
Adoption of co-payments |
Co-payments for services |
-Co-payments for Services
-Delivery of health care across a network of government-owned facilities |
General revenue and usage fees |
Out-of-pocket usage pays from partial-to-full recovery |
|
1992 |
Installed cash-and-carry system |
-To increase funds for Providers
-To make the return of payments legitimate
-Restricting excessive use |
-Total treatment of medications
-Reduced costs for infants and health care services |
General revenue and usage fees |
Outpatient visits declined by 66% |
|
Early 1990s |
Voluntary mutual health insurance organization movement |
-Heavy cash-and-carry burden
-Lack of social protection mechanisms
-Lack of government oversight of the informal sector |
-Subsidization of the vulnerable by the better off
-Social protection against the impoverishing cost of illness |
-Donors such as the DANIDA and USAID
-Community |
-Reduced gap between those covered and those not covered
-Paved the way for spread of MHOs |
|
Early 2000s |
Profusion of mutual health organizations (MHOs) |
-Trend in other African countries
-Progress of early MHOs in Ghana
-Encouragement by the Ministry of Health |
-Spread across 67 out of 138 districts in 10 regions
-Diversity of organizational practices and rewards
-Based on district or Profession or religion or gender |
-Donors such as the DANIDA and USAID
-Community |
-Financial protection and access to health care for the vulnerable
-Plan for the representation of greater portions of the population |
|
2003 |
National mandatory health insurance reform |
-Relative success of the MHOs
-Agenda of the governing government (electoral platform) |
-Abolish cash and carry
-Introduction of mandatory health insurance
-Increase coverage inall districts by MHOs
|
-Nation health insurance levy (NHIL)-2.5% VAT
-2.5%ofSSNIT state budget transfers
-Returns on investment made by the National Insurance Council
-Voluntary contributions |
-National Health Insurance Council set up
-Introduction of interim administration arrangements
-Move toward 90 district mutual health schemes |
The predictors of the response variable
The status of the response variable is influenced by certain variables called predictors. These predictors determine the status of the response variable. The potential predictors of the response, introduce in this section, will be used to assess their influence on the status of the response variable. Some of the potential predictors of the response variable are age group (takes a value of 0 if a respondent is in 20-39 age group and 1 if 40 and above); gender (takes a value of 0 if male and 1 if female); level of education ( takes a value of 0 if informal and 1 if formal); occupation(takes a value of 0 if he/she works at the administrative sector, 1 if at the health sector, 2 if at the educational sector and 3 if working at any other sector relative to those mentioned);marital status recorded 0 if respondent is single or 1 if married; spouse employment status takes a value of 0 if yes and 1 if no. The study also investigated for the effects of frequent visitation to the hospital, National Health Insurance Scheme (NHIS) subscription, average amount spent on their family health care per annum, kind of service(s) to be covered if the policy is being initiated, range of payments for the policy per annum that suits their financial strength, a need for the private policy to complement the NHIS, ability to contribute to the independent health care plan through premiums, reason for opting for the policy is that it provides a wider range of health care provision. Table 1 presents percentage distribution of these potential predictors of the response variable Table 2.
Table 2: Percentage distribution of the response variable (willingness to pay) and predictors.
|
Variables |
N |
% (percent) |
|
Willingness to pay |
||
|
No Yes |
52 98 |
34.67 65.33 |
|
Age |
||
|
20-39 40 and above |
73 77 |
48.67 51.33 |
|
Gender |
||
|
Male Female |
105 45 |
70.00 30.00 |
|
Education |
||
|
Informal Formal |
40 110
|
26.67 73.33 |
|
Occupation |
||
|
Administration Health Education Others |
58 36 27 29 |
38.67 24.00 18.00 19.33 |
|
Marital status |
||
|
Single Married
|
43 107
|
28.67 71.33
|
|
Spouse employed |
|
|
|
Yes No |
77 33 |
70.00 30.00 |
|
Frequency visitation to the hospital per annum |
||
|
1 and 2 3 and 4 5 and above |
82 43 22 |
55.78 29.25 14.97 |
|
NHIS subscription |
||
|
Yes No |
130 20 |
86.67 13.33 |
|
Average amount spent on family health per annum |
||
|
0-499 500-1000 1000 and above |
36 56 58 |
24.00 37.33 38.67 |
|
Health service(s) to be covered under the private health policy |
||
|
Photography |
||
|
Yes No |
79 71 |
52.67 47.33 |
|
Medical examinations |
||
|
Yes No |
79 71 |
52.67 47.33 |
|
Cancer treatment other than cervical and breast cancer |
||
|
Yes No |
68 82 |
45.33 54.67 |
|
Organ surgery (Heart, Brain, Kidney, etc.) |
||
|
Yes No |
96 54 |
64.00 36.00 |
|
Mortuary services |
||
|
Yes No |
32 118 |
21.33 78.67 |
|
Rehabilitation other than physiotherapy |
||
|
Yes No |
41 109 |
27.33 72.67 |
|
VIP ward accommodation |
||
|
Yes No |
102 48 |
68.00 32.00 |
|
HIV antiretroviral medicines |
||
|
Yes No |
17 133 |
11.33 88.67 |
|
Range of payment for the policy per annum per your financial strength |
||
|
Below 500 500-999 1000-1499 1500-1999 2000 and above |
15 45 64 18 8 |
10.00 30.00 42.67 12.00 5.33 |
|
Private health policy to complement NHIS |
||
|
Yes No |
129 21 |
86.00 14.00 |
|
Ability to contribute for the policy through payment of premiums |
||
|
Yes No |
108 42 |
72.00 28.00 |
|
Private policy provides wider range of health care provision |
||
|
Yes No |
135 15 |
90.00 10.00 |
|
Private health policy should be made optional and not mandatory |
||
|
Yes No |
141 9 |
94.00 6.00 |
|
Add on parents to the private health policy as dependents |
||
|
Yes No |
104 46 |
69.33 30.67 |
The percentage distributions of the variables in the Table 1 showed higher proportion (65.33%) of respondents willing to pay for private health policy and majority of these respondents (51.33%) are aged 40 and above and 70% of them males. Approximately 73% of the respondents have received formal education, 39% of the respondents work in the administrative sector. Majority (71.33%) of the respondents are married and 70% of the spouses are employed. The percentage distributions showed that approximately 56% of the respondents do visit the hospital (1-2 times) per annum, 86.67% of them subscribed for NHIS and majority (38.67%) of these respondents spend 1000 and above on their family health care per annum. Respondents chose health service(s) they prefer to be covered under the policy, approximately 53% preferred to be covered for photography, approximately 53% also preferred to be covered under medical examination, most respondents (54.67%) also did not prefer to be covered for cancer treatment other than cervical and breast cancer, many (64%) also opted to be covered for organ surgery (Heart, Brain, Kidney, etc.), approximately 79% of the respondents did not prefer to be covered for mortuary services, 72.67% did not also want policy for rehabilitation other than physiotherapy, 68% preferred VIP ward accommodation and large proportion (88.67%) did not want to be covered for HIV antiretroviral medicines. Majority (42.67%) were willing to pay for the private policy within the range of GHC1000-1499 per their financial strength, most (86%) opined that there was the need for a private health policy to complement the NHIS, 72% of these respondents had the ability to contribute for the private health policy through payment of premiums, large proportion (90%) thought that the policy provided a wider range of health care provision, majority (94%) of the respondents thought the private health should be made optional and not mandatory and 69.31% wished to add on parents to the private health policy as dependents
Statistical analyses
The purpose of this section is to describe the form of the statistical method (logistic regression model) [5-10,27,28] that would be used to establish the relationship between the response variable and the predictors and also, to estimate the effects of the predictor variables on the response variable.
The general form of the logistic regression model [6-10,28] can be written as
where are the risk predictors;
are the coefficients of regression. These coefficients represent the magnitude and direction of the effects of X design matrix of the predictors on the dichotomous response variable
and
is a vector of the regression coefficients. The p in equation (1) represents the probability that a person is willing to pay and
is the odds of the response variable among respondents who are exposed to the predictors compared with those who are not exposed to the same predictors. This implies that β is the log odds ratio of the willingness to pay status for those who are exposed to the predictors relative to those who are not exposed [11]. This statistical method is implemented to the willingness to pay data using STATA version 14.1 software [12-16] for estimation of the regression coefficients.
The model (1) is used to estimate the predicted response probability for an individual. We determined the predicted probability using the back-transformation defined as individuals into those who are actually willing to pay or not willing to pay group [17,18]. Individuals are classified into either group based on a ``threshold” value, determined by the researcher. In this way, if 0 pˆ ≥ π an individual is classified into willingness to pay group and if 0 pˆ < π then an individual is classified into not willing to pay group. For instance, if π0 = 0.5 if individuals have same chance of being classified into either of the two groups. The threshhold value π0 can be determined from the observed data with the aim of minimizing the overall proportion of misclassification or to avoid/minimize the probability of assigning an individual to willingness to pay when such individual should have actually been assigned to the not willing to pay group and vice versa. In Table 3, we summarized the relationship between the true situation and the prediction [17,18].
Given the summaries in Table 3,
Table 3: Prediction and classification of willingness to pay status.
|
Prediction |
Willing to pay |
Not willing to pay |
Total predictions |
|
Positive prediction |
TRUE +Ve (a) |
FALSE +Ve (b) |
Number of +Ve predictions (a+b) |
|
Negative prediction
TRUE totals |
FALSE -Ve (c)
Willing to pay (a+c) |
TRUE -Ve (d)
Not willing to pay (b+d) |
Number of -Ve predictions (c+d) |
pˆ ≥ π classifies individual as willing to pay and 0 p <ˆ π as not willing to pay, the number of positive predictions will increase as the threshold decreases. This implies that sensitivity will increase with decreasing threshold value and 1-specificity will increase with decreasing threshold π 0 value. Whenever sensitivity and 1- specificity are equal, the proportion of positive prediction given that an individual is not willing to pay is also equal to the proportion of positive prediction given that an individual is willing to pay. When this happens, the model is said to have no predictive power. Models with high predictive power are characterized with higher sensitivity relative to 1-specificity. More often, we prefer that sensitivity increases much faster than 1-specificity as π0 varied 1 towards 0.
we define two terminologies of classification known as sensitivity and specificity [17,18]. Sensitivity (SEN) is defined as the proportions of individuals who are willing to pay given that they are actually willing to pay. This means that sensitivity can alternatively be defined as 100 a a c × + using the definitions in Table 3. On the other hand, we defined specificity (SPEC) as the proportions of individuals who are not willing to pay given that they are classified as those who are actually not willing to pay. This implies that, we can alternatively define specificity as 100 d b d × + [5]. We now define the two misclassification situations as b/(b+d) = 1-SPEC; which gives the proportions of positive predictions given that an individual is not willing to pay and c/(a+c)= 1-SEN; which gives the proportions of negative predictions given that an individual is willing to pay.
Prediction and classification methods are commonly used in disease status prediction and classification. One of these misclassification probabilities may be more serious than the other given the nature of the disease being considered. Some examples of such diseases are HIV/AIDS and chronic illness. In this instance, specificity will be more serious than sensitivity since individuals who actually have the disease (and need treatment or much attention) will be classified as negative and hence will not be given treatment due to the disease which will in turn deteriorate their conditions more rapidly. It is a common practice to focus on minimizing the probability of false negative which leads to maximizing sensitivity.
We evaluate the predictive power of the model fitted to the willingness data using the Receiver Operating Characteristic (ROC) curve [19,20]. The ROC curve is graphs of sensitivity versus 1-specificity with varying threshold value π 0 . Since pˆ ≥ π classifies individual as willing to pay and 0 p <ˆ π as not willing to pay, the number of positive predictions will increase as the threshold decreases. This implies that sensitivity will increase with decreasing threshold value and 1-specificity will increase with decreasing threshold π 0 value. Whenever sensitivity and 1- specificity are equal, the proportion of positive prediction given that an individual is not willing to pay is also equal to the proportion of positive prediction given that an individual is willing to pay. When this happens, the model is said to have no predictive power. Models with high predictive power are characterized with higher sensitivity relative to 1-specificity. More often, we prefer that sensitivity increases much faster than 1-specificity as π0 varied 1 towards 0.
RESULTS
The purpose of this section is to present and provide interpretation of the results from logistic regression model fitted to the willingness to pay data. The Table 4
Table 4: Unadjusted and adjusted log odds ratios and 95% confidence interval (95%CI): logistic regression model.
|
Unadjusted odds ratio Adjusted odds ratio |
||
|
Covariates |
Log odds ratio95% CI
|
Log odds ratio 95% CI
|
|
Age |
||
|
20-39 40 and above |
1 (reference) 0.50 ( -0.074, 1.079 ) |
1 (reference) 1.06 (-0.043, 2.163) |
|
Gender |
||
|
Male Female |
1 (reference) -0.06 (-0.787, 0.676) |
1 (reference) 0.25 (-0.984, 1.491) |
|
Education |
||
|
Informal Formal |
1 (reference) -0.13 (-0.900, 0.637) |
1 (reference) 0.72 (-0.805, 2.255) |
|
Occupation |
||
|
Administration Health Education Others |
1 (reference) 0.11 (-0.318, 0.540) 0.11 (-0.204, 0.434) 0.25 (-0.011, 0.509) |
1 (reference) 0.30 (-0.452, 1.057) 0.05 (-0.449, 0.557) 0.45 (-0.008, 0.910) |
|
Marital status |
||
|
Single Married
|
1 (reference) 0.04 (-0.469, 0.397)
|
1 (reference) -0.28 (-1.943, 1.379)
|
|
Spouse employed |
||
|
Yes No |
1 (reference) 1.08 (0.130, 2.025) |
1 (reference) 1.68 (0.324, 3.027) |
|
Frequency of visitation to the hospital |
||
|
1-2 3-4 5 and above |
1 (reference) 0.15 (-0.256, 0.547) -0.22 (-0.535, 0.097) |
1 (reference) -0.29 (-0.957, 0.369) -0.37 (-0.927, 0.186) |
|
NHIS subscription |
||
|
Yes No |
1 (reference) 0.25 (-0.777, 1.267) |
1 (reference) 0.19 (-1.237, 1.627) |
|
Average amount spent on family health care per annum |
||
|
0-499 500-1000 1000 and above |
1 (reference) 0.01 (-0.457, 0.430) 0.04 (-0.334, 0.250) |
1 (reference) -0.10 (-0.921, 0.719) -0.20 (-0.762, 0.355) |
|
Health service(s) to be covered under the private health policy |
||
|
Photography |
||
|
Yes No |
1 (reference) -0.28 (-0.956, 0.392) |
1 (reference) -0.33 (-1.382, 0.728) |
|
Medical Examination |
||
|
Yes No |
1 (reference) 0.07 (-0.602, 0.746) |
1 (reference) -0.03 (-1.205, 1.137) |
|
Cancer treatment other than cervical and breast cancer |
||
|
Yes No |
1 (reference) -0.19 (-0.866, 0.491) |
1 (reference) 0.05 (-1.007, 1.000) |
|
Organ surgery ( Heart, Brain, Kidney, etc. ) |
||
|
Yes No |
1 (reference) -0.29 (-0.983, 0.406) |
1 (reference) 0.13 (-0.990, 1.261) |
|
Mortuary services |
||
|
Yes No |
1 (reference) 0.99 (0.190, 1.787) |
1 (reference) 0.96 (-0.356, 2.281) |
|
Rehabilitation other than physiotherapy |
||
|
Yes No |
1 (reference) -0.03 (-0.788, 0.725) |
1 (reference) -0.12 (-1.249, 1.007) |
|
VIP ward accommodation |
||
|
Yes No |
1 (reference) -0.31 (-1.026, 0.397) |
1 (reference) -0.22 (-1.336, 0.893) |
|
HIV antiretroviral medicines |
||
|
Yes No |
1 (reference) 0.03 (-1.026, 1.088) |
1 (reference) -0.61 (-2.538, 1.325) |
|
Range of payment for the policy per annum per your financial strength |
||
|
Below 500 500-999 1000-1499 1500-1999 2000 and above |
1 (reference) -0.97 (0.713, 0.518) 0.03 (0.367, 0.421) -5.47 (-0.367, 0.367) -0.14 (-0.490, 0.212)
|
1 (reference) -0.08 (-1.365, 1.211) 0.09 (-0.771, 0.954) 0.02 (-0.675, 0.721) -0.04 (-0.712, 0.632) |
|
Private health policy to complement NHIS |
||
|
Yes No |
1 (reference) 0.07 (-0.908, 1.046) |
1 (reference) 0.14 (-1.387, 1.674) |
|
Ability to contribute for the policy through payment of premiums |
||
|
Yes No |
1 (reference) -0.91 (-1.644, -0.175) |
1 (reference) -1.58 (-2.757, -0.400) |
|
Private policy provides wider range of health care provision |
||
|
Yes No |
1 (reference) 0.42 (-0.781, 1.614) |
1 (reference) 0.81 (-1.791, 3.415) |
|
Private health policy should be made optional and not mandatory |
||
|
Yes No |
1 (reference) 0.06 (-1.365, 1.492) |
1 (reference) 0.19 (-1.748, 2.124) |
|
Add on parents to the private health policy as dependents |
||
|
Yes No |
1 (reference) 0.73 (-0.055, 1.511) |
1 (reference) 0.78 ( -0.523, 2.081) |
presents the unadjusted and adjusted log odds ratios of the regression coefficients from this logistic regression model.
We found that respondents aged 40 and above are more likely to pay for private health policy relative to those aged from 20 to 39. This might be due to the fact that most of the active working force is from 40years and above. There is an increase in the log odds ratio of willingness to pay among females relative to males. The results revealed that those in the health and educational sectors and other occupations are likely to pay for the private health policy compared to those in the administrative sector. Also, there is increased in the log odds of willingness to pay among respondents who are married relative to respondents who are single. The adjusted log odds ratio reveals the opposite. Visiting the hospital 3-4 times per annum increases the log odds of willingness to pay and those with 5 times and above per annum have a reduced log odds relative to those who visit 1-2 times per annum. Adjusted odds ratio results showed reduction in the log odds of willingness to pay among those whose visit hospital more than 3-4 and 5 and above times relative to those who visit 1-2 times. Also, respondents who have not subscribed to the National Health Insurance Scheme are more likely to pay for the private health policy relative to those who have subscribed. Respondents’ amount spent on family health per annum is not influenced by their willingness to pay. Respondents who do not want to be covered under the health services such as photography, medical examinations, and rehabilitation other than physiotherapy and VIP ward accommodation are less likely to pay for the private health policy. Respondents who do not want to be covered for mortuary services and HIV antiretroviral medicines are more likely to pay for the private health policy.
There is increase in the log odds of willingness to pay among those who are willing to pay between GHC 000-1999 for private health policy relative to 500. This seems to suggest that people are willing to pay for private health policy within a range of GHC1000-1999 which suits their financial strength. The results also showed that respondents who feel that private health policy do not complement the NHIS are more likely to pay. There is significant increase in the log odds of willingness to pay among spouses who are not employed relative to those spouses not employed. Respondents who do not have the ability to contribute for the private health policy are significantly less likely to pay for the private health policy compared to those who have the ability to contribute.
Assessing the predictive power of the Model
Here we assess the predictive power of the fitted logistic regression model using the Receiver Operating Characteristics (ROC) curve discussed in Section 5.4. We first determine the cutoff π0 value using the Figure 2.
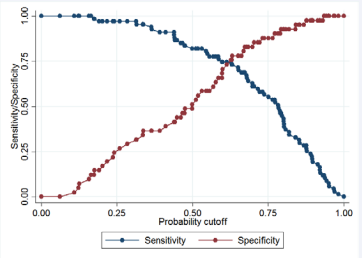
Figure 2: A graph of Sensitivity and Specifity versus different cut-off values..
In this study, when π0 = 0.50 sensitivity is 77% and specificity is 50%; and with π0 = 0.75, sensitivity (55%) is lower and specificity (89%) is higher. This gives an indication that sensitivity increases with decreasing threshold π0 value. In this study, the threshold value is 0.25 with 97.01% sensitivity and 26.83% specificity as 26.83% to produce the classification results presented in Table 5.
Table 5: Prediction and classification of willingness to pay status.
|
Prediction |
Willing to pay (B) |
Not willing to pay (∼B) |
Totals |
|
+Ve |
65 |
30 |
95
|
|
-Ve |
2 |
11 |
13
|
|
Totals |
67 |
41 |
108 |
|
Sensitivity |
Pr(+ | B) |
97.01%
|
|
|
Specificity |
Pr(− |∼B) |
26.83%
|
|
|
Positive predictive value
Negative predictive value |
Pr(B | +)
Pr(~B|-) |
68.42%
84.62%
|
|
|
False + rate for true ∼B |
Pr(+|∼B) |
73.17%
|
|
|
False - rate for true B |
Pr(−|B) |
2.99% |
|
|
False + rate for classified |
Pr(∼B|+) |
31.58%
|
|
|
False - rate for classified |
Pr(B|−) |
15.38% |
Specifically, these results give an indication that the probability that an individual will pay given that such individual actually pay is 97.01% and the probability that an individual did not pays given that such individual actually pays) is 26.83%. Positive and negative predictive values are 68.42% and 84.62% respectively.
We used the Figure 3 to assess the predictive power of the model. This graph displays the ROC curve which estimates the area under the curve. When sensitivity = 1-specificity, the area under the ROC curve is 50%, implying that model has no predictive power. On the other hand, if sensitivity increases faster than 1-specificity, ROC curve will be more “bowed” and hence is said to have predictive power. The ROC curve displayed in Figure 3 showed that the area under the ROC curve is approximately 80%, indicating that the model has higher predictive power.
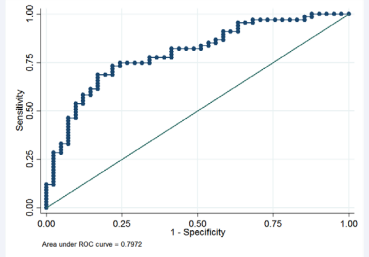
Figure 3: Graph of sensitivity versus 1-specificity.
DISCUSSION AND CONCLUSION
This paper investigated the effects of some selected potential determinants on willingness to pay for private health policy. The response variable is willingness to pay, which is dichotomous variable coded as 1 if a person is willing to pay or 0 if a person is not willing to pay. This study took place in the Sunyani Municipality, Bono Region of Ghana. Respondents were selected using a multi-stage sampling approach. This is a crosssectional study where data on 150 respondents were collected using a structured questionnaire. We evaluated the effects of the potential risk factors on the response variable using a logistic regression model under the Frequentist [6,7,11,20-24,27] We implemented the logistic regression model to the willingness to pay data using STATA version 14.1.
The study results showed that people who are 20-39 years, married, males, un-insured, in health and educational sectors, who visit hospital 3-4 times per annum, are more likely to pay for private health policy. Also, people are more likely to pay GHC1000-1999 for private health policy to ensure that they enjoy conditions that the National Health Insurance does not cover. We found that spouses who are not employed are more willing to pay for the private health policy. This was found to be statistically significant. Respondents who do not have the ability to contribute for the private health policy are highly less willing to pay for the private health policy compared to those who have the ability to contribute. This result shows that respondents can afford an amount if they have the ability to contribute for the private health policy through premiums.
Based on our results, we conclude that majority (65.33%) of the respondents are willing to pay for a private health policy, spouse not employed and those who have the ability to contribute for the private health policy were statistically significantly more willing to pay for private health policy. Further studies on this topic should be extended to cover the whole Bono Region or all regions in Ghana, which requires enough funding and more personnel for data collection. Private health policies should be extended to residents in Sunyani Municipality since most of our respondents are willing to pay to enjoy conditions that are not covered under the national health insurance scheme. The policy should be modeled for members whose spouse are not employed and also has the ability to contribute for the policy.
REFERENCES
- Anderson TJ, Saman DM, Lipsky MS, Lutfiyya MN. A cross-sectional study on health differences between rural and non-rural US counties using the County Health Rankings. BMC Health Serv Res. 2015; 15: 441.
- Skillman SM, Doescher MP, Mouradian WE, Brunson DK. The challenge to delivering oral health services in rural America. Journal of Public Health Dentistry. 2010; 70: S49-S57.
- Ghana Statistical Service. 2010 Population and Housing Census, District Analytical Report. Ghana Stat Serv. 2014
- Kusi A, Hansen KS, Asante FA, Enemark U. Does the National Health Insurance Scheme provide financial protection to households in Ghana? BMC Health Serv Res. 2015.
- Hand DJ, Collett D. Modelling Binary Data. Appl Stat. 2006.
- Hosmer DW, Lemeshow S. Applied Logistic Regression ( 2nd ed ). 2002.
- Scott AJ, Hosmer DW, Lemeshow S. Applied Logistic Regression. Biometrics. 2006.
- Spitznagel EL. “6 Logistic Regression,” Handbook of Statistics. 2007.
- Hosmer DW, Lemeshow S. Goodness of fit tests for the multiple logistic regression model. Commun Stat - Theory Methods. 1980.
- Ziegel ER, Menard S. Applied Logistic Regression Analysis. Technometrics. 1996.
- Iddrisu AK, Bukari FK, Opoku-Ameyaw K, Afriyie GO, Tawiah K. Factors That Determine the Likelihood of Giving Birth to the First Child within 10 Months after Marriage. J Pregnancy. 2020.
- StataCorp. Stata Statistical Software: Release 151 College Station, TX: StataCorp LP. 2015.
- StataCorp. Stata: Release 13 Statistical Software 2013.
- StataCorp. Stata Statistical Software: Release 13. 2015.
- Copyright 1985-2011 StataCorp LP, “Stata Statistical Software: Release 12,” 2011.
- StataCorp. Stata: Release 13 Statistical Software 2013.
- Collett D. Modelling survival data in Modelling Survival Data in Medical Research, Springer. 1994; 53-106.
- G van Belle, Fisher LD, Heagerty PJ, Lumley T. A Methodology for the Health Sciences. John Wiley & Son, Inc. 2004.
- Kumar R, Indrayan A. Receiver operating characteristic (ROC) curve for medical researchers,” Indian Pediatr. 2011; 48: 277-287.
- Gonçalves, Subtil A, Rosário Oliveira M, Bermudez PDZ. ROC curve estimation: An overview. Revstat Stat J. 2014.
- Abdul-Karim I, Dominic O, Bashiru M. Investigating the determinants of maternal care services utilization in the Brong Ahafo region of Ghana. Open J Stat. 2019; 9: 927-940.
- Hosmer Jr DW, Lemeshow S, Sturdivant RX. Applied logistic regression. John Wiley & Sons, 2013; 398.
- Iddrisu AK, Opoku-Ameyaw K, Bukari FK, Mahama B, Akooti A. HIV Testing Decision and Determining Factors in Ghana,” World J AIDS. 2019; 9: 85-104.
- Menard S.Applied logistic regression analysis. Sage. 2002; 106.
- Spiegelhalter DJ, Best NG, Carlin BP, Van Der Linde A. Bayesian measures of model complexity and fit. J R Stat Soc Ser B Stat Methodol. 2002.
- Ministry of Health. National Health Insurance Policy Framework for Ghana. 2004.
- Iddrisu AK, Otoo D, Mahama B. Investigating the Determinants of Maternal Care Services Utilization in the Brong Ahafo Region of Ghana. Open J Stat. 2019.
- Allison PD. Logistic Regression Using SAS: Theory and Application. 2012.


