Development and Evaluation of Nanoemulsion of Repaglinide
- 1. Department of Pharmaceutics, KLE College of Pharmacy, India
- 2. Drug Delivery Excellent Center, Faculty of Pharmacy, Prince of Songkla University, Thailand
- 3. Department of Pharmaceutics, Modern College of Pharmacy, India
Abstract
The oil-in-water Nanoemulsion (NE) for antidiabetic activity developed by the spontaneous emulsification method by using different ratio of span80 (surfactant), tween80 (co-surfactant), olive oil (oil), acetone (solvent) and water. The nanoemulsion area was identified by constructing pseudoternary phase diagrams by using different ratio of oil, surfactant/co-surfactant and water, six formulations were optimized. The prepared nanoemulsion was subjected to IR spectroscopy and DSC for compatibility study, which was compatible for tests. The nanoemulsion formulations that passed tests were characterized for viscosity, droplet size, zeta potential, Polydispersity index, scanning electron microscopy and in vitro study was carried out in USP dissolution paddle type apparatus. The release kinetics was studied and stability study as per ICH guidelines was also carried out for 3 months. Release kinetics was found to follow the Higuchi diffusion model. The antidiabetic activity of nanoemulsion showed a significant reduction in glucose level at 2, 4 and 6 hrs with oral administration, reflecting severe hypoglycemia in initial hours after administration. AUC, Cmax and tmax study was also carried out. Amongst the all six formulations, the F1 and F5 showed the best area for formation of nanoemulsion. These results suggested that formulations F1 and F5 are suitable for oral administration as antidiabetic agents.
Keywords
Nanoemulsion for antidiabetic activity ,Nanoemulsion , O/W Nanoemulsion, Repaglinide, Antidiabetic activity
Citation
Nanjwade BK, Varia PJ, Kadam VT, Srichana T, Kamble MS (2013) Development and Evaluation of Nanoemulsion of Repaglinide. JSM Nanotechnol Nanomed 1(2): 1016.
ABBREVIATIONS
NE: NanoEmulsion; MPBS: Methanolic Phosphate Buffer Saline; IR: Infrared; UV-Vis: Ultra Violet Visible: SEM: Scanning Electron Microscopy; TEM: Transmission Electron Microscopy;Tc: Transition temperature; DSC: Differential Scanning Colorimetry; ZP: Zeta Potential; Conc.: Concentration; CDR:Cumulative Drug Release; °C: Degree Centigrade; µg: micro gram; gm: Gram; ml: Milliliter; min: Minute; hrs: Hours; λmax: Absorption maxima; Sr.: Serial; No.: Number; RPM: Revolution Per Minute; SQRT: Square Root Time.
INTRODUCTION
Repaglinide, an oral blood glucose lowering agent, exhibits low solubility in water, which leads to poor bioavailability (BA), high intra-and inter-subject variability, and lack of dose proportionality. Low hydrophilicity of any drug affects the absorption rate so it is necessary to develop suitable formulations with enhanced solubility and bioavailability. One of the most popular and commercially viable formulation approaches for solving these problems is nanoemulsion which has attracted considerable attention from pharmaceutical scientists who want to increase the oral bioavailability of such poorly water-soluble drugs [1,2]. Emulsions are part of two-phase systems of matter called Colloids. The terms colloid and emulsion are sometimes used interchangeably, but an emulsion is used when both the dispersed and the continuous phase are liquid. Nanoemulsions are the multiphase colloidal dispersions and separate from macro and micro emulsions [3].
Submicron emulsions comprises of nanometric droplet size which is only a non-equilibrium system unlike thermodynamically spontaneous microemulsion [4]. Microemulsions are optically isotropic, transparent or translucent, low-viscous, single-phase liquid solutions. They are thermodynamically stable bicontinuous systems, which consist of water, oil, surfactant and co-surfactant [5,6]. Microemulsions exhibit greater solubilizing capacities for both hydrophilic and lipophilic drugs than micellar solutions, e.g. Sandimmun Optoral® and Neoral® preconcentrate [7]. Due to the high surfactant concentration in microemulsions they are usually limited to dermal and peroral applications [8]. Many formulation scientists have investigated skin permeation mechanism of many drugs using chemical enhancers and microemulsion technique [9]. Unlike microemulsions, nanoemulsions are metastable systems, whose structure depends on the process used to prepare them. Nanoemulsions are thermodynamically stable transparent dispersions of oil and water stabilized by an interfacial film of surfactant and cosurfactant molecules having a droplet size of less than 100 nm. Nanoemulsion has been widely used in pharmaceutics, cosmetics and it also plays important role as reaction template for synthesis of polymer dispersions and nanoparticles, because of the controllable droplet size, relatively long-term stability and powerful solubilization ability and so on [10].
In the 1950’s, nanoemulsions were introduced for the purpose of parenteral nutrition [11]. In order to produce nanoemulsions an energy input is necessary and the obtained liquid-in-liquid dispersion is thermodynamically unstable [12]. Nanoemulsions have been used since some decades as drug carriers for lipophilic actives. Several pharmaceutical products based on nanoemulsion system have been introduced to the market e.g. Etomidat Lipuro®, Diazepam Lipuro®, Disoprivan®, Stesolid® and Lipotalon® [13,14].
The benefits of nanoemulsions over solubilization-based formulations (microemulsions) in terms of drug delivery are the reduction of the local and systemic side effects, e.g. reducing pain during injection and hemolytic activity caused by the high emulsifying agent concentration in the solubilization-based formulation [15]. However, the lipophilic loaded drug can partition between the oil droplets and the aqueous medium and hence, stability problems arise [16]. Moreover, the possibility of controlled drug release from nanoemulsions is limited due to the high mobility of the loaded drug which is dissolved in the oily phase. In several studies a rapid release of the drug from its carrier system (nanoemulsion) was reported [17].
MATERIALS AND METHODS
Repaglinide was obtained as gift sample from Sun Pharmaceutical (Gujarat, India). Span80 (High Purity Laboratory Chemical Pvt ltd. Mumbai, India), Tween 80 (Loba Chemie. P.LTD Mumbai, India), Acetone (Thermo Fisher Scientific India PVT, LTD. Mumbai, India), Olive oil (Molychem. Mumbai, India) were purchased freshly. All other chemicals and reagents used in the study were of analytical reagent grade [18-22]
A homogeneous organic solution (S1) composed of olive oil and a lipophilic surfactant Span 80 in water miscible solvent acetone was prepared. The homogeneous aqueous phase (S2) was formed by water and hydrophilic surfactant Tween 80. The organic phase was injected in the aqueous phase under homogenizer; this led to instantaneous formation of an o/w emulsion by diffusion of the organic solvent in the external aqueous phase and subsequent formation of Nanodroplets. The homogenizer was maintained at 8000 rpm during 30min. The water miscible solvent was totally removed by evaporation during under reduced pressure for 45min. Nanodroplets of oil were dispersed in an aqueous solution of water and hydrophilic surfactant as shown in (Table 1).
Table 1: The composition of formulations.
| Sr No. | Formulation Code | Olive oil (%) | Surfactant mixer (45%) | Solvent (Acetone) (%) | Water(%) | |
| Span 80(%) | Tween 80(%) | |||||
| 1 | F1 | 5 | 3 | 1 | 33 | 50 |
| 2 | F2 | 10 | 3 | 1 | 33 | 45 |
| 3 | F3 | 15 | 3 | 1 | 33 | 40 |
| 4 | F4 | 5 | 4 | 1 | 33 | 50 |
| 5 | F5 | 10 | 4 | 1 | 33 | 45 |
| 6 | F6 | 15 | 4 | 1 | 33 | 40 |
On the basis of solubility studies, olive oil was chosen as the oil phase, Span 80 and Tween 80 were selected as lipophilic surfactant and hydrophilic surfactant respectively. Construction of phase diagram was done by using aqueous phase of standard buffer solution (pH 5). Oil, surfactants and cosurfactants were divided into different groups to carry out phase studies. Surfactant and cosurfactants (Smix) were mixed in different weight ratios. These ratios were selected in increasing concentration of surfactant with cosurfactants. For each phase diagram, oil and Smix mixed at specific ratio of different mass ratios from 1 to 9 and 9 to1. Nine different ratios of oil and Smix (1:9, 2:8, 3:7, 4:6, 5:5, 6:4, 7:3, 8:2, 9:1) were selected to cover the maximum ratios for the study to delineate the boundaries of phases precisely formed in the phase diagrams. Aqueous titration method was used to develop the pseudo-ternary phase diagrams. Slow titration with aqueous phase was carried for each weight ratio of oil and Smix and visual observations were made for transparent and easily flowable Nanoemulsions. On a pseudo three component phase diagram, the physical state of nanoemulsion were marked with one axis of aqueous phase, oil phase and mixture of surfactant and cosurfactant (Smix ratios) at fixed weight ratios [23,24]. From each phase diagram, constructed, various formulations were selected from nanoemulsion region so that drug could be incorporated into the oil phase.
The application of infrared spectroscopy lies more in the qualitative identification of substances either in pure form or in the mixtures and as a tool in establishment of the structure. Infrared data was helpful to confirm the identity of the drug and to detect the interaction of the drug with the polymers.
Differential Scanning Calorimetry (DSC) analysis was conducted to ascertain the compatibility of drug with the surfactant and oil using Mettler Toledo DSC 822 (STIC, Cochin, and India). Drug loaded Repaglinide nanoemulsion was frozen in liquid nitrogen and lyophilized. The coolant was liquid nitrogen [25,26]. The samples were scanned at rate 10 °C/min, from 10 °C to 230 °C. An empty aluminum pan was used as reference. The obtained DSC thermo grams are shown in (Figure 1).
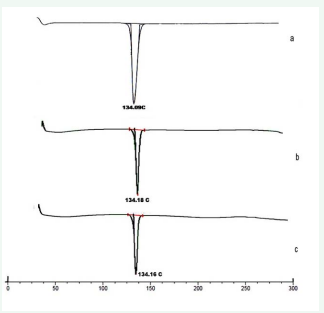
Figure 1 DSC thermogram of pure Repaglinide (a), DSC of Formulation-1 (b), DSC of Formulation-5(c).
Nanotrac were used to measure the particle size and size distribution of different batches of formulation [23-27]. Particle size of different batches of nanoemulsion was determined by dynamic scattering particle size analyzer (Nanotrac Particle Analyzer 150, Microtrac Inc., PA, USA). The range of the analyzer was 0.8 nm to 6.54 µm. Zeta potential was measured by using Zetatrac [28-30]. The formulations were diluted with double distilled water to determine the zeta potential.
The flow properties and the viscosity of the systems were determined at 32 ± 1 °C. Viscosity determinations employed a DV III cone and plate Brookfield viscometer (Brookfield Engineering Laboratories Inc., Stoughton, MA, USA), fitted with CP-4 spindle [31-32].The viscosity of nanoemulsion shown in (Table 2).
Polydispersity index (PI) is a measure of particle homogenicity and it varies from 0.0 to 1.0. The closer to zero the Polydispersity value the more homogenous are the particles [31- 32].Formulations shown their PI results in (Table 2)
Table 2: Polydispersity Index, Zeta Potential, Viscosity, pH and in vitro drug release study of Formulation 1 to 6
| Formulation | Polydispersity index | Zeta potential (mV) | Viscosity (cps) | pH | Drug release (%) |
| F1 | 0.134 | -44 ±1.2 | 108× |
7.67 | 89.80303 |
| F2 | 0.219 | -32 ±1.6 | 116× |
7.45 | 64.321212 |
| F3 | 0.221 | -30 ±1.9 | 124× |
7.38 | 57.42 |
| F4 | 0.322 | -26 ±1.4 | 135× |
7.49 | 58.354545 |
| F5 | 0.171 | -41 ±0.9 | 111× |
7.58 | 83.769697 |
| F6 | 0.339 | -25 ±1.7 | 159× |
7.42 | 46.593939 |
The concentration of Repaglinide in μg/ml was obtained by using standard calibration curve of the drug. Drug content studies were carried out for each formulation batch [32].
SEM was used for the size analysis, topographical and elemental information by using magnifications up to 10X to 100,000X. A concentrated aqueous dispersion of nanoparticles was finely spread over a slab and dried under vacuum. The sample was shadowed in a cathodic evaporator with a gold layer (20 nm thick). The surface morphology of the nanoparticles was observed by SEM using a JSM-6400 scanning electron microscope [33,34]. The image of SEM of nanoemulsion is shown in (Figure 2).
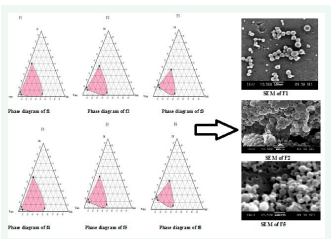
Figure 2: Phase Diagram Study of F1 to F6 with SEM of F1, F2 and F5.
In vitro release studies were carried out using tablet USP XXIII dissolution test apparatus. The dissolution study, by using USP paddle Type Dissolution Apparatus was carried out at 37 ± 50 C at 100 rpm frequency of the paddle. 900ml of 0.1N HCL and 900 ml of MIPB of pH 7.4 were used as the dissolution media. The dried power of nanoemulsion was filled in empty capsule and then placed in a jar. Samples were withdrawn at different time intervals and then analyzed using a UV Spectrophotometer at 238 nm against blank [23-35]. The resulted values were tabulated in (Table 2) and the release pattern shown in (Figure 3).
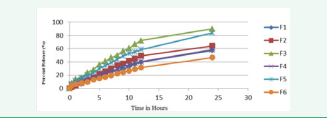
Figure 3 In vitro Dissolution study of Nanoemulsion.
From the 6 batches of Nanoemulsion, formulation F1 and formulation F5 were chosen to perform short term stability study of the nanoemulsion. Samples were stored in glass vials for 3 month at room temperature and at
4 ºC in freeze [36,37]. After 15, 30, 60 and 120 days, sample was visually observed for any sedimentation and the sample was further analyzed for in vitro drug release study and particle size (after 120 days).
For in vivo experiments, Wistar albino rats of either sex weighing in between 200-250 gm from animal house were used. The animals were placed in polypropylene cages with free access to standard laboratory diet and water. Animals were marked with picric acid solution for easy identification. The in vivo experimental protocol was approved by the Institutional Animal Ethical Committee [38-40]. The results are tabulated in (Table 3 and 4).
Table 3
Table 3: Reduction in blood glucose levels (mg/dL) after oral administration of Repaglinide in Normal Rats
| Group | Absolute blood glucose level | 2h | 4h | 6h | 8h | 12h | 24h |
| Control | 86.32±2.18 | 84.35±1.54 | 85.54±1.83 | 83.35±1.16 | 85.96±1.37 | 85.58±2.25 | 82.98±0.39 |
| F1 | 83.29±1.01 | 82.32±1.45 | 80.59±1.31 | 77.56±1.15** | 75.11±0.99*** | 72.26±0.71*** | 70.09±0.67*** |
| F5 | 85.73±2.43 | 84.41±2.48 | 81.69±1.41 | 78.72±1.25* | 76.43±1.35** | 74.30±1.10*** | 72.17±1.01*** |
|
Rep Std (1µg/g body weight) |
89.49±1.78 | 70.96±2.11*** | 63.38±0.54*** | 61.02±0.68*** | 58.20±0.67*** | 55.73±0.60*** | 85.37±0.79 |
Values are mean ± SEM; n=6 in each group. * P <0.05, **P<0.01 and ***P<0.001 when compared to control
Table 4: Reduction in blood glucose levels (mg/dL) after oral administration of Repaglinide in diabetic rats.
| Group | Absolute blood glucose level | 2h | 4h | 6h | 8h | 12h | 24h |
| Diabetic Control | 368.40 ± 2.51 | 369.60 ± 2.96 | 373.00 ± 2.83 | 374.70 ± 2.71 | 375.10 ± 2.58 | 377.50 ± 2.52 | 386.43 ± 2.52 |
| F1 | 386.10 ± 1.62 | 353.50 ± 2.30** | 325.60 ± 2.40** | 297.30 ± 2.45** | 281.70 ± 1.55** | 257.80 ± 2.68** | 212.20 ± 3.16** |
| F5 | 389.40 ± 1.90 | 365.20 ± 2.03** | 345.10 ± 2.26** | 318.70 ± 1.96** | 301.20 ± 2.23** | 285.40 ± 2.39** | 249.60 ± 2.82** |
| Diabetic Rep (1µg/g body weight) | 379.20 ± 2.49 | 315.90 ± 2.15** | 243.30 ± 1.44** | 211.80 ± 1.93** | 198.30 ± 2.74** | 193.30 ± 2.13** | 227.40 ± 2.61** |
Values are mean ± SEM; n=6 in each group ***P<0.001 when compared to diabetic control
The concentration and pharmacokinetic values are shown in (Table 5 and 6)
Table 5: In vivo concentration of nanoemulsion of F1 & F5
| Sr No. | Time(hrs) | Concentration (µg/ml) | |
| F1 | F5 | ||
| 1 | 2 | 9.79 | 9.03 |
| 2 | 4 | 11.12 | 10.98 |
| 3 | 6 | 10.09 | 10.12 |
| 4 | 8 | 6.42 | 9.63 |
| 5 | 12 | 6.02 | 7.08 |
| 6 | 21 | 5.69 | 6.12 |
Table 6: Pharmacokinetic parameter for nanoemulsion.
| Sr No | Pharmacokinetic parameter | F1 | F5 |
| 1 | Area Under Curve (µg.hrs/ml) | 49.58 | 48.39 |
| 2 | Cmax (µg/ml) | 11.12 | 10.98 |
| 3 | tmax (µg/ml) | 4.0 | 4.0 |
and (Figure 4).
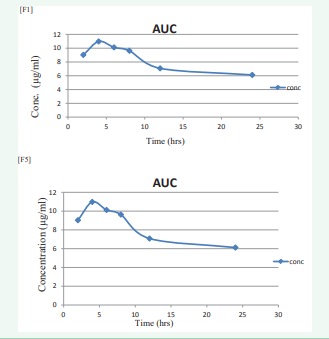
Figure 4: Area under Curve of F1 and Area under Curve of F5.
RESULTS AND DISCUSSION
Phase diagram study
Large amount of surfactant concentrations resulted in GI irritation so it is necessary to determine the concentration as well as use of minimum concentration of surfactant in formulation.
As per the data available till now, nobody has reported the basis of choosing different nanoemulsion formulation from phase diagram, as number of formulations can be formulated from the diagram of nanoemulsion region. The existence of stable nanoemulsion formation zone can be explained by pseudo ternary phase diagram. Pseudoternary phase diagrams were constructed separately for each Smix ratio so that o/w nanoemulsion region could be identified and nanoemulsion formulation could be optimized as shown in (Figure 2). Only those formulations were selected from the phase diagram, which used minimum concentration of Smix. According to area of phase diagrams in (Figure 2), Formulation F1, F4 and F5 cover the major area for the formulation of nanoemulsion as compare to other formulation.
IR spectroscopy
The IR spectral analysis of Repaglinide alone and the physical mixture of Repaglinide, surfactant and oil were carried out. The results suggested that there was no significant change in the chemical integrity of the drug (Figure 5).
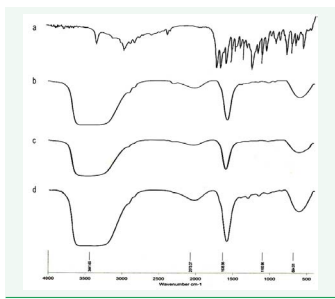
Figure 5: FTIR Spectra of pure Repaglinide (a), FTIR Spectra of F1 (b), FTIR Spectra of F2 (c), and Spectra of F5 (d).
DSC analysis
The DSC analysis of repaglinide alone showed a sharp endothermic peak at 134.090 C corresponding to its melting point. The DSC analysis of physical mixtures of drug, surfactant and oil demonstrated negligible change in the melting point of repaglinide in presence of any of the surfactant and oil mixture studied. The DSC thermograms are illustrated in (Figure 1)
Particle size and zeta potential
Formulations F1 to F6 are extruded through filters with membrane filter before analysis. The average particle size of repaglinide nanoemulsion was found to be 121.5nm, 171.9nm, 243.0 nm, 289.0 nm, 144.5nm and 289.0nm respectively. Particle size was in the order of F1 < F5-60 mV) which indicates the good stability of the nanoemulsion (Figure 6).
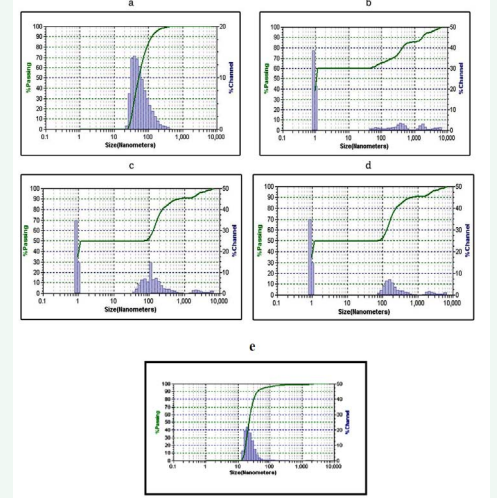
Figure 6: Particle size of Formulation F1 to F5 (a,b,c,d,e).
Viscosity
The viscosity of the nanoemulsion was determined at 32 ± 1 °C by a DV III cone and plate Brookfield viscometer. The viscosity of nanoemulsion is shown in (Table 2) which confirmed that F1 and F5 showed good flow properties as compared to other formulations
Polydispersity index
The Polydispersity indices were calculated from intensity which was in the order of F1 < F5 < F2 < F3 < F4 < F6 as shown in (Table 2) of F1 to F6 formulations. Amongst the all formulations the F1 and F5 observed near to Zero value which confirmed that they exhibit good particle homogenicity.
Drug content
The drug content of nanoemulsion formulation F1 to F6 was found to be 98.02 ± 0.01%, 95.67 ± 0.05%, 97.12 ± 0.03%, 94.55 ± 0.05%, 97.95 ± 0.02% and 95.14 ± 0.01 % respectively. Amongst them, F1 showed a higher drug content as compared to other formulation.
Scanning electron microscopy
Scanning electron photomicrographs by Scanning electron microscope (SEM) of F1, F2 and F5 as shown in (Figure 2). The images confirmed that oil globules were spherical and smooth in nature. Therefore, it seems that repaglinide encapsulation did not affect the morphology of nanoemulsion.
In vitro drug release study
In vitro release behaviours of all formulations were summarized in (Table 2) and (Figure 3). The release of repaglinide observed an initial burst release phase, releasing approximately 6.88% to 16.02 % of repaglinide in 0.1N HCL during the first 2 hrs and release rate increases thereafter at the end of 24 hrs in vitro drug release found to be 46.59 to 89.80 %. The results suggested that it took time for nanoemulsion to be released. Thus, an antidiabetic effect could be achieved using nanoemulsion. The results also suggested that the drug would be stable in the blood circulation and would be released slow at a small intestine, thus indicating that nanoemulsion of repaglinide formulation met with the requirement for an effective drug delivery system.
Stability study
Two best formulations namely F1 and F5 were selected for accelerated stability studies as per ICH guidelines. The nanoemulsions were observed for physical appearance, particle size, in vitro release and drug content for a period of three months. Physical appearance of the F1 & F5 formulation showed minor changes. Whereas, % in vitro drug release and % drug content were also decreased and increase in particle size slightly occurred when samples were stored at 4 ºC for 15,30,60 and 90 days intervals. A loose, thin layer of sediment was observed when it was stored at 37° C ± 2 for 3 month. However, the sediment disappeared with slight hand shaking. It can be inferred from the observed data that the prepared nanoemulsions were stable at 4° C ± 2 and at 37°C ± 2.
In vivo study
The results of reduction in blood glucose levels of nanoemulsion in comparison with repaglinide standard (1µg/g; p.o) in both normal and diabetic rats are shown in (Table 3 and 4), respectively. The hypoglycemic effect was significant from 2 to 24 hr in oral (p<0.05) when compared with the control group. The glucose level reduction at 2, 4 and 6 hr was high with oral administration, reflecting severe hypoglycemia in initial hours after administration. Pharmacokinetic study was conducted on Wistar rats with formulation F1 & F5. The optimized formulations were administered to rats and blood samples were withdrawn at different time intervals of 2, 4, 6, 8, 12 and 24 hrs from the jugular vein followed by plasma separation and extraction of drug from it and analyzed by HPLC method. The obtained Concentration and Pharmacokinetics parameters are shown in (Table 5,6) and Area Under Curve shown in (Figure 4).
CONCLUSIONS
The nanoemulsion of antidiabetic drug was successfully prepared by using spontaneous emulsification method. The olive oil (oil), span80, tween80 (surfactant) and acetone (solvent) are suitable for preparation for nanoemulsion. But increase in oil and surfactant concentration, increases the size of globules and turbidity of the nanoemulsion respectively. FTIR and DSC studies indicated compatibility between the drug, surfactant and oil, which was further confirmed by accelerated stability studies as per ICH guidelines. Scanning electron micrographs of nanoemulsion revealed that there is no sign of aggregation in F1 & F2 but shown the little aggregation in F5 between particles, due to encapsulation of drug in oil droplets and confirmed that oil globules were spherical and smooth in nature with nanometer range. For in vitro release, the results suggested that it takes times for the drug present in the nanoemulsion to be released and Formulation F1 to F6 followed Higuchi matrix release mechanism. Stability studies of selected formulation F1 and F5 showed slight change in Physical appearance. Whereas, % in vitro drug release and % drug content were also decreased and particle size slightly increased when samples were stored at 4 ºC for 15,30,60 and 90 days intervals. A loose, thin layer of sediment was observed when it was stored at 37 °C ± 2 for 15, 30, 60 and 90 days intervals. Thus it can be concluded that 4 °C is the most suitable temperature for storage of nanoemulsion. On the basis of particle size, morphology, in-vitro release and release kinetics, formulation F1 and F5 were selected as an optimum formulations for in vivo bioavailability Studies. From bioavailability studies, AUC for formulation F1 and F5 was 49.58 and 48.39 µg h/ml, where Cmax was found to be 11.12 µg/ml & 10.98 µg/ml, and Tmax 4.0 hr respectively. From all the parameters studied, it can be concluded that formulations F1 and F5 are suitable for oral administration as an antidiabetic activity.
ACKNOWLEDGMENTS
Authors thanks to principal of KLE College of Pharmacy, Nipani, Karnataka, India for providing facilities to conduct research work.
REFERENCES
1. Langer R. Drug delivery and targeting. Nature. 1998; 392: 5-10.
21. Shah P, Bhalodia D, Shelat P. Nanoemulsion: A pharmaceutical review. Sys Rev Pharm. 2010; 1: 24-32.
26. http://www.pslc.ws/macrog/dsc.htm
28. Alfred Martin. Physical Pharmacy, 4th ed. Philadelphia. Lippincott Williams & Wilkins. 1993.


