AIDS Survival in Patients Diagnosed Between 2003 and 2007 in the State of Rio Grande do Sul, Brazil, Followed Up Until 2014
- 1. Director of the Brazilian Ministry of Health’s Department of STIs, HIV/AIDS and Viral Hepatitis, University Center of Brasília, Brazil
- 2. Associate Professor at the University of Brasília, Brazil
- 3. Adjunct Professor at the University of Brasília, Brazil
- 4. Associate Professor at the University of Brasília, Brazil
- 5. Technician at the Ministry of Health’s Department of STIs, HIV/AIDS and Viral Hepatitis, Professor at Integrated Colleges of the Central Plateau Educational Union, Brazil
- 6. Department of STIs, HIV/AIDS and Viral Hepatitis, Brazil
Abstract
Background: The purpose of this study is to estimate the survival rates of AIDS patients diagnosed in the state of Rio Grande do Sul, Brazil, between 2003 and 2007, and followed up until 2014.
Methodology/Principal Findings: A retrospective, analytical cohort study was conducted based on secondary data, obtained from official information systems. 12,610 patients were studied. Patients’ survival rates were analyzed using Kaplan-Meier limit estimator. The survival time of AIDS patients was defined as the interval, in months, between the date of diagnosis and the date of death or censoring. The observed probability of survival was 67.35%+-0.42. According to the results of the Cox proportional hazards model, the following factors showed association with the evolution of AIDS, regardless of other exposures: HAART 1 (HR= 3.7 CI 95% 1.9–7.1); no treatment (HR=6.4 CI 95% 3.2–12.5); race/color of patients classified as black (HR=1,5 CI 95% 1.3–1.8); race/color of patients classified as brown (HR=1.3 CI 95% 1.1–1.6); IDU exposure category (HR=1.5 CI 95% 1.2–1.9); having up to 8 years of schooling (HR=1.7 CI 95% 1.4–1.9); having no schooling (HR=2.1 CI 95% 1.5–3.1); first CD4+ count below 200 cells/mm3 (HR=3.3 CI 95% 2.5–4.4) or between 200–349 cells/mm3 (HR=1.9 CI 95% 1.4–2.5); and viral load >500 cells/mm3 (HR=1.6 CI 95% 1.3–2.0).
Conclusions: The survival rate of AIDS patients, diagnosed in the state of Rio Grande do Sul between 2003 and 2007, is 67.35% over a 12-year follow-up period. Inequity-related issues may be addressed by the state to improve survival time among less privileged populations affected by the disease.
KEYWORDS
- Survival
- Mortality
- Rio Grande Do Sul
- Brazil
- Therapeutic Regimens
- HAART
CITATION
Pereira GFM, Shimizu HE, Bermudez XPD, Merchan-Hamann E, Caruso da Cunha AR, et al. (2024) AIDS Survival in Patients Diagnosed Between 2003 and 2007 in the State of Rio Grande do Sul, Brazil, Followed Up Until 2014. JSM Sexual Med 8(5): 1146.
INTRODUCTION
Since the first AIDS cases were diagnosed in the world in the beginning of the 1980’s until today, 33 million people have died from diseases associated with this illness, and currently 36.7 million people live with HIV / AIDS (PLHIV) worldwide [1]. In Brazil, the first cases were registered in the 1980’s and, currently, there are approximately 866,000 PLHIV. In this period, 316,088 HIV/AIDS-related deaths were notified. [2]
In the second half of the 1990’s, the introduction of anti-HIV drugs significantly increased patients’ survival time and reduced global mortality indicators related to this syndrome. Recent studies show that the mortality rates – due to any HIV / AIDS- related causes – of patients on successful antiretroviral therapy (ART), may come close to the rates of the general population. It is possible to observe that the mortality rates of many of these patients are comparable to other chronic conditions, such as diabetes [3,4].
Brazil was the first middle-income country to provide universal and free-of-charge access to antiretroviral drugs. In March 1995, the Brazilian government issued the first official resolution regulating this measure as standard treatment for AIDS patients. During the following years, effective distribution of these drugs was conducted through the Unified Health System (SUS) [5].
Despite the unquestionably positive effect of these policies on mortality rates, unequal access to medication has been regularly reported internationally. Even in high-income countries, which can provide ample and free-of-charge access to drugs, the effectiveness of treatment requires not only access but also continuous adherence to therapeutic regimens that are complex and involve undesirable side effects. Such situation differs from country to country depending on the socioeconomic inequalities found in their population [6].
Survival rates have improved among PLHIV as a result of increasingly effective treatments developed in the last decade. However, these rates are unequally distributed across as well as within the different regions of the world. AIDS survival rates are strongly influenced by the process of social determinants of health such as gender, race/ethnicity, and socioeconomic aspects [7].
Adherence to ART equally impacts PLHIV’s survival rate, approximating it to that of the general population [8]. However, health inequalities related to ethnicity, gender and geographical issues among PLHIV generates disparities in health outcomes, as shown in important cohort studies [7,9]. Ignoring these social disadvantages, in their diverse manifestations, may increase the risk of exacerbating health inequalities. The correlation between income and survival has been prospectively reported since the outbreak of the epidemic and is not limited to HIV [10].
Some studies involving specific racial/ethnic groups illustrate the role of social inequalities on diagnosis and survival time of PLHIV. In the United States of America, a study compared the Hispanic population with other racial/ethnic groups between January 2000 and September 2010, demonstrating a significantly higher risk of delayed diagnosis among Hispanics when compared with white and non-Hispanic populations. In contrast, ART initiation results in similar survival rates for both groups. These findings emphasize the need to implement strategic policies to promote timely diagnosis among more vulnerable groups [11].
Survival rate studies are essential to understand the dynamics of the AIDS epidemic, to aid in measuring the need for healthcare assistance, and to assess intervention strategies in order to improve the quality of life of PLHIV. In Brazil, between 1982 and 1989, before the implementation of highly active antiretroviral therapy (known as HAART), a period that we define here as pre- HAART, average survival time was 5.1 months [12], much lower than that observed in developed countries. In 2003, survival rates for the years of 1995 and 1996 were estimated at 16 and 58 months, respectively, for Brazilian patients aged 13 or older [13]. A study conducted in the South and Southeast regions of Brazil, among adult patients diagnosed with AIDS in 1998 and 1999, showed that 59% of them survived for 108 months [14].
In the state of Rio Grande do Sul, only one survival study was conducted in Porto Alegre – in the period between 1986 and 1991 – with a cohort of 224 patients presenting a survival time of five months after the diagnosis of the disease [15].
The first national study of AIDS survival rates for individuals under 13 years of age evaluated those patients diagnosed in the period between 1983 and 1998 who were followed up until 2001. Findings showed a survival probability of 52% (CI 95% 0.48– 0.56), pointing to the impact of universal access to treatment as a relevant factor to increase survival time of vertically HIV-infected children [16].
According to the data supplied by the Ministry of Health, Brazil has registered an annual average of approximately 41,000 AIDS cases. When distributed by region, the North has an average of 4,000 cases per year; the Northeast, 8,600; the Southeast, 16,900; the South, 8,800; and the Center-West, 2,900. In the South region, the state of Rio Grande do Sul has the most troublesome epidemiological situation: from 1982 to June 2017, the state registered a total of 88,568 AIDS cases, representing 50.1% of all the cumulative cases in the South region and 10.1% of the cases identified in Brazil.
Historical data show that Rio Grande do Sul has been among the three states with the highest AIDS detection rates in the country. In the period between 2011 and 2016, more specifically, this state ranked among the Federation Units with the highest numbers of AIDS diagnoses, and in 2015 it ranked third place. Still in relation to AIDS mortality rates, in 2016 this state had the highest rate in Brazil: 11.9/100,00 inhabitants [17].
Within this context, the purpose of this study is to estimate the AIDS mortality rates in the state of Rio Grande to Sul and the survival time of patients diagnosed with AIDS in the period between 2003 and 2007, according to therapeutic regimens, demographic and behavioral factors, and diagnosis-related variables, in order to monitor the impact of the universal access to treatment policy and to continuously update intervention strategies.
The study project was submitted to the Research Ethics Committee of the STD / AIDS Reference and Training Center, under number 1.449.357, and approved on 03/14/2016.
METHODS
An institution-based, retrospective, analytical cohort study, tied to territories, was conducted based on secondary data obtained from official information systems.
The studied population comprises all individuals diagnosed with AIDS in the state of Rio Grande do Sul in the period between 2003 and 2007, totaling 12,610 people, followed up until 2014, and is based on data obtained from the Notifiable Diseases Information System (SINAN), Laboratory Tests Control System of CD4+/CD8+ Lymphocyte Count and HIV Viral Load (SISCEL), and the Mortality Information System (SIM).
These databases were linked with the purpose of identifying the largest number of cases, thus reducing possible underreporting and/or delays of their registration in the systems. In order to conduct the probabilistic relationship of data, the following were included: (i) AIDS cases notified to SINAN; (ii) deaths registered in SIM, classified as caused primarily by AIDS, under the B20 and B24 codes of the International Classification of Diseases and Health-related Problems (ICD); and (iii) AIDS cases with laboratory exams registered in SISCEL, which met the following case-defining criteria: adult presenting T-CD4+ lymphocyte count below 350 cells/mm³ and undetectable viral load; child presenting T-CD4+ lymphocyte count below the expected threshold for their current age and two viral load counts above 10,000 copies/mL; adult presenting T-CD4+ lymphocyte count below 350 cells/mm³ and on medication registered in SICLOM; or child presenting T-CD4+ lymphocyte count below the expected threshold for their current age and taking medication as registered in SICLOM.
SICLOM’s registers were used to confirm AIDS cases with laboratory tests informed in SISCEL, which met the defining criteria (a detailed description of the methodology has been previously published). Database linkage took into account only AIDS cases. In 2014, HIV infections were included in the List of Diseases with Compulsory Notification, while HIV infections in pregnant women have been notified since 2000. The probabilistic relationship among all databases was conducted using, as comparison fields, name of patients, name of mothers and dates of birth and, as blocking key, the phonetic codes for the first and last names of patients and their sex, combined in different ways through three totally automated steps by RecLink III software [18-21].
For each period of the study, the following definitions of AIDS cases in Brazil were adopted: CDC, 1988; Rio de Janeiro & Caracas, 1992; and CDC, 1988. The study followed the World Health Organization’s criteria to identify the basic cause of death and other causes mentioned in the Death Certificate (DC) were classified as death-associated causes [22]. In order to classify AIDS as the basic cause of death, the following codes were utilized: B20 to B24 of the ICD-10 (tenth revision) [23].
Those individuals who were prescribed several successive therapies were classified as users of the most complex scheme. According to the therapeutic regimens, individuals were distributed into three groups: without HAART, with AART1, and with HAART2. A minimum period of 30 consecutive days using the therapeutic scheme was observed.
The therapeutic regimens were classified according to the following types of drugs: (a) nucleoside reverse transcriptase inhibitors (NRTIs); (b) non-nucleoside reverse transcriptase inhibitors (NNRTIs); (c) Protease inhibitors (PIs); and (d) fusion inhibitors (FIs). HAART treatment was defined as having at least one PI drug or one NNRTI combined with at least two NRTIs.
The regimens defined were: (a) pre-HAART scheme (ITRN): Zidovudine, Lamivudine, Stavudine, Zalcitabine, Didanosine, Abacavir, Tenofovir; (b) HAART 1 scheme: NNRTI: Efavirez, Nevirapine; IP: Atazanavir, Indinavir, Nelfinavir, Amprenavir, Ritonavir, Saquinavir, Fosamprenavir, Lopinavir; (c) HAART 2: regimenscontaining at least one third-line ARV: Enfuvitide, Darunavir, Tipranavir, Maraviroc, Etravirine, Raltregavir.
Exclusion Criteria
The following individuals were not included: notified to SINAN as “deaths” in the period between 2003 and 2007; notified to SINAN, in the same period, as HIV+ without AIDS; and individuals registered in SISCEL/SICLOM during a period of less than 30 days.
Loss to follow-up criteria
Censoring occurred in the following situations: (a) patients who were alive and being followed-up on December 31, 2014, the study’s end date – administrative censoring; (b) patients who died from causes other than AIDS, and, in these cases, censoring was registered at the date of death; (c) patients lost to follow- up, that is, those without information in SISCEL/SICLOM for the period of one year after the last registration and, in these cases, censoring was included at the date the last information was entered in the system.
Study’s variables
The following groups of variables were considered: (a) sociodemographic and behavioral factors: sex, race/color, age group, schooling, and exposure category; (b) diagnosis-related factors: viral load count at diagnosis, levels of CD4+ T cells at diagnosis; (c) variables related to therapy: available treatment regimens; (d) variables related to clinical evolution: survival time with AIDS.
Data analysis
After establishing data consistency and conducting the needed corrections, a descriptive analysis of the study’s population was performed, documenting the frequency and distribution of relevant events obtained through both categorical and numerical variables. Raw mortality rates were calculated for each year of follow up (i.e. the number of deaths over a period of time divided by the population per 1,000 inhabitants.
The probability of survival in a cohort of patients was calculated in the first, third, fifth, seventh, ninth, and twelfth years. The difference between the survival probabilities was tested as to their significance.
Time-to-event analysis
Kaplan-Meier limit estimator was used to analyze time- to-event, that is, survival time with AIDS. In order to compare the time-to-event of two or more groups, the log-rank test was utilized. AIDS survival time was defined as the interval, in months, between the date of AIDS diagnosis and date of death or censoring.
To investigate the association between relevant exposures and the outcome “time until AIDS-related death”, Cox’s [24], proportional hazard model was applied. Hazard Ratio (HR), with a confidence interval of 95%, was used. Schoenfeld’s [25], residuals analysis was conducted to verify adjustments. The programs used were SPSS, STATA, and TCM.
RESULTS
Table 1 presents the results of the cohort of patients with AIDS in the state of Rio Grande do Sul,
Table 1: Cohort´s characteristics of patients with AIDS in the state of Rio Grande do Sul, diagnosed between 2003 and 2007.
|
Characteristics |
N |
% |
|
|
12,610 |
100,0 |
|
Sex |
|
|
|
Male |
6,840 |
54.2 |
|
Female |
5,769 |
45.7 |
|
No information provided |
1 |
0.0 |
|
Schooling |
259 |
|
|
None |
6,140 |
2.1 |
|
Up to 8 years |
3,995 |
48.7 |
|
Over 8 years |
2,216 |
31.7 |
|
No information provided |
|
17.6 |
|
Age group |
3,654 |
|
|
< 30 years old |
7,465 |
29.0 |
|
30 - 49 years old |
1,491 |
59.2 |
|
50-plus years old |
|
11.8 |
|
Raçe |
8,278 |
|
|
White |
1,546 |
65.6 |
|
Black |
45 |
12.3 |
|
Asian |
1,038 |
0.4 |
|
Brown |
36 |
8.2 |
|
Native Indian |
1,667 |
0.3 |
|
No information provided |
|
13.2 |
|
Period of AIDS diagnosis |
7,232 |
|
|
2003 to 2005 |
5,378 |
57.4 |
|
2006 to 2007 |
|
42.6 |
|
Exposure category |
1,383 |
|
|
MSM |
8,131 |
11.0 |
|
Heterosexual |
1,844 |
64.5 |
|
IDU |
6 |
14.6 |
|
Hemophilic |
9 |
0.0 |
|
Transfusion |
1 |
0.1 |
|
Work-related accident |
54 |
0.0 |
|
Perinatal |
1,182 |
0.4 |
|
No information provided |
|
9.4 |
|
CD4 range (Cell/mm3) |
3,372 |
|
|
< 200 |
4,073 |
26.7 |
|
200 – 349 |
1,518 |
32.3 |
|
350 – 499 |
1,515 |
12.0 |
|
≥500 |
2,132 |
12.0 |
|
No information provided |
|
16.9 |
|
Viral load at diagnosis |
- |
|
|
Undetectable (< 40) |
1,776 |
- |
|
Low viraemia (40-500) |
7,471 |
14.1 |
|
Failure (> 500) |
3,363 |
59.2 |
|
No information provided |
|
26.7 |
|
ARV regimen |
3,516 |
|
|
Without ARV |
6 |
27.9 |
|
Pre-HAART |
8,837 |
0.0 |
|
HAART 1 |
251 |
70.1 |
|
HAART 2 |
|
2.0 |
Source: The authors.
diagnosed between 2003 and 2007, the data of 12,610 individuals – 54.2% men and 45.7% women – were analyzed. In relation to schooling, 48.7% had up to 8 years of schooling, 31.7% more than 8 years, 17.1% had no information related to this variable, and only 2.1% had no schooling. In general, it was possible to observe that the highest proportion (59.2%) related to people aged 30 to 49, self-classified as whites (65.6%), and who had up to 8 years of schooling (48.7%).
The proportional distribution of patients according to year of AIDS diagnosis showed that 57.4% received their diagnosis in the period between 2003 and 2005 followed by 42.6% who were diagnosed between 2006 and 2007.
The most frequent category of transmission risk, or exposure category, was heterosexual (64.5%), followed by injectable drug users (14.6%) and men who have sex with men (11.0%).
In relation to laboratory markers, the study showed that a higher proportion of patients (32.3%) had CD4+ T cell count at the time of AIDS diagnosis between 200 and 349 cells per cubic millimeter (cells/mm3), and 26.7% below 200 cells/mm3. Regarding viral load (i.e., the quantity of HIV viral particles in the peripheral blood) at diagnosis, 59.2% of patients had high viral load, above 500 HIV RNA copies/ml, followed by 14.1% of patients with viral load between 40 and 500 HIV RNA copies/ml.
The distribution of patients according to the antiretroviral scheme used showed a large majority (70.1%) of patients on HAART1. However, it is relevant to observe the proportion of patients without any information relative to ART use: 27.9% of the study’s population.
Mortality from AIDS
The data of 12,610 AIDS patients were analyzed. Of these, 3,680 (29.2%) died and 8,930 (70.8%) were alive at the end date of the study Mortality rates varied from 15.63/1,000 inhabitants in 2003 to 2.59/1,000 in 2014 (Figure 1).
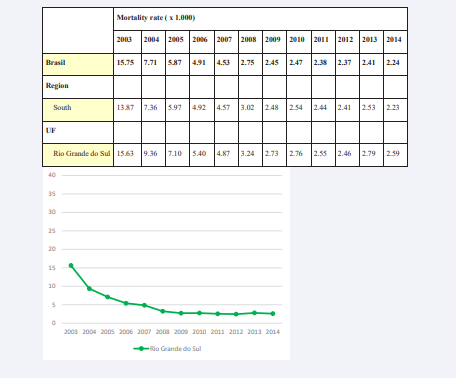
Figure 1: Mortality rates from AIDS/1,000, in the period between 2003 and 2007 – Rio Grande do Sul.
Cumulative probability of survival in patients with AIDS
Among patients diagnosed with AIDS between 2003 and 2007, the estimate of cumulative probability of survival up to 12 years was 69.78 % ± 0.30 for the South region and 67.35% ± 0.42 for Rio Grande do Sul (Table 2).
Table 2: Cumulative probability of survival according to the time of AIDS diagnosis, Rio Grande do Sul, 2003 to 2007.
|
|
Accumulated probability of survival |
p |
|||||
|
1 year |
3 year |
5 year |
7 year |
9 year |
12 year |
||
|
Region |
|
|
|
|
|
|
<0,001 |
|
South |
88.28 ± 0.20 |
83.17 ± 0.23 |
78.32 ± 0.26 |
73.87 ± 0.27 |
69.78 ± 0.30 |
69.78 ± 0.30 |
|
|
UF |
|
|
|
|
|
|
<0,001 |
|
Rio Grande do Sul |
87.23 ± 0.29 |
81.52 ± 0.34 |
76.26 ± 0.37 |
71.8 ± 0.39 |
67.35 ± 0.42 |
67.35 ± 0.42 |
|
Source: The authors.
Table 3: Multivariate analysis through Cox proportional-hazards model, according to predictive factors for the progression to AIDS, Rio Grande do Sul, 2003 to 2007.
|
Characteristics |
Population n = 12,610 |
|
p-value |
|
|
|
N |
HR aj |
CI 95% (HR aj) |
|
|
Therapeutic regimen ($) |
|
|
|
|
|
HAART2 |
251 |
1 |
- |
- |
|
HAART1 |
8,837 |
3.7 |
1.9 – 7.1 |
<0.001 |
|
Pre-HAART |
6 |
5.3 |
0.7 – 42.3 |
0.113 |
|
Without ART |
3,516 |
6.4 |
3.2 – 12.5 |
<0.001 |
|
Sex |
|
|
|
|
|
Male |
6,840 |
1 |
- |
- |
|
Female |
5,769 |
0.8 |
0.7 – 0.9 |
0.013 |
|
Race / color |
|
|
|
|
|
White |
8,274 |
1 |
- |
- |
|
Black |
1,546 |
1.5 |
1.3 – 1.8 |
<0.001 |
|
Brown |
1,038 |
1.3 |
1.1 – 1.6 |
0.017 |
|
Exposure category |
|
|
|
|
|
MSM |
1,383 |
1 |
- |
- |
|
Heterosexual |
8,131 |
0.9 |
0.7 – 1.1 |
0.235 |
|
IDU |
1,844 |
1.5 |
1.2 – 1.9 |
< 0.001 |
|
Schooling |
|
|
|
|
|
> 8 years |
3,995 |
1 |
- |
- |
|
Up to 8 years |
6,140 |
1.7 |
1.4 – 1.9 |
< 0.001 |
|
None |
259 |
2.1 |
1.5 – 3.1 |
< 0.001 |
|
CD4 count |
|
|
|
|
|
> 500 cells/mm³ |
1,515 |
1 |
- |
- |
|
350 - 500 cells/mm³ |
1,518 |
1.3 |
0.9 – 1.8 |
0.123 |
|
200 – 349 |
4,073 |
1.9 |
1.4 – 2.5 |
< 0.001 |
|
< 200 |
3,372 |
3.3 |
2.5 – 4.4 |
< 0.001 |
|
Viral Load at diagnosis |
|
|
|
|
|
Low viraemia (40-500) |
1,776 |
1 |
- |
- |
|
High Viraemia (> 500) |
7,471 |
1.6 |
1.3 – 2.0 |
< 0.001 |
|
Source: author’s elaboration. HRaj adjusted hazard ratio, hazard ratio: ratio of two hazard functions |
|
|||
|
ART: antiretroviral therapy; HAART: highly active antiretroviral therapy |
|
|||
|
($) Used the most complex scheme |
|
|
||
Figure 2: shows the cumulative probability of survival for the cohort of patients diagnosed between 2003 and 2007,
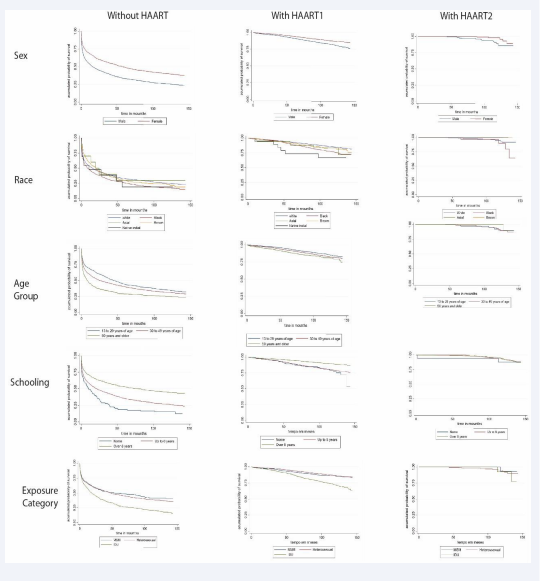
Figure 2: Survival rates in patients with AIDS in the state of Rio Grande do Sul, diagnosed between 2003 and 2007, followed up until 2014, according to therapeutic regimens, and sociodemographic and behavioral variables.
followed up until 2014, in the state of Rio Grande do Sul, according to the therapeutic regimens (without HAART, with HAART 1 and with HAART 2), and sociodemographic and epidemiological variables (sex, race, age group, schooling, and exposure category).
It should be pointed out that, in general, survival time is smaller among patients without HAART. Taking into consideration the sex variable, men have smaller survival time than women, as well as those classified as being black or brown or belonging to older age groups. Lower level of schooling is also an important factor in decreasing the probability of survival. In relation to the type of exposure, injectable drug users show the lowest probability of survival.
On the other hand, it is also possible to observe a general increase in survival time among patients on HAART2 when compared to those on HAART1, regardless of their sociodemographic characteristics.
In relation to the cumulative probability of survival in the cohort of patients diagnosed between 2003 and 2007, in the state of Rio Grande do Sul, according to therapeutic regimens (without HAART, with HAART 1, and with HAART 2) and the diagnosis- related variables (viral load and CD4 T cell count at diagnosis), it is possible to observe that those patients with higher CD4 T cell count and lower viral load at the time of diagnosis present longer survival time. Similar results are seen in relation to sociodemographic characteristics: in general, survival time increases for patients on HAART 2 when compared to those on HAART 1, as shown in Figure 3.
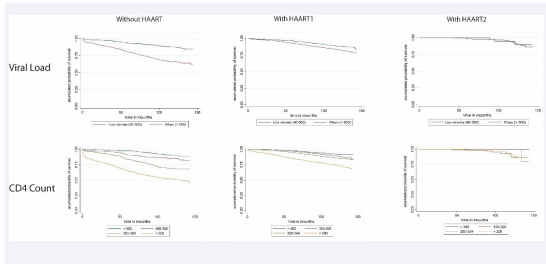
Figure 3: Survival time of patients with AIDS in the state of Rio Grande do Sul, diagnosed between 2003 and 20017, followed up until 2014, according to therapeutic regimens and diagnosis-related variables.
The results of the analysis using Cox proportionate hazard model showed the following associations to survival time, regardless of other exposures: HAART1 (HR=3.7 CI 95% 1.9–7.1); no treatment (HR=6.4 CI 95% 3.2–12.5); race/color classified as black (HR=1.5 CI 95% 1.3–1.8); and brown (HR=1.3 CI 95% 1.1–1.6); IDU exposure category (HR=1.5 CI 95% 1.2–1.9); having up to 8 years of schooling (HR=1.7 CI 95% 1.4–1.9); no schooling (HR=2.1 CI 95% 1.5–3.1); first CD4 count below 200 cells/mm3 (HR=3.3 CI 95% 2.5–4.4) and between 200–349 cells/mm3 (HR=1.9 CI 95% 1.4–2.5); and viral load between 350–500 cells/ mm3 (HR=1.3 CI 95% 0.9–1.8).
In relation to therapeutic regimens, the probability of survival time is smaller for those who are not on ART in contrast to those on HAART1 and HAART2.
DISCUSSION
This study shows that the raw mortality rate for patients diagnosed with AIDS for each year in the state of Rio Grande do Sul, between 2003 and 2007, has decreased over this period. The probability of a 12-year survival is greater when compared with previous studies.
Findings point to a smaller survival time for the state of Rio Grande do Sul when compared with the survival data of the cohort of patients diagnosed with AIDS in the period between 2003 and 2007 in the South Region. However, there are significant differences in the survival time when compared with the evolution of survival studies conducted in Brazil [14,16].
Survival time increased during this study’s period of observation (144 months or 12 years). Findings also confirm the results of national and international studies pointing to social determinants – gender, race/color, and other sociodemographic aspects – as important factors impacting the survival rates of this study: patients identified as black or brown and with low levels of schooling had lower probability of survival over the researched period. The significance of these factors, as social determinants in the health-sickness process, escalates when greater vulnerability is linked to the performance of healthcare services despite the availability of free-of-charge diagnosis and therapy. Clinical conditions, such as low CD4 count and high viral load at diagnosis, indicate delayed detection with repercussions on the probability of survival time.
Delayed diagnosis is an aspect that has already been highlighted in other studies as a limiting factor to improve the clinical conditions of people with no access to therapies, impacting life expectancy. This study’s findings reaffirm the results of other research studies, demonstrating how a set of socioeconomic constructs as well as access to high-quality services influence outcomes [26].
This situation is aggravated by coinfection with tuberculosis. Epidemiological surveillance data indicate that, in 2016, the ratio of HIV/TB coinfections was 16.1%, above the national proportion of 9.4%. In the state of Rio Grande do Sul, this ratio reached 18.3%, the highest in Brazil. The capital city of Porto Alegre had the highest rate of HIV/TB coinfections when compared with the other capital cities of the country (24.1%) [27]. It is probable that these events decrease survival time; however, other studies are needed to investigate the risk of such coinfections.
On the other hand, the use of HAART2 (i.e. new-generation highly active antiretroviral therapy) improves patients’ probability of survival time. This is also true for patients with delayed diagnosis and whose sociodemographic determinants are unfavorable for the outcome of the disease [6-9]
Because this study utilizes secondary data from the Ministry of Health’s official databases, limitations such as underreporting in SINAN may influence data, including information about exposure, a variable that is only found in SINAN’s Notification and Investigation Form. This may result in a number of ignored information about exposure for cases registered in the other information systems used in this study. Of the 12,610 cases of the cohort study, 17.6% had no information on their schooling, 13.2% on their race/color, 9.4% on the exposure category, 16.9% on the CD4 count, and 26.7% on their viral load. Due to the significant number of cases in this cohort, the ignored proportions did not impact the evidence of associations.
In Rio Grande do Sul’s database, for the period between 2003 and 2007, 76.3% of cases were obtained from SINAN, a fact that mitigates the loss of this specific piece of information.
Besides the concerns previously described, the specific situation of patients infected through injectable drug use (IDU exposure category) in Rio Grande do Sul is troubling. Usage of illegal injectable drugs is frequent in this region and users probably share other factors and comorbidities, such as coinfections with tuberculosis and hepatitis B and C. These conditions, compounded by social exclusion and hindered access to services capable of providing early diagnosis as well as a timely response to AIDS patients, may contribute to a smaller survival time. Although national data indicate a low rate of HIV/ hepatitis B and C coinfections in patients registered in official information systems between 1999 and 2010 (1.0% and 1.6%, respectively), a 2014 study shows that the situation in the South region is worse. This region has 23% of AIDS/hepatitis B coinfections, and 28.5% of HIV/hepatitis C coinfections. When AIDS/hepatitis B co-infected patients are compared with those not co-infected, exposure through IDU is 1.8 times more frequent among the former; in relation to AIDS/hepatitis C coinfection, the proportion is 6.4 higher for drug users [28,29]. It is reasonable to assume that coinfections and other comorbidities due to IDU exposure plays an important role in the epidemiological situation of the state of Rio Grande do Sul [30].
CONCLUSIONS
The probability of survival of AIDS patients, diagnosed in the state of Rio Grande do Sul in the period between 2003 and 2007, is 67.3% over a 12-year follow-up period. In Brazil and in the South region, the probability of survival of the cohort of patients, diagnosed and followed up in this same period, is 69.8% and 69.7%, respectively.
Inequality-related issues need to be addressed in this state to improve the survival time of less privileged populations affected by the disease: scale up harm reduction programs and attend to the relative consequences of coinfections, especially among IDUs, given their role in the epidemic.
Therefore, it is important to maintain and continue monitoring programs, taking into account the constant changes in prevention policies and assistance in the country. The information systems used in this study facilitate monitoring, as that they allow tracing events over time, permitting the development of historical cohorts. Data thus gathered contribute to Brazil’s HIV / AIDS epidemiological surveillance programs.
REFERENCES
- UN Joint Programme on HIV / AIDS. Global Report: UNAIDS Report on the Global AIDS Epidemic: 2016.
- Brasil. Ministério da Saúde. Secretaria de Vigilância em Saúde. Departamento de IST, HIV/Aids e Hepatites Virais. Boletim Epidemiológico Aids e DST. Ano V, nº 01, Brasília. 2017.
- Keiser O, Taffe P, Zwahlen M, Battegay M, Bernasconi E, Weber R, et al. All cause mortality in the Swiss HIV Cohort Study from 1990 to 2001 in comparison with the Swiss population. Aids. 2004; 18: 1835-1843
- Djomand G, Roels T, Ellerbrock T, Hanson D, Diomande F, Monga B, et al. Virologic and immunologic outcomes and programmatic challenges of an antiretroviral treatment pilot project in Abidjan, Cote d’Ivoire. AIDS. 2003; 3: S5-15.
- Chequer P, Cuchí P, Mazin R, Calleja JMG. “Access to antiretroviral treatment in Latin American countries and the Caribbean”. AIDS. 2002; 3: S50-57.
- Wood E, Montaner JSG, Chan K, Tyndall MW, Schechter MT, Bangsberg D, et al. “Socioeconomic status, access to triple therapy, and survival from HIV- disease since 1996”. AIDS. 2002; 16: 2065-2072.
- Abgrall S, Del Amo J. Effect of sociodemographic factors on survival of people living with HIV. Curr Opin HIV AIDS. 2016; 11: 501-506.
- Samji H, Cescon A, Hogg RS, Modur SP, Althoff KN, Buchacz K, et al. North American AIDS Cohort Collaboration on Research and Design (NA-ACCORD) of IeDEA. Closing the Gap: Increases in Life Expectancy among Treated HIV-Positive Individuals in the United States and Canada. PLoS One. 2013; 8: e81355.
- Pellowski JA, Kalichman SC, Matthews KA, Adler N. A pandemic of the poor: Social disadvantage and the U.S. HIV epidemic. American Psychologist. 2013; 68: 197-209.
- Burch LS, Smith CJ, Anderson J, Sherr L, Rodger AJ, O’Connell R, et al. Socio-economic disadvantage and viral load outcomes for HIV positive people on antiretroviral treatment in the UK: cross-sectional and longitudinal analysis. Lancet Public Health. 2016.
- Nadine EC, Joel EG, Kathlen RP. A Systematic Review of HIV / AIDS Survival and Delayed Diagnosis among Hispanics in the United States. J Immigr Minor Health. 2012; 14: 65-81.
- 12. Chequer P, Hearst N, Esther SH, Castilho E, Rutherford G, Loures L, et al. Brazilian State AIDS Program Coordinators. Determinants of survival in adult Brazilian AIDS patients, 1982-1989. AIDS. 1992; 6: 483-487.
- Marins JR, Jamal LE, Chen SY Barros MB, Hudes ES, Barbosa AA, et al. Dramatic improvement in survival among adult Brazilian AIDS patients. AIDS. 2003; 17: 1675-1682.
- Guibu IA, Barros MBA, Donalísio MR, Tayra A, Alves MC, Porto GOI. Survival of AIDS patients in the Southeast and South of Brazil: analysis of the 1998-1999 cohort. Cad Saúde Pública. 2011; 1: S79-92.
- Santos B, Beck EJ, Peixoto MF. Survival and Medical intervention Southern Brazilian Aids Patients. Int J STD AIDS. 1994: 5.
- Matida LH, Ramos Jr AN, Moncau JEC, Marcopito LF, Marques HHS, Succi RCM, et al. AIDS by mother-to-child transmission: survival analysis of cases followed from 1983 to 2002 in different regions of Brazil. Cad Saúde Pública. 2007; 3: S435-S444.
- Brasil. Ministério da Saúde. Secretaria de Vigilância em Saúde. Departamento de Vigilância, Prevenção e Controle das Infecções Sexualmente Transmissíveis, do HIV/Aids e das Hepatites Virais. Boletim Epidemiológico Aids e IST. Ano V, nº 01, Brasília. 2017.
- Santos B, Beck EJ, Peixoto MF. Survival and medical intervention in Southern Brazilian AIDS patients. Int J STD AIDS. 1994; 5: 279-283.
- Camargo JR, Kenneth R, Coeli CM. Reclink: aplicativo de para o relacionamento de bases de dados. Implementando o método relacionamento probabilístico. Cad Saúde Pública. 2000; 439-447.
- Junger WL. Estimação de parâmetros em relacionamento probabilístico de bancos de dados: uma aplicação do algoritmo em para o Reclink. Cad Saúde Colet. 2006; 14: 225-232.
- Lucena FF, Fonseca MGP, Coeli CM, Sousa AIA. O relacionamento de bancos de dados na implementação da vigilância da aids. Cad Saúde Colet (Rio J). 2006; 14: 305-312.
- Santo AH, Pinheiro CE, Jordani MS. Causas básicas e associadas de morte por Aids, Estado de São Paulo, Brasil, 1998. Rev. Saúde Pública. 2000; 34: 581-588.
- Buchalla CM, Laurenti R, Ribeiro AF, Nitrini DR, Guarnieri CE, Carnaúba EL, et al. Avaliação do uso da Classificação Internacional de Doenças para codificar a síndrome da imunodeficiência adquirida Evaluation of the use of the International Classification of Diseases for the codification of AIDS. Rev. Saúde Pública. 1996; 30: 479-482.
- Cox DR. Regression models and life tables. J Royal Statistical Society. Series B (Methodological). 1972; 34: 187-220.
- Norman GR, Streiner DL. Biostatistics. Hamilton, ON: B.C. Decker. 2000.
- Mukoswa GM, Charalambous S, Nelson G. The association between social capital and HIV treatment outcomes in South Africa. PLoS One. 2017; 12: e0184140.
- 27. Cunha AP, Cruz MM, Torres RMC. Tendência da mortalidade por aids segundo características sociodemográficas no Rio Grande do Sul e em Porto Alegre: 2000-2011. Epidemiol Serv Saúde. 2016; 25: 477-486.
- Brasil, Secretaria de Vigilância em Saúde, Ministério da Saúde. Boletim Epidemiológico Coinfecção TB-HIV no Brasil: panorama epidemiológico e atividades colaborativas, 2017. Brasília: MS/SVS. 2017.
- Oliveira SB, Merchan–Hamann E, Amorim LDAF. HIV / AIDS coinfection with Hepatitis B and C viruses in Brazil. Cadernos de Saúde Pública. 2014; 30: 433-438.
- Caiaffa WT, Bastos FI. usuários de drogas injetáveis e infecção pelo vírus da imunodeficiência humana: epidemiologia e perspectivas de intervenção. Revista Brasileira de Epidemiologia.1998; 1: 190-202.


