Association between Health Literacy and Glycaemic Control in Danish Outpatients with Type 1 and Type 2 Diabetes
- 1. Steno Diabetes Center Aarhus, Aarhus University Hospital, Denmark
- 2. Department of Clinical Medicine, Aarhus University, Denmark
- 3. Department of Public Health, Aarhus University, Denmark
Abstract
Purpose: The purpose of this study was to explore the association between glycaemic levels and health literacy in outpatients with Type 1 (T1D) and Type 2 diabetes (T2D).
Methods: A cross-sectional study at Steno Diabetes Center Aarhus, Denmark, included 3,070 outpatients with T1D and T2D, of which 1,252 responded (403 T1D, 849 T2D). HbA1c values were analysed in tertiles, and health literacy was assessed using the Health Literacy Questionnaire (HLQ™) across four dimensions: (1) managing health and critical assessment, (2) appraisal of health information, (3) active engagement with healthcare providers, and (4) understanding health information for self-management. Linear regression models assessed the association between HbA1c tertiles and health literacy for both diabetes types.
Results: T1D outpatients in tertile 3 (mean HbA1c = 71.5 mmol/mol, range = 62–148), had lower education, higher comorbidity, poorer well-being, and increased anxiety, depression, and diabetes-related stress compared to tertile 1 (mean HbA1c = 47.4 mmol/mol, range = 29–53). High HbA1c was linked to lower health literacy in three of four dimensions. In T2D patients, high HbA1c was associated with longer diabetes duration, poorer well-being, higher stress and anxiety, and difficulties in understanding health information.
Conclusion: This study finds that outpatients with poor glycaemic control have lower health literacy than those who have tighter glycaemic control. It also highlights the important fact that many diabetes patients struggle to understand health information, regardless of their HbA1c levels. Further research is needed to refine strategies that help healthcare providers support effective diabetes management
Keywords
• HbA1c levels • Outpatients • Type 1 diabetes • Type 2 diabetes • Health literacy
Citation
Stendal M, Pedersen SB, Møller TB, Aagaard M, Pedersen CG (2025) Association between Health Literacy and Glycaemic Control in Danish Outpatients with Type 1 and Type 2 Diabetes. J Chronic Dis Manag 9(1): 1046.
INTRODUCTION
Diabetes mellitus poses a global health challenge, with many individuals living with the condition and facing severe complications partly due to high HbA1c levels [1]. Consequently, establishing treatment goals for diabetes management and reducing HbA1c levels is crucial [2]. Nevertheless, despite this imperative, numerous patients with Type 1 diabetes (T1D) and Type 2 diabetes (T2D) struggle to attain these treatment objectives [3]. An increasing number of individuals with diabetes, especially those with poorly controlled blood glucose levels, strain healthcare resources. To address this, the 2022 Danish healthcare reform aimed to shift less complex treatments from specialists to general practitioners [4]. As a result, hospital specialists now concentrate on patients with T1D and those with T2D who face difficulties meeting treatment goals in primary care. Various factors contribute to these challenges, including aging or frail individuals, multimorbidity, low socioeconomic status, lack of social support, and limited health literacy [3]. Health literacy encompasses an individual’s ability to obtain, understand, and use basic health information and services to make informed health decisions [5]. This capability is vital for following treatment advice and achieving diabetes management goals. Limited health literacy affects up to half of Europe’s adult population [6], and up to one in five adults in Denmark [7]. Despite its importance in the patient-healthcare provider relationship, particularly for achieving treatment goals, research on health literacy levels among T1D and T2D patients remains limited. This highlights the need to identify effective communication strategies used by healthcare providers, especially when engaging with patients who struggle to meet treatment objectives due to low health literacy. Understanding this might enhance clinical outcomes and improve self-management and health-related quality of life. This study aims to explore the association between glycaemic levels and health literacy among outpatients with either T1D or T2D.
METHODS
Study Design, Setting and Participants
In this cross-sectional study, a questionnaire was sent to all adult patients affiliated with the diabetes outpatient clinic at Steno Diabetes Center Aarhus, Denmark, in February 2023. This specialised clinic serves approximately 3,500 patients with diabetes, two-thirds of whom have T1D, while the remaining patients have T2D. The questionnaire was distributed via e-Boks, a Danish digital communication platform between businesses, authorities, and citizens/patients. Patients were excluded if they had participated in the pilot test that omitted central questions for this study or if they did not have access to e-Boks. Additionally, patients were excluded if they had anaemia (haemoglobin levels: women < 7.3 mmol/L and men < 8.3 mmol/L) as it could result in falsely low HbA1c levels [8]. The study is reported in accordance with the STROBE checklist [9].
Exposure
The exposure, HbA1c (mmol/mol), is defined as the average blood glucose levels over the past two to three months [10]. Glycaemic levels were divided into tertiles (33.3% each) for T1D and T2D patients, with consideration given to glycaemic goal recommendations of <53 mmol/ mol, and consistently elevated levels can lead to serious complications [11,12]. Tertiles for T1D: tertile 1 (ranged between 29 and 53 mmol/mol), tertile 2 (ranged between 54 and 61 mmol/mol), and tertile 3 (ranged between 62 and 148 mmol/mol). Tertiles for T2D: tertile 1 (ranged between 34 and 53 mmol/mol), tertile 2 (ranged between 54 and 63 mmol/mol), and tertile 3 (ranged between 64 and 137 mmol/mol).
Variable of interest
Health literacy (variable of interest), refers to an individual’s ability to obtain, process, and comprehend essential health information needed for making informed decisions [7]. The distributed questionnaire included the validated Danish version of the Health Literacy Questionnaire [13], but only four of the nine independent dimensions were selected, as they are key predictors of “actively managing one’s health [7,14]. These included: 1) Having enough information to take care of your health and assess health information (4 items); 2) Appraisal of health information (4 items); 3) Actively engaging with healthcare providers (5 items); and 4) Understanding health information well enough to know what to do (5 items). For dimensions with four items, a 4-point Likert scale was used (Strongly disagree, Disagree, Agree, strongly agree), while a 5-point scale ranging from “Cannot do” to “Very easy” was applied to dimensions with five items.
Data Collection and Source
HbA1c (exposure) values were obtained by linking patients’ unique CPR numbers to the Central Denmark Region’s data warehouse [15]. This system compiles information from various clinical electronic health records and operational databases, capturing patient-specific data including demographics, medical history, diagnoses, treatments, and outcomes [15]. For each patient, the HbA1c value closest to the time of questionnaire distribution was used, with a maximum timeframe of one year prior. The distributed survey also included sociodemographic questions, such as sex, age, cohabitation status, and education levels, which are detailed in the tables in the results section. Additionally, the survey included five other validated questionnaires: 1) The Multimorbidity Treatment Burden Questionnaire (MTBQ) [16], evaluates patients’ perceptions of the effort required to manage their health and its impact on daily life. It consists of 10 items that assess treatment burden among patients with multimorbidity, categorised into four levels: no, low, medium, and high burden. 2) The Well-Being Index (WHO5) [17], measures positive psychological well-being on a scale from 0 to 100, with higher scores indicating better well-being. Scores below 50 suggest a risk of depression or long-term stress. 3) The Problem Areas in Diabetes (PAID-11) [18], assesses emotional distress related to diabetes using a short version with scores ranging from 0 to 44. Scores above 18 indicate severe diabetes-related distress. 4) The Major Depression Inventory (MDI-2) [19], is a shortened version of the MDI, including only the first two questions to assess core symptoms of depression. Responses are given on a Likert scale from 0 to 5, simplified to three options to ensure anonymity. 5) The Anxiety Symptom Questionnaire (ASS-2) [20], which includes two questions related to generalised anxiety, was used, with responses scored similarly to the MDI-2. Additionally, information on the Charlson Comorbidity Index [21], and duration of diabetes was provided by the Central Denmark Region’s data warehouse [15], with diabetes duration calculated from the year of diagnosis to 2023, when the questionnaire was distributed.
Covariables
Covariables were selected based on the literature and reflects findings that perceived low health literacy is particularly prevalent among older individuals, males, those with lower education levels, individuals living alone, and those with multimorbidity [6,7]. However, education level was excluded as a covariable because it is considered part of the causal pathway to low health literacy [22].
Statistical Methods
Descriptive statistics were conducted for both T1D and T2D groups across the three tertile exposure categories, describing sociodemographic, patient and diseaserelated data. Categorical variables were presented as proportions and percentages, while continuous variables were described using means and standard deviations. Differences in characteristics between tertile 1 and tertile 3 exposure groups were assessed using chi-squared tests for categorical data and unpaired t-tests for continuous data. Linear regression models were employed for both T1D and T2D, utilising dichotomous exposure (tertile 1 and tertile 3) and continuous outcome (health literacy). A health literacy domain score was deemed missing if more than two items were unanswered; in such cases, the score was computed using the mean of the remaining items [23]. For one or two missing items, single value imputation using the mean was applied [24]. Four separate regressions were conducted for each of the four domains in health literacy. Association measures were presented in both unadjusted and adjusted for potential covariable. Each association measure was presented with 95% confidence intervals (CIs) and p-values, with a significance level of 5%. Statistical analyses were conducted using Stata Statistical Software: Release 18, College Station, TX: StataCorp LLC.
RESULTS
In total, 3,652 patients were eligible to participate in the study. Of these, 582 were excluded: 256 were excluded for having participated in a pilot survey that omitted central questions for this study, 326 for not having access to e-Boks (Figure 1), and 214 patients were excluded because of anaemia (which might affect the HbA1c level) [8]. A total of 1604 patients did not respond, resulting in a response rate of 43.8% (N=1,252), with 849 patients having T1D and 403 patients having T2D.
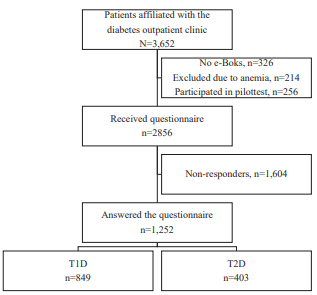
Figure 1 Flowchart of the study population.
Non-participants
In total, 326 patients were not registered with e-Boks, 256 patients had previously participated in a pilot test that omitted central questions for this study, and 214 patients had anaemia. 1,604 patients did not respond to the distributed questionnaire, forming a collective group of non-participants. Non-participants with T1D were significantly younger, more likely to be male, had shorter diabetes duration, fewer comorbidities, and higher HbA1c levels compared to responders with T1D (Appendix 1). Similarly, non-participants with T2D were significantly younger, had shorter diabetes duration, and higher HbA1c levels compared to responders with T2D (Appendix 1).
Description of the T1D Study Population
In total, 849 participants had T1D. Those in tertile 3 (mean HbA1c = 71.5mmol/mol), had lower education levels, a higher Charlson Comorbidity Index, poorer wellbeing, greater treatment burden, increased diabetesrelated stress, and higher anxiety and depression scores compared to those in tertile 1 (mean HbA1c = 47.4 mmol/ mol). These characteristics showed statistically significant differences between tertile 3 and tertile 1 (Table 1).
|
Table 1: Baseline characteristics of patients with T1D grouped in tertiles of HbA1c levels. |
|||||||
|
|
T1D |
|
|||||
|
|
Tertile 1 Mean HbA1C mmol/mol=47.4 (min.=29; max.=53) |
Tertile 2 Mean HbA1C mmol/mol=57.4 (min.=54; max.=61) |
Tertile 3 Mean HbA1C mmol/mol=71.5 (min.=62; max.=148) |
P-value Comparison between Tertile 1 and Tertile 3 |
|||
|
|
n=325 |
n=247 |
n=275 |
|
|||
|
|
n |
(%) |
n |
(%) |
n |
(%) |
|
|
Sex |
|
|
|
|
|
|
NS |
|
Female |
168 |
(51.7) |
122 |
(49.4) |
133 |
(48.4) |
|
|
Male |
157 |
(48.3) |
125 |
(50.6) |
142 |
(51.6) |
|
|
Age (years) |
50.2 a |
(17.9) a |
53.1 a |
(17.0) a |
52.4 a |
(17.7) a |
NS |
|
Cohabiting |
|
|
|
|
|
|
NS |
|
Yes |
243 |
(74.8) |
184 |
(74.5) |
189 |
(68.7) |
|
|
No |
77 |
(23.7) |
56 |
(22.7) |
74 |
(26.9) |
|
|
Missing |
5 |
(1.5) |
7 |
(2.8) |
12 |
(4.4) |
|
|
Education Level |
|
|
|
|
<0.01 |
||
|
None, short courses, other |
56 |
(17.2) |
46 |
(18.6) |
66 |
(24.0) |
|
|
Skilled worker (< 3 years) |
98 |
(30.2) |
70 |
(28.3) |
111 |
(40.4) |
|
|
Higher education (3-4 years) |
90 |
(27.7) |
69 |
(27.9) |
64 |
(23.3) |
|
|
Higher education (>4 years) |
79 |
(24.3) |
58 |
(23.5) |
30 |
(10.9) |
|
|
Missing |
2 |
(0.6) |
4 |
(1.6) |
4 |
(1.5) |
|
|
CCI |
|
|
|
|
|
|
0.01 |
|
Mild 1-2 |
227 |
(69.9) |
145 |
(58.7) |
156 |
(56.7) |
|
|
Moderate 3-4 |
81 |
(24.9) |
87 |
(35.2) |
90 |
(32.7) |
|
|
Severe 5 and >5 |
17 |
(5.2) |
15 |
(6.1) |
29 |
(10.6) |
|
|
Diabetes Duration |
24.1a |
(17.0) a |
25.7 a |
(15.5) a |
22.6 a |
(15.4) a |
NS |
|
MTBQ |
|
|
|
|
|
|
<0.01 |
|
No burden |
41 |
(12.6) |
30 |
(12.1) |
19 |
(6.9) |
|
|
Low burden |
91 |
(28.0) |
47 |
(19.0) |
53 |
(19.3) |
|
|
Medium burden |
97 |
(29.9) |
88 |
(35.6) |
77 |
(28.0) |
|
|
High burden |
82 |
(25.2) |
76 |
(30.8) |
100 |
(36.4) |
|
|
Missing |
14 |
(4.3) |
6 |
(2.4) |
26 |
(9.4) |
|
|
WHO-5 |
69.2 a |
(16.0) a |
65.9 a |
(16.3) a |
62.7 a |
(17.9) a |
<0.01 |
|
PAID-11 |
|
|
|
|
|
|
<0.01 |
|
No severe diabetes distress |
244 |
(75.1) |
195 |
(78.9) |
174 |
(63.3) |
|
|
Severe diabetes distress |
45 |
(13.8) |
35 |
(14.2) |
58 |
(21.1) |
|
|
Missing |
36 |
(11.1) |
17 |
(6.9) |
43 |
(15.6) |
|
|
MDI-1: Feeling sad? |
|
|
|
|
|
|
NS |
|
At no time |
98 |
(30.2) |
68 |
(27.5) |
66 |
(20.3) |
|
|
Less than half the time |
154 |
(47.4) |
147 |
(59.5) |
129 |
(39.7) |
|
|
More than half the time |
52 |
(16.0) |
24 |
(9.7) |
45 |
(13.8) |
|
|
Missing |
21 |
(6.5) |
8 |
(3.2) |
35 |
(10.8) |
|
|
MDI-2: Lack of interest? |
|
|
|
|
|
|
0.01 |
|
At no time |
106 |
(32.6) |
73 |
(29.6) |
59 |
(21.5) |
|
|
Less than half the time |
149 |
(45.8) |
138 |
(55.9) |
128 |
(46.6) |
|
|
More than half the time |
48 |
(14.8) |
27 |
(10.9) |
52 |
(18.9) |
|
|
Missing |
22 |
(6.8) |
9 |
(3.6) |
36 |
(13.1) |
|
|
ASS-1: Nervous, anxious? |
|
|
|
|
|
|
NS |
|
At no time |
112 |
(34.5) |
86 |
(34.8) |
77 |
(28.0) |
|
|
Less than half the time |
146 |
(44.9) |
119 |
(48.2) |
116 |
(42.2) |
|
|
More than half the time |
45 |
(13.8) |
30 |
(12.1) |
45 |
(16.4) |
|
|
Missing |
22 |
(6.8) |
12 |
(4.9) |
37 |
(13.5) |
|
|
ASS-2: Worried? |
|
|
|
|
|
|
0.03 |
|
At no time |
162 |
(49.8) |
129 |
(52.2) |
105 |
(38.2) |
|
|
Less than half the time |
104 |
(32.0) |
86 |
(34.8) |
104 |
(37.8) |
|
|
More than half the time |
37 |
(11.4) |
22 |
(8.9) |
31 |
(11.3) |
|
|
Missing |
22 |
(6.8) |
10 |
(4.0) |
35 |
(12.7) |
|
|
Note NS = not statistically significant a Continuous data are presented as mean and standard deviation (SD) |
|||||||
Description of the T2D Study Population
In total, 403 participants had T2D. Those in tertile 3 (mean HbA1c=76.8 mmol/mol), had a longer duration of diabetes, poorer well-being, and higher stress and anxiety scores compared to those in tertile 1 (mean HbA1c=46.6 mmol/mol). These characteristics showed statistically significant differences between tertile 3 and tertile 1 (Table 2).
|
Table 2: Baseline characteristics of patients with T2D grouped in tertiles of HbA1c levels. |
|||||||
|
|
T2D |
||||||
|
|
Tertile 1 Mean HbA1C mmol/mol=46.6 (min.=34; max.=53) |
Tertile 2 Mean HbA1C mmol/mol=58.1 (min.=54; max.=63) |
Tertile 3 Mean HbA1C mmol/ mol=76.8 (min.=64; max.=137) |
P-value Comparison between Tertile 1 and Tertile 3 |
|||
|
|
n=140 |
n=128 |
n=134 |
|
|||
|
|
n |
(%) |
n |
(%) |
n |
(%) |
|
|
Sex |
|
|
|
|
|
|
|
|
Female |
50 |
(35.7) |
48 |
(37.5) |
50 |
(37.3) |
NS |
|
Male |
90 |
(64.3) |
80 |
(62.5) |
84 |
(62.7) |
|
|
Age (years) |
64.8 a |
(13.0) a |
65.9 a |
(10.4) a |
64.2 a |
(11.5)a |
NS |
|
Cohabiting |
|
|
|
|
NS |
||
|
Yes |
85 |
(60.7) |
86 |
(67.2) |
86 |
(64.2) |
|
|
No |
46 |
(32.9) |
38 |
(29.7) |
39 |
(29.1) |
|
|
Missing |
9 |
(6.4) |
4 |
(3.1) |
9 |
(6.7) |
|
|
Education Level |
|
|
|
|
NS |
||
|
None, short courses, other |
36 |
(25.7) |
34 |
(26.6) |
37 |
(27.6) |
|
|
Skilled worker (< 3 years) |
49 |
(35.0) |
46 |
(35.9) |
47 |
(35.1) |
|
|
Higher education (3-4 years) |
33 |
(23.6) |
34 |
(26.6) |
31 |
(23.1) |
|
|
Higher education (>4 years) |
22 |
(15.7) |
12 |
(9.4) |
16 |
(11.9) |
|
|
Missing |
- |
- |
2 |
(1.6) |
3 |
(2.2) |
|
|
CCI |
|
|
|
|
NS |
||
|
Mild 1-2 |
54 |
(38.6) |
49 |
(38.3) |
51 |
(38.1) |
|
|
Moderate 3-4 |
46 |
(32.9) |
47 |
(36.7) |
52 |
(38.8) |
|
|
Severe 5 and >5 |
40 |
(28.6) |
32 |
(25.0) |
31 |
(23.1) |
|
|
Diabetes Duration |
13.5 a |
(10.1) a |
16.1 a |
(9.6) a |
16.6 a |
(9.0) a |
0.01 |
|
MTBQ |
|
|
|
|
|
|
NS |
|
No burden |
18 |
(12.9) |
18 |
(14.1) |
15 |
(11.2) |
|
|
Low burden |
36 |
(25.7) |
38 |
(29.7) |
27 |
(20.1) |
|
|
Medium burden |
49 |
(35.0) |
39 |
(30.5) |
36 |
(26.9) |
|
|
High burden |
33 |
(23.6) |
30 |
(23.4) |
47 |
(35.1) |
|
|
Missing |
4 |
(2.9) |
3 |
(2.3) |
9 |
(6.7) |
|
|
WHO-5 |
66.9 a |
(17.4) a |
67.7 a |
(16.2) a |
60.2a |
(18.8)a |
0.01 |
|
PAID-11 |
|
|
|
|
|
|
<0.01 |
|
No severe diabetes distress |
111 |
(79.3) |
98 |
(76.6) |
84 |
(62.7) |
|
|
Severe diabetes distress |
12 |
(8.6) |
19 |
(14.8) |
29 |
(21.6) |
|
|
Missing |
17 |
(12.1) |
11 |
(8.6) |
21 |
(15.7) |
|
|
MDI-1 Feeling sad? |
|
|
|
|
|
|
<0.01 |
|
At no time |
33 |
(23.6) |
37 |
(28.9) |
38 |
(28.4) |
|
|
Less than half the time |
77 |
(55.0) |
57 |
(44.5) |
59 |
(44.0) |
|
|
More than half the time |
25 |
(17.9) |
31 |
(24.2) |
25 |
(18.7) |
|
|
Missing |
5 |
(3.6) |
3 |
(2.3) |
15 |
(9.0) |
|
|
MDI-2: Lack of interest? |
|
|
|
|
|
|
0.01 |
|
At no time |
33 |
(23.6) |
44 |
(34.4) |
26 |
(19.4) |
|
|
Less than half the time |
78 |
(55.7) |
46 |
(35.9) |
65 |
(48.5) |
|
|
More than half the time |
23 |
(16.4) |
35 |
(27.3) |
31 |
(23.1) |
|
|
Missing |
6 |
(4.3) |
3 |
(2.3) |
12 |
(9.0) |
|
|
ASS-1: Nervous, anxious? |
|
|
|
|
|
|
0.04 |
|
At no time |
45 |
(32.1) |
40 |
(31.3) |
40 |
(29.9) |
|
|
Less than half the time |
62 |
(44.3) |
65 |
(50.8) |
57 |
(42.5) |
|
|
More than half the time |
25 |
(17.9) |
20 |
(15.6) |
25 |
(18.7) |
|
|
Missing |
8 |
(5.7) |
3 |
(2.3) |
12 |
(9.0) |
|
|
ASS-2: Worried? |
|
|
|
|
|
|
<0.01 |
|
At no time |
57 |
(40.7) |
56 |
(43.8) |
52 |
(38.8) |
|
|
Less than half the time |
61 |
(43.6) |
52 |
(40.6) |
53 |
(39.6) |
|
|
More than half the time |
18 |
(12.9) |
16 |
(12.5) |
18 |
(13.4) |
|
|
Missing |
4 |
(2.9) |
4 |
(3.1) |
11 |
(8.2) |
|
|
Note NS = not statistically significant a Continuous data are presented as mean and standard deviation (SD) |
|||||||
Associations
For T1D, tertile 3 (highest HbA1c) generally showed lower scores across all four health literacy dimensions compared to tertile 1. Statistically significant differences indicated that tertile 3 had lower scores in dimensions 2, 6, and 9; ‘Having sufficient information to manage health,’ ‘Ability to actively engage with healthcare providers,’ and ‘Understanding health information well enough to know what to do’ (Table 3). Adjustment for sex, age cohabiting and CCI did not have a strong impact on the associations. For T2D, statistically significant differences were found only in dimension 9; ‘Understanding health information well enough to know what to do’. There is a tendency for mean Health Literacy scores to be lower in tertile 3 than in tertile 1 for both T1D and T2D patients across all dimensions (Table 3 and 4).
Table 3: Associations between HbA1c of tertiles 1 and 3 and health literacy in patients with T1D.
|
|
T1D |
|||||||
|
HL dimensions |
Range |
n |
Tertile 1 Mean HbA1C mmol/ mol=47.4 (min.=29; max.=53) |
Tertile 2 Mean HbA1C mmol/ mol=57.4 (min.=54; max.=61) |
Tertile 3 Mean HbA1C mmol/mol=71.5 (min.=62; max.=148) |
Mean HL difference |
(95% CI) |
P-value Comparison between Tertile 1 and Tertile 3 |
|
2: Having sufficient information to manage health |
|
|||||||
|
Model 1, unadjusted, mean (SD) |
1-4 |
770 |
3.3 (0.6) (Reference) |
3.2 (0.6) |
3.1 (0.5) |
-0.20 |
(-0.30;-0.10) |
<0.001 |
|
Model 2, adjusted, mean (SD) |
|
|
|
|
|
-0.18* |
(-0.28;-0.08) |
0.001 |
|
5: Appraisal of health information |
|
|||||||
|
Model 1, unadjusted, mean (SD) |
1-4 |
758 |
2.9 (0.6) (Reference) |
2.8 (0.6) |
2.7 (0.5) |
-0.12 |
(-0.22;-0.02) |
0.017 |
|
Model 2, adjusted, mean (SD) |
|
|
|
|
|
-0.10* |
(-0.20;-0.00) |
0.051 |
|
6: Ability to actively engage with healthcare providers |
|
|||||||
|
Model 1, unadjusted, mean (SD) |
1-5 |
759 |
4.0 (0.8) (Reference) |
4.0 (0.7) |
3.9 (0.8) |
-0.17 |
(-0.30;-0.03) |
0.014 |
|
Model 2, adjusted, mean (SD) |
|
|
|
|
|
-0.16* |
(-0.30;-0.03) |
0.015 |
|
9: Understanding health information well enough to know what to do |
|
|||||||
|
Model 1, unadjusted, mean (SD) |
1-5 |
755 |
4.2 (0.6) (Reference) |
4.1 (0.6) |
4.0 (0.6) |
-0.22 |
(-0.33;-0.11) |
<0.001 |
|
Model 2, adjusted, mean (SD) |
|
|
|
|
|
-0.20* |
(-0.30;-0.09) |
<0.001 |
Table 4: Associations between HbA1c tertiles 1 and 3 and Health Literacy in patients with T2D
|
|
T2D |
|||||||
|
HL dimensions |
Range |
n |
Tertile 1 Mean HbA1C mmol/ mol=46.6 (min.=34; max.=53) |
Tertile 2 Mean HbA1C mmol/ mol=58.1 (min.=54; max.=63) |
Tertile 3 Mean HbA1C mmol/ mol=76.8 (min.=64; max.=137) |
Mean HL difference |
(95% CI) |
P-value Comparison between Tertile 1 and Tertile 3 |
|
2: Having sufficient information to manage health |
|
|||||||
|
Model 1, unadjusted, mean (SD) |
1-4 |
371 |
3.1 (0.6) (Reference) |
3.1 (0.6) |
2.9 (0.6) |
-0.15 |
(-0.14; 0.15) |
0.051 |
|
Model 2, adjusted, mean (SD) |
|
|
|
|
|
-0.14* |
(-0.29; 0.00) |
0.057 |
|
5: Appraisal of health information |
|
|||||||
|
Model 1, unadjusted, mean (SD) |
1-4 |
361 |
2.7 (0.6) (Reference) |
2.7 (0.6) |
2.6 (0.6) |
-0.09 |
(-0.24; 0.07) |
0.274 |
|
Model 2, adjusted, mean (SD) |
|
|
|
|
|
-0.09* |
(-0.25; 0.07) |
0.058 |
|
6: Ability to actively engage with healthcare providers |
|
|||||||
|
Model 1, unadjusted, mean (SD) |
1-5 |
366 |
4.0 (0.8) (Reference) |
3.8 (0.8) |
3.8 (0.8) |
-0.19 |
(-0.40; -0.02) |
0.070 |
|
Model 2, adjusted, mean (SD) |
|
|
|
|
|
-0.19* |
(-039; 0.02) |
0.072 |
|
9: Understanding health information well enough to know what to do |
|
|||||||
|
Model 1, unadjusted, mean (SD) |
1-5 |
363 |
3.9 (0.7) (Reference) |
3.9 (0.6) |
3.6 (0.8) |
-0.21 |
(-0.39; -0.04) |
0.019 |
|
Model 2, adjusted, mean (SD) |
|
|
|
|
|
-0.21* |
(-0.39; -0.03) |
0.020 |
DISCUSSION
This study aimed to explore the association between glycaemic levels and patient health literacy in outpatients with diabetes. The findings showed that outpatients in tertile 3 (those with highest HBA1c levels), had significantly lower health literacy than those in tertile 1 (lowest HbA1c), in certain domains, depending on diabetes type. Patients with T1D faced challenges both in “obtaining information and engaging with healthcare providers” as well as having challenges in “understanding health information well enough to know what to do”. In contrast, patients with type 2 diabetes only had challenges in “understanding health information well enough to know what to do”.
Our findings for patients with T1D align with previous research [25], whereas there is very limited research on patients with T2D in this context. We found that both types of diabetes in tertile 3 scored lower on ‘understanding health information well enough to know what to do’ compared to tertile 1, which is a key factor in effective diabetes management and achieving treatment goals. It is important to note that, despite statistically significant differences, the results reflect a mean score that, indicates that ‘sometimes it is difficult’. This lacks clarity regarding what it was that the patients found difficult to understand, highlighting the need for a qualitative approach to identify specific knowledge gaps and optimise patient understanding. However, it is well established that patients with low health literacy often struggle to fully grasp and follow medical instructions, which can result in missed follow-up visits, delays in seeking care, and ultimately, poorer health outcomes [26,27]. This highlights the need for additional support to help these patients achieve stable blood glucose levels. Although educational interventions have been shown to improve glycaemic control [28], evidence on their effectiveness for individuals with low health literacy remains limited, particularly in terms of their engagement and the factors influencing outpatient appointment non-attendance. This is especially concerning, as non-attendance at outpatient appointments has been linked to higher HbA1c levels [29].
In our study, information on patients who missed outpatient visits could not be included, as it was not recorded. This may introduce bias, although the extent of it remains unclear. Furthermore, our findings may stem from the challenges faced by patients with complex health conditions and treatment burdens, including difficulty in understanding their conditions, attending appointments, managing intricate medication regimens, and navigating fragmented communication and coordination among multiple healthcare providers, which often leave them feeling lost within the healthcare system [30,31]. Additionally, this gap could be influenced by factors related to the patienthealthcare providers relationship, such as unequal power dynamics, trust issues, communication challenges, and conflicting advice [32], or the lack of patient involvement in decision-making [33].
These factors may affect how well patients adhere to recommended diabetes treatment. Achieving better outcomes might require a more holistic approach, where clinicians use communication strategies that uncover the challenges patients face that impact their daily diabetes management. This can impose demands on how clinics are organised, where physicians’ consultations often are limited to 15 minutes and nursing consultations to 20 minutes, as seen in the diabetes clinic at SDCA. Clinic organisation alone may not suffice to address this challenge, as a potential explanation for why patients in tertile 3 struggle to manage their diabetes treatment may involve factors spanning both clinical and communitybased components [34], as well as self-management [35], and social support, which has been reported as an important aspect of improving diabetes management outcomes [36]. It is noteworthy that several patients in the tertile 1, despite reporting low health literacy, were able to achieve well-regulated blood glucose levels. While our study did not explore how this group achieved these positive outcomes, understanding this could be crucial for future research, especially in identifying strategies or support mechanisms that could benefit patients in tertile 3.
Strengths and limitations
In this large study, all adult patients affiliated with SDCA were invited to participate, with approximately half responding to the survey. Analysis of non-responders revealed that they were significantly more likely to be younger, male, have a shorter duration of diabetes, fewer comorbidities, and higher HbA1c levels compared to responders, findings similar to another study [14]. This may have introduced bias, although the extent is unclear, as the level of health literacy among non-responders is unknown and other factors could also influence the results. For example, evidence shows that barriers to self-care in young adults with type 2 diabetes highlight the common experience of stigma and self-blame, which contribute to poorer self-care behaviours and increased psychological burden [37]. Similarly, in young adults with type 1 diabetes barriers include stress, time pressure and planning, lack of social support, lack of parental autonomy support, and stigma related to diabetes self-management [38].
Furthermore, a strength of our study is the exclusion of patients with anaemia, as HbA1c levels can be falsely elevated or decreased in various forms of anaemia, making it an unreliable measure of glucose control in these individuals. However, a limitation of our study is its reliance on a single HbA1c measurement instead of an average over time, which may have introduced bias and affected the accuracy of our results. Health literacy was assessed using a validated questionnaire. However, self-report questionnaires may be biased due to challenges in self-assessment [39], particularly in clinical settings where patients might feel embarrassed about their health literacy [40], which could have influenced our findings. We selected four of the nine identified health literacy dimensions, as they are key predictors of “actively managing one’s health” [7,14], making them highly relevant to the study’s objectives and essential for understanding health management behaviours.
CONCLUSION
This study highlights that outpatients with poor glycaemic control tend to have lower health literacy compared to those with well-regulated control. It also points to the broader issue that many diabetes patients, regardless of their HbA1c levels, face significant challenges in understanding health information. Improving patient health literacy is essential, and further research is needed to explore why both T1D and T2D patients struggle to fully comprehend health information and take appropriate actions. Gaining this insight is critical for developing effective, targeted strategies and support mechanisms to assist patients with poor glycaemic control and ultimately improve their health outcomes.
ACKNOWLEDGMENT
We sincerely thank everyone who took the time to complete the questionnaire. Your participation was essential, and without your contributions, this study would not have been possible.
Author Contributions
SBP and CGP recruited participants and distributed the questionnaire. MS and CGP managed and analyzed the data, with the analyses discussed among all authors. MS and CGP were the primary writers, while MA, TBM, and SBP provided valuable feedback on the article. All authors read and approved the final manuscript
Funding Statement
The study has received funding from the Novo Nordisk Foundation, grant number NNF20SA0035556..
Ethical Considerations
The study was approved by the Central Denmark Region Committees on Health Research Ethics (Jr. number 1-16-02-54-23) and did not require approval from the Scientific Ethical Committees for the Central Denmark Region (Jr. number 1-10-72-6-23).
Data Availability
Data are available upon reasonable request.
References
- Global, regional, and national burden of diabetes from 1990 to 2021, with projections of prevalence to 2050: a systematic analysis for the Global Burden of Disease Study 2021. Lancet. 2023; 402: 203-234.
- Fredrix M, McSharry J, Flannery C, Dinneen S, Byrne M. Goal-setting in diabetes self-management: A systematic review and meta-analysis examining content and effectiveness of goal-setting interventions. Psychol Health. 2018; 33: 955-977.
- Sibounheuang P, Olson PS, Kittiboonyakun P. Patients’ and healthcare providers’ perspectives on diabetes management: A systematic review of qualitative studies. Res Social Adm Pharm. 2020; 16: 854-874.
- Sundhedsministeriet. Regeringen, KL og Danske Regioner er enige om gennemførelsen af sundhedsreformen [Internet] [In Danish]. Ministry of the Interior and Health. Copenhagen (DK). 2024.
- Watts SA, Stevenson C, Adams M. Improving health literacy in patients with diabetes. Nursing. 2017; 47: 24-31.
- Sørensen K, Pelikan JM, Röthlin F, Ganahl K, Slonska Z, Doyle G, et al. Health literacy in Europe: comparative results of the European health literacy survey (HLS-EU). Eur J Public Health. 2015; 25: 1053-1058.
- Bo A, Friis K, Osborne RH, Maindal HT. National indicators of health literacy: ability to understand health information and to engage actively with healthcare providers - a population-based survey among Danish adults. BMC Public Health. 2014; 14: 1095.
- English E, Idris I, Smith G, Dhatariya K, Kilpatrick ES, John WG. The effect of anaemia and abnormalities of erythrocyte indices on HbA1c analysis: a systematic review. Diabetologia. 2015; 58: 1409-1421.
- von Elm E, Altman DG, Egger M, Pocock SJ, Gøtzsche PC, Vandenbroucke JP. The Strengthening the Reporting of Observational Studies in Epidemiology (STROBE) statement: guidelines for reporting observational studies. J Clin Epidemiol. 2008; 61: 344-349.
- Sherwani SI, Khan HA, Ekhzaimy A, Masood A, Sakharkar MK. Significance of HbA1c Test in Diagnosis and Prognosis of Diabetic Patients. Biomark Insights. 2016; 11: 95-104.
- 6. Glycemic Goals and Hypoglycemia: Standards of Care in Diabetes—2025. Diabetes Care. 2025; 48: S128-S145.
- Tomic D, Shaw JE, Magliano DJ. The burden and risks of emerging complications of diabetes mellitus. Nat Rev Endocrinol. 2022; 18: 525-539.
- Maindal HT, Kayser L, Norgaard O, Bo A, Elsworth GR, Osborne RH. Cultural adaptation and validation of the Health Literacy Questionnaire (HLQ): robust nine-dimension Danish language confirmatory factor model. Springerplus. 2016; 5: 1232.
- Olesen K, AL FR, Joensen L, Ridderstråle M, Kayser L, Maindal HT, et al. Higher health literacy is associated with better glycemic control in adults with type 1 diabetes: a cohort study among 1399 Danes. BMJ Open Diabetes Res Care. 2017; 5: e000437.
- J.R. B-E. Description of the BI Data Warehouse for reserarch purposes in Cental Denmark Region. 2023. 2024.
- Pedersen MH, Duncan P, Lasgaard M, Friis K, Salisbury C, Breinholt Larsen F. Danish validation of the Multimorbidity Treatment Burden Questionnaire (MTBQ) and findings from a population health survey: a mixed-methods study. BMJ Open. 2022; 12: e055276.
- Topp CW, Østergaard SD, Søndergaard S, Bech P. The WHO-5 Well- Being Index: a systematic review of the literature. Psychother Psychosom. 2015; 84: 167-176.
- Stanulewicz N, Mansell P, Cooke D, Hopkins D, Speight J, Blake H. PAID-11: A brief measure of diabetes distress validated in adults with type 1 diabetes. Diabetes Res Clin Pract. 2019; 149: 27-38.
- Bech P, Timmerby N, Martiny K, Lunde M, Soendergaard S. Psychometric evaluation of the Major Depression Inventory (MDI) as depression severity scale using the LEAD (Longitudinal Expert Assessment of All Data) as index of validity. BMC Psychiatry. 2015; 15: 190.
- Baker A, Simon N, Keshaviah A, Farabaugh A, Deckersbach T, Worthington JJ, et al. Anxiety Symptoms Questionnaire (ASQ): development and validation. Gen Psychiatr. 2019; 32: e100144.
- Charlson ME, Pompei P, Ales KL, MacKenzie CR. A new method of classifying prognostic comorbidity in longitudinal studies: development and validation. J Chronic Dis. 1987; 40: 373-383.
- Bailey SC, Brega AG, Crutchfield TM, Elasy T, Herr H, Kaphingst K, et al. Update on health literacy and diabetes. Diabetes Educ. 2014; 40: 581-604.
- Osborne RH, Batterham RW, Elsworth GR, Hawkins M, BuchbinderR. The grounded psychometric development and initial validation of the Health Literacy Questionnaire (HLQ). BMC Public Health. 2013; 13: 658.
- Pedersen AB, Mikkelsen EM, Cronin-Fenton D, Kristensen NR, Pham TM, Pedersen L, et al. Missing data and multiple imputation in clinical epidemiological research. Clin Epidemiol. 2017; 15: 157-166.
- Swift PG, Skinner TC, de Beaufort CE, Cameron FJ, Aman J, Aanstoot HJ, et al. Target setting in intensive insulin management is associated with metabolic control: the Hvidoere childhood diabetes study group centre differences study 2005. Pediatr Diabetes. 2010; 11: 271-278.
- Shahid R, Shoker M, Chu LM, Frehlick R, Ward H, Pahwa P. Impact of low health literacy on patients’ health outcomes: a multicenter cohort study. BMC Health Serv Res. 2022; 22: 1148
- Coughlin SS, Vernon M, Hatzigeorgiou C, George V. Health Literacy, Social Determinants of Health, and Disease Prevention and Control. J Environ Health Sci. 2020; 6.
- Shiferaw WS, Akalu TY, Desta M, Kassie AM, Petrucka PM, Aynalem YA. Effect of educational interventions on knowledge of the disease and glycaemic control in patients with type 2 diabetes mellitus: a systematic review and meta-analysis of randomised controlled trials. BMJ Open. 2021; 11: e049806.
- Brewster S, Bartholomew J, Holt RIG, Price H. Non-attendance at diabetes outpatient appointments: a systematic review. Diabet Med. 2020; 37: 1427-1442.
- Mercer S, Furler J, Moffat K, Fischbacher-Smith D, Sanci L. Multimorbidity: technical series on safer primary care. World Health Organization; 2016.
- Schiøtz ML, Høst D, Frølich A. Involving patients with multimorbidity in service planning: perspectives on continuity and care coordination. J Comorb. 2016; 6: 95-102.
- Mohammed MA, Moles RJ, Chen TF. Medication-related burden and patients’ lived experience with medicine: a systematic review and metasynthesis of qualitative studies. BMJ Open. 2016; 6: e010035.
- Marzban S, Najafi M, Agolli A, Ashrafi E. Impact of Patient Engagement on Healthcare Quality: A Scoping Review. J Patient Exp. 2022; 9: 23743735221125439.
- Albertson EM, Chuang E, O’Masta B, Miake-Lye I, Haley LA, PouratN. Systematic Review of Care Coordination Interventions Linking Health and Social Services for High-Utilizing Patient Populations. Popul Health Manag. 2022; 25: 73-85.
- Lorig KR, Holman H. Self-management education: history, definition,outcomes, and mechanisms. Ann Behav Med. 2003; 26: 1-7.
- Strom JL, Egede LE. The impact of social support on outcomes in adult patients with type 2 diabetes: a systematic review. Curr Diab Rep. 2012; 12: 769-781.
- Wong SKW, Soon W, Griva K, Smith HE. Identifying barriers and facilitators to self care in young adults with type 2 diabetes. Diabet Med. 2024; 41: e15229.
- Momani AM, Callery P, Lin YL, Abduelkader RH, Khalil H. “I Like People to Treat Me Normally”: Barriers to Type 1 Diabetes Self- Management Among Adolescents. Clin Diabetes. 2022; 40: 196-203.
- Althubaiti A. Information bias in health research: definition, pitfalls,and adjustment methods. J Multidiscip Healthc. 2016; 9: 211-217.
- Parikh NS, Parker RM, Nurss JR, Baker DW, Williams MV. Shame and health literacy: the unspoken connection. Patient Educ Couns. 1996; 27: 33-39.


