Change in the Relationships between Treatment of Hypertension and Stages of Chronic Kidney Disease in American Adults
- 1. Department of Epidemiology and Biostatistics, SUNY Downstate Medical Center, USA
- 2. Department of Medicine, State University of New York Downstate Medical Center, USA
Abstract
Importance: Proper treatment of high blood pressure in patients with CKD can slow the progression of kidney disease. However, recent studies have suggested a potential causal link between intensive treatment of hypertension and kidney injury.
Objective: To test for change in the relationships between treatment of hypertension (HTN) and stages of Chronic Kidney Disease (CKD) in American adults.
Design: Eight, cross-sectional data sets from the U.S. National Health and Nutrition Examination Survey (NHANES: 1999-2014) were pooled to address the study objective.
Setting: NHANES is a survey based on a representative sample of non-institutionalized US civilian residents. The National Center of Health Statistics (NCHS) approved the protocol for NHANES, and all participants signed informed consent forms.
Participants: American adults 18 years of age or older with data about hypertension treatment, measured blood pressure, estimated glomerular filtration rates (eGFR) and urine albumin/creatinine ratios (ACR). The analysis data set consisted of 82,091 records, of which 5,330 satisfied the inclusion criteria and were hypertensive with CKD.
Main Outcome(s) and Measure(s): Inferential analyses were performed with multinomial logistic regression models where CKD stages served as the dependent variable; Time, an ordinal variable, and Treatment, a dichotomous variable, served as two independent variables; Time by Treatment interaction terms were used to test for the change in odds ratios by treatment groups over time.
Results: Over a 16-year time interval, there was a steady, statistically significant increase in the odds of CKD stage 3 versus stage 1 in Treated compared to Untreated for HTN (p= 0.002 in the model without covariates, and p= 0.026 in the model with the covariates). For example, in 1999 the adjusted odds ratio for stage 3 vs. stage 1 demonstrated that odds were essentially the same in the treated and the untreated (OR=1.34, 95% CI: 0.87, 2.09), but by2014 the odds ratio had increased to 3.42 (95% CI: 2.00, 5.84).
Conclusions and relevance: Possibly, intensive treatment of hypertension in patients with CKD might have increased the prevalence of advanced stages of CKD; however, future longitudinal cohort studies are required to establish the temporal causal sequence in the relationship.
Keywords
• Chronic kidney disease
• Chronic kidney disease progression
• Hypertension
• Treatment of hypertension
Citation
Komaroff M, Tedla F, Helzner E, Joseph MA (2018) Change in the Relationships between Treatment of Hypertension and Stages of Chronic Kidney Disease in American Adults. J Chronic Dis Manag 3(1): 1020
INTRODUCTION
Hypertension can cause kidney disease, or can exist as a comorbid condition contributing to kidney disease progression [1-14]. Control of high blood pressure is essential for preventing complications of hypertension, including progression of kidney disease. In 2003, the Seventh Report of the Joint National Committee on Prevention, Detection, Evaluation, and Treatment of High Blood Pressure (JNC 7) recommended an aggressive pharmacological therapy to reach target blood pressure of <130/80 mmHg for hypertensive CKD. This was lower than the target of <140/90 mmHg that was recommended for the general population [5,7].
Recent observational studies and clinical trials have suggested a potential relationship between treatment of hypertension (HTN) and kidney damage [15,16]. Some have argued that there was insufficient evidence for lowering the target of < 130/80 mmHg for all patients with CKD irrespective of severity of the disease, and/or comorbidities [17,18]. Similar to the increased tendency for kidney injury observed in SPRINT [16], increase in treatment of hypertension in American adults could be associated with progression of chronic kidney disease. To date, there have been no estimates of the relationships between treatment of HTN and stages of CKD, nor any consideration of whether these relationships have changed in the last decade.
The goal of the current study is to test for changes in the association between treatment of HTN and CKD stages across eight data collection time points spanning a 16-year interval from 1999 to 2014. It was during this time interval that a public health campaigns were promoted to aggressively treat and lower blood pressure with medications in patients with CKD. If the recommended strategy of aggressive pharmacological treatment of hypertension in patients with CKD worked, then the prevalence of advanced stages should have decreased, or at least remained stable.
METHODS
Database overview
The U.S. National Health and Nutrition Examination Survey (NHANES) is a representative sample of non-institutionalized US civilian residents. Data were collected using a complex, multistage, cluster, probability sampling strategy that incorporates differential probabilities of selecting participants. Surveys are currently conducted every 2 years and consist of a standardized in-home interview, physical examination, and blood and urine collection at a mobile examination center (MEC) [19,20].
The current study was granted an exemption by the IRB office of SUNY Downstate Medical Center because the NHANES data sets were open access for the public use and did not contain any protected health information.
Study design
Eight cross-sectional data sets were stacked (pooled) corresponding to NHANES data collection cycles: 1999-2000, 2001-2002, 2003-2004, 2005-2006, 2007-2008, 2009-2010, 20011-2012, and 2013-2014.
Study population
Participants who were 18 years of age or older, reported demographic information (age, gender, and race), provided self-reported information on hypertension including treatment, had blood pressure measured, had measures of estimated glomerular filtration rate (eGFR) and urine albumin/creatinine ratio (ACR), and were not pregnant if female, were included in the study. The analytic data set was comprised of hypertensive individuals with CKD.
Data collection and data management
Demographic characteristics such as age, gender, race/ ethnicity, smoking status, treatment of hypertension, diabetes were obtained by questionnaires. Assessment of blood pressure, urine albumin and creatinine concentrations, serum creatinine and albumin concentrations, and the body mass index (BMI) were obtained by clinical examination. The techniques for the clinical measurements are described in the methods section of the Data Supplements of NHANES [19,20]. Glomerular filtration rates (GFR) were measured using the Modification of Diet in Renal Disease (MDRD) technique [6].
Clinical definitions of disease
Chronic Kidney Disease was defined by the level of GFR and the urine albumin-to-creatinine ratio (ACR) according to the NKF/KDOQI 2002/2012 criteria [6,21]. The stages of CKD and albumin to creatinine ratio (ACR) were classified following the National Kidney Foundation Kidney Disease Outcomes Quality Initiative [6,21].
Criteria for hypertensive CKD was based on JNC-7 guideline stipulating a systolic blood pressure greater than or equal to 130 mmHg or diastolic blood pressure greater than or equal to 80 mmHg; or participant were currently on prescribed medication to low high blood pressure based on affirmative responses to the following questions: “Because of your high blood pressure/ hypertension, have you ever been told to take prescribed medicine?”, and “Are you now following this advice to take prescribed medicine?”[7,21]
Database
The eight NHANES data sets consisted of 82,091 unique records (study IDs); however, the number of participants who satisfied the inclusion criteria for the objectives of current study was 5,330 (Figure 1: The Consort flow diagram).
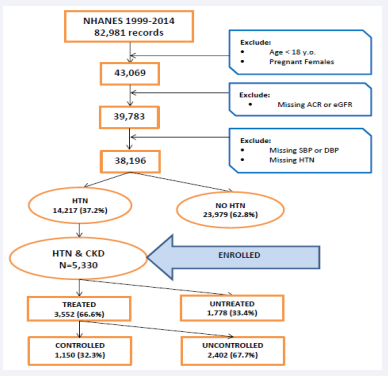
Figure 1: Consort Flow Diagram.
Statistical analyses
The prevalence of CKD stages by treatment of hypertension were age-standardized to the 2000 US standard population using four age groups [21]. Variance estimation was performed utilizing Taylor series method. Relative standard errors (RSE) for prevalence estimates greater than 30% were considered potentially statistically unreliable per NHANES Analytic Guidance [20].
Model description
Multinomial logistic regression models were used to investigate the relationships between CKD stages and treatment of HTN. In the model, the ordinal variable coded for three stages of CKD was the dependent variable (outcome), Time was an ordinal variable, and Treatment was a dichotomous variable (yes/no). The Time by Treatment interaction tested for effect modification or change in odds ratios over time. Specifically, there were two beta coefficients for each independent variable in the model. One exponentiated coefficient represented the odds of stage 3 vs stage 1 where the prevalence of stage 3 was divided by the prevalence of stage 1. The second exponentiated coefficient was for the odds of stage 2 vs stage 1, where the prevalence of the second stage was divided by the prevalence of the first stage. As a result, there were two odds ratios produced by the model. One odds ratio represented the odds of stage 3 to stage 1 in the Treated Group divided by the odds of stage 3 to stage 1 in the Untreated group. These two odds ratios were based on the pooled data over the eight NHANES surveys (for example, see Equation1).
(1)
Similarly, there were two exponentiated coefficients for Time as an 8-point ordinal variable. One OR for time was based on the odds of stage 3 vs stage 1 across both treated and untreated groups (see Equation 2).
(2)
i, j = 1 to 8, where i ≠ j
The interaction term in each model (Time x Treatment) provided a test of the null hypothesis of no difference in the odds ratios for advanced vs first stage of CKD for treated vs. untreated across time. A second model was run with the following covariates: age, gender, race/ethnicity, BMI, and smoking status, to adjust for any potential confounding.
Data management and statistical analyses were conducted using the SAS® System for Windows (release 9.3; SAS® Institute Inc., Cary, N.C.).
RESULTS
Prevalence
Table 1 and Figure 2 provide the prevalence percentages (standard errors) of hypertensive CKD over the 16-year time interval.
Table 1: Age-standardized$ prevalence of chronic kidney disease stages by treatment of hypertension in American adults 18 years of age or older: NHANES 1999-2000 through 2013-2014.
| 1999-2000 | 2001-2002 | 2003-2004 | 2005-2006 | 2007-2008 | 2009-2010 | 2011-2012 | 2013-2014 | ||||||||||
| Pop | CKD | No | Yes | No | Yes | No | Yes | No | Yes | No | Yes | No | Yes | No | Yes | No | Yes |
| N | N | N | N | N | N | N | N | N | N | N | N | N | N | N | N | ||
| %(SE) | %(SE) | %(SE) | %(SE) | %(SE) | %(SE) | %(SE) | %(SE) | %(SE) | %(SE) | %(SE) | %(SE) | %(SE) | %(SE) | %(SE) | %(SE) | ||
| CKD&HTN | Total N | 598 | 647 | 624 | 573 | 793 | 725 | 665 | 705 | ||||||||
| TREATED | 50.37 (2.38) | 53.18 (2.92) | 62.98 (3.81) | 60.27 (3.14) | 63.91 (1.93) | 65.70 (2.44) | 64.10 (2.70) | 64.70 (2.35) | |||||||||
| 267 | 331 | 268 | 379 | 212 | 412 | 202 | 371 | 248 | 545 | 189 | 536 | 194 | 471 | 198 | 507 | ||
| TREATED | CKD | ||||||||||||||||
| Stage1 | 63 25.47 (3.18) | 41 16.80 (4.78) | 60 20.16 (2.62) | 50 18.53 (2.74) | 40 20.16 (3.27) | 43 19.77 (2.27 | 54 23.60 (3.00) | 44 18.22 (2.83) | 91 28.27 (4.16) | 73 16.60 (2.17) | 59 22.28 (5.26) | 48 13.47 (2.63) | 79 32.99 (5.43) | 68 19.37 (2.81) | 66 27.12 (3.76) | 62 16.68 (2.90) | |
| Stage2 | 81 29.02 (4.51) | 88 30.94 (3.89) | 95 36.64 (3.87) | 74 19.54 (4.51) | 61 36.82 (3.15) | 96 25.86 (3.15) | 60 29.83 (2.84) | 88 23.90 (3.11) | 72 29.22 (2.52) | 132 29.00 (3.79) | 48 30.28 (4.76) | 129 28.47 (4.52) | 48 27.15 (4.23) | 111 22.18 (3.01) | 62 29.61 (3.96) | 122 23.67 (3.04) | |
| Stage3 | 122 45.47 (3.14 | 181 42.67 (3.37) | 109 42.28 (5.01) | 232 57.36 (5.36) | 106 41.14 (3.80) | 247 50.87 (3.72) | 84 44.99 (3.06) | 214 53.30 (4.28) | 83 41.82 (4.73) | 309 50.79 (5.24) | 79 45.99 (6.64) | 321 50.88 (4.44) | 62 36.14 (3.87) | 260 53.11 (4.40) | 65 40.95 (3.86) | 294 55.47 (4.61) | |
| Stage4&5 | 1* 0.03 (0.03) | 21 9.58 (2.81) | 4* 0.91 (0.50) | 23 4.56 (1.23) | 5* 1.87 (1.17) | 26 3.48 (0.94) | 4* 1.57 (0.83) | 25* 4.57 (1.55) | 2* 0.68 (0.52) | 31 3.60 (0.48) | 3* 1.45 (0.98) | 38 7.18 (1.80) | 5* 3.71 (1.79) | 32 5.32 (1.09) | 5* 2.31 (1.09) | 29 4.17 (1.14) | |
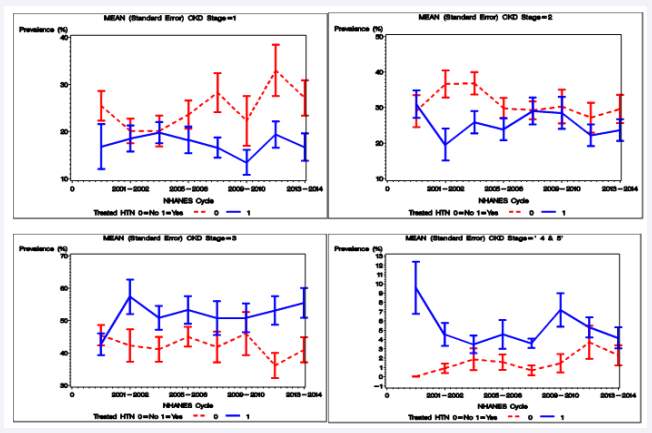
Figure 2 Age-Standardized$ Prevalence of Chronic Kidney Disease Stages by Treatment of Hypertension in American Adults18 years of age or older: NHANES 1999- 2000 through 2013-2014.
In 1999, the prevalence of overall CKD stages (1 to 4) increased from 50.37% (2.38) in 1999 to 64.70 % (2.35) in 2014for CKD patients who were treated for HTN. Because the count of advanced stages (4 or 5) were not reliable according to the Relative Standard Error (RSE) criteria >30by NHANES guidelines [20], the analysis of change in odds ratios (below) were restricted to the first three CKD stages.
Relationships between treatment HTN and stages of CKD
Cross-sectional analyses: The odds for CKD stage 3 versus 1were consistently higher for treated versus untreated HTN at every NHANES data collection point; OR (95% CI) = 2.2 (1.1-4.5) in 1999-2000, and increased to 6.2 (3.2-11.8) in 2013-2014 (see Figure 2B and Figure 3).
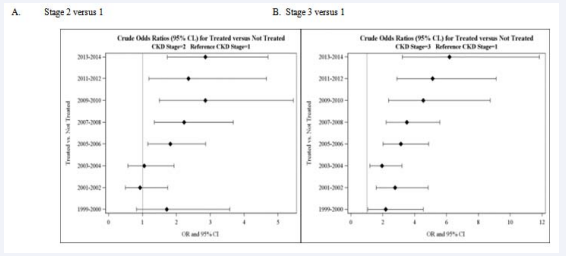
Figure 3: Cross-Sectional Analyses: Crude Odds Ratios (95% Confidence Interval) between CKD Stages and Treatment of Hypertension by NHANES cycle 1999-2000 through 2013-2014.
Trend analyses: The results from Model #1 (crude) revealed that odds ratios for CKD stage 3vs. 1 among treated versus untreated increased significantly (p= 0.020) over the 16-year time period for all adults with CKD and HTN. The same was observed for CKD stage 2 vs. 1, where the odds ratios for treated versus untreated also increased significantly over the 16-year time interval (p= 0.006) in adults with both CKD and HTN (see Table 2).
The results from Model #2 (adjusted ORs) also revealed significant increases in odds ratios for CKD stage 3 vs. 1 (p= 0.026) and for stage 2 vs. 1 (p=0.015) in treated compared to untreated for HTN (see Table 2).
Table 2: Trend Analyses and Estimated Odds Ratio (95% Confidence Interval) for Different Models.
| Model # | Pop | CKD | 1999- 2000 | 2001- 2002 | 2003- 2004 | 2005- 2006 | 2007- 2008 | 2009- 2010 | 2011- 2012 | 2013- 2014 | p# |
| Stage | OR | OR | OR | OR | OR | OR | OR | OR | |||
| (95% CI) | (95% CI) | (95% CI) | (95% CI) | (95% CI) | (95% CI) | (95% CI) | (95% C | ||||
| Model #1 | CKD & | 2 | 1.14 | 1.31 | 1.5 | 1.71 | 1.96 | 2.25 | 2.58 | 2.95 | 0.006 |
| Crude | HTN | vs 1 | (0.75-1.7) | (0.93- 1.83) | (1.15- 1.96) | (1.37- 2.14) | (1.59-2.43) | (1.76- 2.88) | (1.90- 3.50) | (2.01- 4.33) | |
| 3 | 2.03 | 2.36 | 2.75 | 3.2 | 3.72 | 4.32 | 5.03 | 5.85 | 0.002 | ||
| vs 1 | (1.39-2.9) | (1.75- 3.19) | (2.16- 3.49) | (2.61- 3.91) | (3.02- 4.58) | (3.36- 5.57) | (3.64- 6.93) | (3.91- 8.73) | |||
| Model #2 | CKD & | 2 | 0.84 | 0.96 | 1.09 | 1.24 | 1.42 | 1.61 | 1.84 | 2.1 | 0.0151 |
| Covar* | HTN | vs 1 | (0.54- 1.30) | (0.67- 1.37) | (0.82- 1.46) | (0.97- 1.60) | (1.10- 1.83) | (1.20- 2.17) | (1.28- 2.65) | (1.34- 3.28) | |
| 3 | 1.34 | 1.54 | 1.75 | 2.01 | 2.29 | 2.62 | 2.99 | 3.42 | 0.0263 | ||
| vs 1 | (0.87- 2.09) | (1.08- 2.19) | (1.32- 2.34) | (1.55- 2.60) | (1.72- 3.05) | (1.85- 3.71) | (1.93- 4.63) | (2.00- 5.84) | |||
| *adjusted for age, gender, race/ethnicity, BMI status, and smoking status #PROC SURVEYLOGISIC was used for trend analyses and significant p-values are presented in bold. |
|||||||||||
DISCUSSION AND CONCLUSION
The findings from this study support the alternative hypothesis that relationship between treatment of HTN and stages of CKD from 1999 through 2014 in NHANES have changed. The odds of the next (advanced) stage of CKD versus the first CKD stage (e.g., 3 vs. 1, or 2 vs 1) were consistently higher for treated for hypertension compared to untreated over the 16- year interval under study. An examination of the mathematics of odds and odds ratios revealed that change in odds ratios resulted from an increase in the prevalence of stage 3 and stage 2 in CKD patients who were treated for hypertension. On the other hand, the prevalence of these advanced stages decreased or stayed stable in untreated patients.
Clinical guidelines produced recommendations for antihypertensive therapy based on data from randomized control trials (RCTs). However, surrogate endpoints like changes in level of GFR or percentage of patients with two-fold increase in level of serum creatinine were used in RCTs that investigated the effects of pharmacological blood pressure management in CKD patients [6]. There is no study to the authors’ knowledge that used a national probability sample to determine the change in the association between treatment of hypertension and prevalence of CKD stages.
Based on physiological causal pathways [1-7], it is reasonable to conclude that hypertension is a risk factor for CKD. It is also reasonable that damage to kidneys can in turn increase blood pressure. However, for CKD patients who are under treatment for hypertension, it is reasonable to assume that prevalence of advanced stages of CKD would remain relatively stable over time. Nevertheless, the current study found a three-fold increase in the odds of advanced stages of CKD in treated compared to untreated CKD patients. Furthermore, over the 16-year time interval under study, there was a clear increase in prevalence of advanced CKD stages among treated for HTN. It is possible that the recommendation for more intensive BP-lowering treatment (<130/80 mm Hg instead of <140/90 mm Hg) in JNC-7 may have produced unintended consequences by aggravating kidney damage and thereby advancing CKD stages [23].
We are speculating that intensive (aggressive) treatment to lower BP threshold as recommended by JNC-7 for CKD patients may explain the change in odds ratios between lowering BP and CKD stages. The JNC-7 guidelines appeared in 2003 and we examined the time periods before and after their publication. Admittedly, in the current analysis the relationships between BP treatment and CKD stages are linked only by time, however, we are aware that time as a connecting factor can produce spurious correlations. In summary, our hypothesis that lower BP threshold may have produced change in the relationships between treatment of HTN and CKD stages needs to be confirmed with data prospectively collected from a cohort study where the same patients are followed over time.
LIMITATIONS
The major limitation in this study is that pooled cross-sectional design that precludes a temporal cause-effect analysis of the relationship between CKD and hypertensions. Another limitation is that blood pressure in the NHANES was measured on a single day versus on more than two separate days as recommended by JNC 7 guidance [7]. However, three measurements were taken by NHANES on the same day, which might have minimized misclassification errors. Similarly, presence of CKD was based on single laboratory measurements, compared to multiple measurements over three months as recommended by KDOQI guidance [6,21]. The strengths of the data is that HTN and CKD, and major risk factors for these conditions, were consistently measured over the 16-year study interval. These risk factors were controlled with multiple logistic regression, however unmeasured (e.g., family history of CKD and HTN) could still account for the change in relationships between CKD stages and HTN.
NHANES is a representative sample of the non-institutionalized US population; yet, older people or people with severe cases, such as stage 3 or 4 of CKD, might have been underreported because usually weaker populations were less likely to attend the NHANES clinical examinations. This might have introduced a selection bias; however, advanced stages 4 and 5 were excluded from statistical analyses because of unstable prevalence estimates. There is also data that lower BP goals had no beneficial effect on End Stage Renal Disease [24], which we were unable to determine in this study.
This is the first population based study using patient-level data to investigate the change in the relationship between treatment of HTN and CKD stages over time (1999 through 2014). The strength of the study is the relatively large sample size, good quality control of data collection procedures and measurements, and extensive survey questions that probed medical and psychosocial history. A major strength is the consistency of data definitions in NHANES that permitted analysis of trends in prevalence ratios of CKD stages before and after the publication of the JNC 7 guidance for the aggressive pharmacological treatment of HTN in CKD patients.
FUTURE RESEARCH
The cross-sectional nature of this study precludes any strong causal inference; future patient-level cohort analyses are needed to shed more light on the complex causal and cyclical relationship between treatment of hypertension and CKD progression.
KEY POINTS
Question
Have there been changes in the association between treatment of hypertension (HTN) and stages of chronic kidney disease (CKD) in American adults from 1999 through 2014?
Finding
In the U.S. National Health and Nutrition Examination Surveys (NHANES) data, there has been a statistically significant increase (p= 0.002) over time in the odds of CKD stage 3 versus stage 1 in Treated for HTN compared to the odds of stage 3 vs. stage 1 in Untreated from 1999 through 2014.
Meaning
Intensive pharmacological antihypertensive treatment in patients with CKD may have been responsible for increasing the prevalence of advanced stages in CKD patients who were treated for HTN. However, our pooled, cross-sectional analysis offers only suggestive evidence of a possible cause-effect relationship between HTN treatment and CKD stages. Carefully designed, cohort studies are needed to determine the temporal sequence in the causal pathway and confirm our hypothesis that antihypertensive medication can accelerate progression to advanced stages of CKD.
REFERENCES
4. Annals of Internal Medicine-In the Clinic® Chronic Kidney Disease American College of Physicians 2015.
15. USRDS Annual Data Report; Volume1-Chronic Kidney Disease; Volume2-End-Stage Renal Disease. 2014.


