Intracytoplasmic Sperm Injection Outcome based on Multiple Defects of Gametes- a Prospective Randomized Controlled Study
- 1. Senior embryologist and Lab manager at A4 Fertility Centre, India
Abstract
Background: In the realm of ART (Assisted Reproductive Technology), ICSI (IntraCytoplasmic Sperm Injection) has accomplished an essential achievement where its favorable outcome revolves around gametes quality. Several existing studies signified the correlation among SOQ (Sperm and oocyte quality) in ICSI outcome. However, precise classification of defects in gametes is lacking in the previous studies.
Objective: The main objective of the proposed study is to examine whether gamete quality influences the BR (blastocyst rate) and FR (fertilization rate)in ICSI results.
Methods: The presented study uses a Lenshooke AI device for identification of sperm defects and Hamilton laser software Image capturing System and Manual identification of oocyte abnormalities for quantification and categorization of sperm defects and oocyte abnormalities. It is analyzed with 53 ICSI cycles from January to December 2013, where the defects are categorized as high, moderate, and low.
Results: The outcome of the proposed study signified that the lower gamete scores (< 4.5) are linked with greater ICSI success by attaining 64.84% blastocyst rate and 80.12% fertilization rates compared to greater gamete scores.
Conclusions: This categorization of defects assists clinicians to understand how the quality of the gamete affects the embryo and fertilization development.
Keywords
• ICSI Outcomes; Gamete Quality Assessment; Fertilization Rate in ART; Blastocyst Development; Sperm Morphology Grading; Oocyte Quality Scoring; Teratozoospermia Index (TZI); Assisted Reproductive Technology Success
Citation
Rajesh Kumar A, Ashok A, Kumar R, Jayaraman (2025) Intracytoplasmic Sperm Injection Outcome based on Multiple Defects of Gametes- a Prospective Randomized Controlled Study. J Embryol Develop Biol. 4(1): 1007.
INTRODUCTION
In the field of reproductive medicine, ART [1,2], primarily focus on the correlation among ICSI results with embryo development and gamete quality. Significantly, several ART programs focus on embryo morphology [3], for selecting the embryo. Nevertheless, in the examination of quality enhancement in A4 fertility centre, it is perceived that the sperm and oocyte quality can substantially influence ICSI success, occasionally estimating results with better accuracy rather than embryo examination exclusively. This motivated us to suggest gamete quality evaluation before fertilization might contribute essential perspective into ICSI’s outcome. Correspondingly, embryo quality [4], is highly recognized as the main determinant of positive outcomes, several prevailing studies centred on optimizing embryo evaluation [5], preferably over gamete assessment [6]. This focus on embryo examination has resulted in expensive developments like time lapse enabled auto-incubator technologies. Considering the notable expenses [7], of ARTs, it is significant to prioritize cost effective embryo selecting innovation and optimized embryo selection. Therefore, suggested study anticipatorily examines a gamete scoring technique encompassing oocyte and sperm quality in identifying success rate of ICSI. The major contribution of the presented study is represented in the following:
- To present the essential impact of SOQ on fertilization and blastocyst development rates in ICSI techniques.
- To establish systemized grading for categorizing abnormalities in gamete to improve ART’s quality assessment.
- To emphasize the significance of modern tools like Scoring of Oocyte abnormalities and TZI of sperms in upgrading gamete assessment and diagnosis.
Study Objective
To analyze the effect of a morphologic gamete grading system on FR and BR results in ICSI success, compared with existing embryo examination techniques.
MATERIALS AND METHODS
Study Design
This study was conducted as a Prospective observational analysis of 53 ICSI cycles performed between January and December 2013. It followed a randomized controlled trial framework to minimize bias and ensure the reliability of the findings. The Figure 1 represents the flow diagram of the presented study.
Figure 1 Design Flow of the Suggested Study.
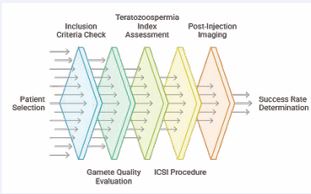
Initially, study starts with selection of patients, examining their suitability with certain exclusion and inclusion criteria which is stated in Table 1.
Table 1: Eligibility Criteria.
|
Inclusion Criteria |
Exclusion Criteria |
|
|
After attaining the required standards, patients undergo gamete and sperm quality assessment. Here standard techniques are used for analyzing oocyte and sperm where teratozoospermia index [8], is utilized to classify sperm abnormalities by using Lenshook AI device on the day of ICSI procedure with fresh ejaculated semen sample. During ICSI procedure the oocyte abnormalities were noted and images captured by using Hamilton LASER image capturing System [9]. Following this, the ICSI process [10], is then performed to enable fertilization [11]. The documentation on post-injection development takes place with imaging and microscopy, delivering significant data on fertilization and development of embryos. Finally, statistical analysis is processed to determine similarity and trends, eventually identifying how the gamete quality influences ICSI success rate with fertilization and blastocyst data. To achieve this, Oocyte scoring with the help of Hamilton laser software image capturing and lenshooke AI device [12], were utilized to enhance the gamete quality evaluation.
Participants and Eligibility Criteria
The research involves patients receiving ICSI procedures at a single fertility center. It comprises 53 patients receiving ICSI treatment from January to December 2024, regardless of age and race. The inclusion guidelines require patients to have at least four mature oocytes aged Overall sperm quantity) or gaps in medical history. The Table 1 illustrates the inclusion and exclusion criteria.
Ethical Compliance
- The proposed research was reviewed and approved by the institutional ethical board.
- All participants provided written informed consent prior to the treatment procedure.
Clinical Significance
The success rate of ICSI depends on enhanced fertilization and blastocyst growth rate, emphasizing the role of selecting sperm and oocytes with fewer abnormalities for optimal outcomes.
Intervention
A standardized ovarian stimulation is used as an essential part of intervention. Subsequently, LPS (Luteal Phase Stimulation) is carried out for oocyte retrieval. Followed by that, oocytes have been processed for morphological quality assessment and classification of sperm samples is carried out with AI-based defect evaluation. Gametes are categorized in terms of standard criteria as low, moderate and high quality. Significantly, ICSI [15], fertilization [16], takes place and embryos are grown into a blastocyst stage and cultured in an identical condition to assure invariability.
Outcome Measures
The efficacy of fertilization and blastocyst growth rate were the primary outcomes. The secondary measures of the presented study comprises live birth rates. These results are evaluated with gamete quality scores Group 1- 5.5.
Measurements
Key results
- Fertilization Rate: The fraction of fertilized oocytes developing to the blastocyst stage.
- Blastocyst Rate: The conversion rate of successfully fertilized oocytes into blastocyst stage.
Gamete Quality Assessment The evaluation of sperm is processed with TZI (Teratozoospermia Index), computed using the Lenshooke AI device. Every oocyte is categorized in terms of intensity of morphological abnormalities where the defects are represented in the Figure 2.
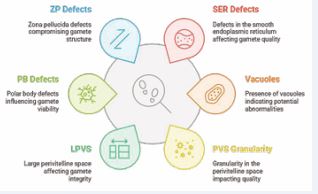
Figure 2 Morphological Abnormalities
Correspondingly, oocyte morphological abnormalities are categorized as low, moderate and high as per the following:
- Low Abnormalities (Score-1): Overall granularity and assessment of RF (Refractive Bodies)
- Moderate Abnormalities (Score-1.5): ZP Zona pellucida, PB ( Polar Body) defects and LPVS (Large Perivitelline Space)
- High Abnormalities (Score-2): PVS granularity, vacuoles, SER defects.
The combine value of the Oocyte score and TZI value is calculated as Gamete score.
Statistical Analysis
The acquired data were evaluated with IBM SPSS software (version 25.0). The suggested study presented continuous variables which are analyzed with standard deviation and means, where categorical data is represented as percentages. Besides, ANOVA is utilized for analyzing relationship among ICSI outcomes and gamete quality scores for recurrent variables and logistic regression for classified results. Moreover, p-value <0.05 is determined as statically significant. To examine the influence of sperm and oocyte score individually, subgroup evaluation is performed in the study.
RESULTS AND DISCUSSIONS
The section represents the outcomes accomplished by the presented study. The Table 2,3 and 4 represents the ICSI outcomes graded by gamete score, oocyte score and sperm score.
Table 2: ICSI Outcomes by Stratified by Gamete Score.
|
GAMETE SCORE |
NO OF PAT |
FERT RATE |
BLAST RATE |
DAY 5 RATE |
DAY 6 RATE |
GR A+B RATE |
|
OVERALL |
53 |
536/697 |
279/536 |
175/279 |
104/279 |
154/279 |
|
<= 4.5 |
13 |
125/156 |
83/125 |
54/83 |
29/83 |
39/83 |
|
>4.5 TO 5 |
11 |
107/139 |
61/107 |
32/61 |
29/61 |
42/61 |
|
>5 TO 5.5 |
14 |
191/250 |
85/191 |
58/85 |
27/85 |
50/85 |
|
>=5 |
15 |
113/152 |
50/113 |
31/50 |
19/50 |
23/50 |
|
|
|
|
|
|
|
|
|
OVERALL |
53 |
76.90% |
52.05% |
62.70% |
37.20% |
55.19% |
|
<= 4.5 |
13 |
80.12% |
64.84% |
65.06% |
34.93% |
46.98% |
|
>4.5 TO 5 |
11 |
76.97% |
57.00% |
52.45% |
47.54% |
68.85% |
|
>5 TO 5.5 |
14 |
76.40% |
44.50% |
68.23% |
31.76% |
58.82% |
|
>=5 |
15 |
74.34% |
44.24% |
62.00% |
38.00% |
46.00% |
Table 3: ICSI Outcomes by Stratified by Oocyte Score
|
OOCYTE SCORE |
NO OF PAT |
FERT RATE |
BLAST RATE |
DAY 5 RATE |
DAY 6 RATE |
GR A+B RATE |
|
OVERALL |
53 |
536/697 |
279/536 |
175/279 |
104/279 |
154/279 |
|
< 3 |
17 |
150/188 |
96/150 |
62/96 |
36/96 |
47/96 |
|
>=3 TO 3.5 |
16 |
208/277 |
102/208 |
64/102 |
38/102 |
64/102 |
|
>=3.5 TO 4 |
9 |
101/134 |
44/101 |
26/44 |
18/44 |
28/44 |
|
>4 |
10 |
68/88 |
32/68 |
22/32 |
10/32 |
15/32 |
|
|
|
|
|
|
|
|
|
OVERALL |
53 |
76.90% |
52.05% |
62.70% |
37.20% |
55.19% |
|
< 3 |
17 |
79.79% |
64.00% |
64.58% |
37.50% |
48.96% |
|
>=3 TO 3.5 |
16 |
75.10% |
49.04% |
62.75% |
37.26% |
62.75% |
|
>=3.5 TO 4 |
9 |
75.37% |
43.56% |
59.09% |
40.91% |
63.64% |
|
>4 |
10 |
77.27% |
47.06% |
68.75% |
31.25% |
46.88% |
Table 4: ICSI Outcomes by Stratified by Sperm Score.
|
SPERM SCORE |
NO OF PAT |
FERT RATE |
BLAST RATE |
DAY 5 RATE |
DAY 6 RATE |
GR A+B RATE |
|
OVERALL |
53 |
536/697 |
279/536 |
175/279 |
104/279 |
154/279 |
|
<= 1.6 |
9 |
101/126 |
58/101 |
42/58 |
16/58 |
33/58 |
|
>1.6 TO 1.7 |
13 |
127/158 |
69/127 |
35/69 |
34/69 |
35/69 |
|
>1.7 TO 1.8 |
13 |
127/156 |
74/127 |
45/74 |
29/74 |
40/74 |
|
>1.8 |
18 |
174/242 |
74/174 |
49/74 |
25/74 |
43/74 |
|
|
|
|
|
|
|
|
|
OVERALL |
53 |
76.90% |
52.05% |
62.70% |
37.20% |
55.19% |
|
<= 4.5 |
13 |
80.16% |
57.43% |
72.41% |
27.58% |
56.90% |
|
>4.5 TO 5 |
11 |
80.38% |
54.33% |
50.73% |
49.28% |
50.72% |
|
>5 TO 5.5 |
14 |
81.41 |
58.28% |
60.81% |
39.20% |
54.05% |
|
>=5 |
15 |
71.9 |
42.53% |
66.22% |
33.80% |
58.11% |
The Tables 2, 3 and 4 examine the influence of sperm and oocyte quality in embryo quality, blastocyst formation and fertilization. In the outcome, the rate of fertilization remains greater (76-80%), while embryo growth differs. In the Table 1, gamete score among the values 4.5 and 5.5 yield fine results, but the maximal values ((≤4.5 or ≥5) minimise quality of embryo. Table 2 signifies the oocyte score among the values 3 and 3.5 shows optimum results, with greater score (>4) minimising embryo quality. Table 3 illustrates the optimization in embryo growth in the sperm score from range 1.7 to 1.8 where score ≤1.6 reduces efficient results. The overall outcome signifies that the balanced gamete, sperm and oocyte score is essential and optimal middle range shows enhanced embryo quality, greater blastocyst formation and better fertilization, showcasing the requirement of enhanced evaluation in assisted reproduction. The Table 5 represents the descriptive analysis based on gamete score categories.
Table 5: Descriptive Analysis Based on Gamete Score Categories (≤ 4.5 to > 5.5).
|
|
N |
Mean |
SD |
|
|
Wife Age |
<= 4.5 |
13 |
32.2 |
3.4 |
|
4.5 - 5 |
11 |
30.1 |
5.5 |
|
|
5 - 5.5 |
14 |
29.1 |
4 |
|
|
> 5.5 |
15 |
31.1 |
4.2 |
|
|
Husband Age |
<= 4.5 |
13 |
38.1 |
4 |
|
4.5 - 5 |
11 |
34.5 |
5.6 |
|
|
5 - 5.5 |
14 |
33.5 |
4.8 |
|
|
> 5.5 |
15 |
36.6 |
5.6 |
|
|
Fert Rate |
<= 4.5 |
13 |
81.6 |
13.9 |
|
4.5 - 5 |
11 |
77.6 |
11 |
|
|
5 - 5.5 |
14 |
74 |
16.3 |
|
|
> 5.5 |
15 |
64.2 |
26.8 |
|
|
Cleavage Rate |
<= 4.5 |
13 |
98.8 |
2.9 |
|
4.5 - 5 |
11 |
94.8 |
7 |
|
|
5 - 5.5 |
14 |
99.7 |
19 |
|
|
> 5.5 |
15 |
79.4 |
35.9 |
|
|
D5 Rate D6 Rate Blast Rate Gr A+B Rate |
<= 4.5 |
13 |
63 |
28.7 |
|
4.5 - 5 |
11 |
52.5 |
38.7 |
|
|
5 - 5.5 |
14 |
75.9 |
23.8 |
|
|
> 5.5 |
15 |
48.6 |
42 |
|
|
<= 4.5 |
13 |
38.9 |
29.6 |
|
|
4.5 - 5 |
11 |
47.5 |
38.7 |
|
|
5 - 5.5 |
14 |
24.1 |
23.8 |
|
|
> 5.5 |
15 |
24.7 |
32.9 |
|
|
<= 4.5 |
13 |
68.4 |
15.8 |
|
|
4.5 - 5 |
11 |
55.5 |
28.6 |
|
|
5 - 5.5 |
14 |
47.1 |
17.9 |
|
|
> 5.5 |
15 |
33.3 |
26.8 |
|
|
<= 4.5 |
13 |
52 |
23.9 |
|
|
4.5 - 5 |
11 |
57 |
35 |
|
|
5 - 5.5 |
14 |
61.3 |
20.5 |
|
|
> 5.5 |
15 |
36.6 |
38.7 |
|
The Table 5 examines fertility statistics over four distinct groups (≤ 4.5 to > 5.5). Here, ages of husband and wife slightly vary and blastocyst rates, cleavage and fertilization drops as the increased range. Besides, variability rises in greater ranges, illustrating factors like BMI or score affects results, with small sample [11-15] sizes. The Table 6 represents the ANOVA statistics for fertility results with four ranges.
Table 6: ANOVA Analysis through Four Ranges.
|
ANOVA |
||||||
|
|
Sum of Squares |
df |
Mean Square |
F |
p-value |
|
|
Wife Age |
Between Groups |
70.216 |
3 |
23.405 |
1.291 |
0.288 |
|
Husband Age |
Between Groups |
170.419 |
3 |
56.806 |
2.24 |
0.095 |
|
Fert Rate |
Between Groups |
2331.937 |
3 |
777.312 |
2.234 |
0.096 |
|
Cleavage Rate |
Between Groups |
3900.656 |
3 |
1300.219 |
2.729 |
0.054 |
|
D5 Rate |
Between Groups |
6223.926 |
3 |
2074.642 |
1.784 |
0.163 |
|
D6 Rate |
Between Groups |
4915.425 |
3 |
1638.475 |
1.671 |
0.185 |
|
Blast Rate |
Between |
9025.687 |
3 |
3008.562 |
5.815 |
0.002 |
|
|
Groups |
|
|
|
|
|
|
Gr A+B Rate |
Between Groups |
5000.676 |
3 |
1666.892 |
1.79 |
0.161 |
The ANOVA analyzes dissimilarity over four ranges where blast rates represent essential difference (p=0.002) and cleavage rate is close to optimal trends. The grouping factor significantly influences blastocyst rates than other results. The Table 7 shows the Tukey HSD Post-Hoc Blast Rate Analysis over Ranges.
Table 7: Post-Hoc Comparisons of Blast Rate by Group Ranges.
|
Dependent Variable |
MD (I-J) |
Std. Error |
p-value |
95% C.I |
|||
|
LB |
UB |
||||||
|
Blast Rate |
<= 4.5 |
4.5 - 5 |
12.9233 |
9.3184 |
0.513 |
-11.858 |
37.705 |
|
5 - 5.5 |
21.3363 |
8.7609 |
0.084 |
-1.963 |
44.635 |
||
|
> 5.5 |
35.0833* |
8.6191 |
0.001 |
12.161 |
58.005 |
||
|
4.5 – 5 |
5 - 5.5 |
8.413 |
9.1646 |
0.795 |
-15.96 |
32.786 |
|
|
> 5.5 |
22.16 |
9.0291 |
0.08 |
-1.852 |
46.172 |
||
|
5 - 5.5 |
> 5.5 |
13.747 |
8.4526 |
0.374 |
-8.732 |
36.226 |
|
The Table 8 illustrates fertility results between four ranges (< 3 to > 4). Here, age of husband and wife varies, blast rate, cleavage and fertilization rejects as the range elivates (Blast: 65.2 to 29.7). Besides, variability rises in greater range (Cleavage SD: 40.2 at > 4), highlighting the influence of factors on results.
Table 8: Descriptive Analysis of Fertility Results by Grouping Ranges (< 3 to > 4).
|
|
N |
Mean |
SD |
|
|
Wife Age |
< 3 |
17 |
31.2 |
3.5 |
|
3 - 3.5 |
15 |
30.8 |
5.2 |
|
|
3.5 - 4 |
10 |
28.7 |
3.6 |
|
|
> 4 |
11 |
31.1 |
4.7 |
|
|
Husband Age |
< 3 |
17 |
37.2 |
5.1 |
|
3 - 3.5 |
15 |
34.9 |
4.5 |
|
|
3.5 - 4 |
10 |
33.7 |
5.4 |
|
|
> 4 |
11 |
36.3 |
6 |
|
|
Fert Rate Cleavage Rate D5 Rate D6 Rate Blast Rate Gr A+B Rate |
< 3 |
17 |
80.7 |
13.8 |
|
3 - 3.5 |
15 |
73.6 |
11.7 |
|
|
3.5 - 4 |
10 |
72.1 |
20.8 |
|
|
> 4 |
11 |
65.3 |
29.8 |
|
|
< 3 |
17 |
99.1 |
2.6 |
|
|
3 - 3.5 |
15 |
94.5 |
18.2 |
|
|
3.5 - 4 |
10 |
101.3 |
6.7 |
|
|
> 4 |
11 |
72.7 |
40.2 |
|
|
< 3 |
17 |
63 |
31.4 |
|
|
3 - 3.5 |
15 |
63.9 |
32.7 |
|
|
3.5 - 4 |
10 |
67.9 |
36.1 |
|
|
> 4 |
11 |
43.6 |
41 |
|
|
< 3 |
17 |
38.5 |
32 |
|
|
3 - 3.5 |
15 |
36.1 |
32.7 |
|
|
3.5 - 4 |
10 |
32.1 |
36.1 |
|
|
> 4 |
11 |
20.1 |
27.2 |
|
|
< 3 |
17 |
65.2 |
20.3 |
|
|
3 - 3.5 |
15 |
48.6 |
25.6 |
|
|
3.5 - 4 |
10 |
49.5 |
15.3 |
|
|
> 4 |
11 |
29.7 |
28.4 |
|
|
< 3 |
17 |
52.6 |
27.7 |
|
|
3 - 3.5 |
15 |
55.8 |
26.8 |
|
|
3.5 - 4 |
10 |
61.3 |
29.9 |
|
|
> 4 |
11 |
33.3 |
39.2 |
|
In this Table 9, group variations are among ranges (< 3 to > 4). Here, cleavage rate (p = 0.007, F= 4.502) and blast rate (p = 0.003, F = 5.39) represent important variation, implying the factor influencing the results. Fert rate (p = 0.229), husband age (p = 0.333) and wife age (p = 0.485) and other factors (p > 0.05) illustrate no essential variations.
Table 9: ANOVA of Fertility Variables by Group Ranges (< 3 to > 4).
|
ANOVA |
||||||
|
|
Sum of Squares |
df |
Mean Square |
F |
p-value |
|
|
Wife Age |
Between Groups |
46.211 |
3 |
15.404 |
0.827 |
0.485 |
|
Husband Age |
Between Groups |
94.096 |
3 |
31.365 |
1.165 |
0.333 |
|
Fert Rate |
Between Groups |
1620.949 |
3 |
540.316 |
1.491 |
0.229 |
|
Cleavage Rate |
Between Groups |
5887.89 |
3 |
1962.63 |
4.502 |
0.007 |
|
D5 Rate |
Between Groups |
3978.206 |
3 |
1326.069 |
1.097 |
0.359 |
|
D6 Rate |
Between Groups |
2496.851 |
3 |
832.284 |
0.808 |
0.495 |
|
Blast Rate |
Between Groups |
8529.086 |
3 |
2843.029 |
5.39 |
0.003 |
|
Gr A+B Rate |
Between Groups |
4901.164 |
3 |
1633.721 |
1.751 |
0.169 |
The Table 10 signifies tukey HSD statistics of blast and cleavage rate by ranges (< 3 to > 4). This outcome denote cleavage rate varies among 3.5–4 vs. > 4 (MD = 28.58, p = 0.015) and < 3 and > 4 (MD = 26.42, p = 0.01). The blast rate varies among < 3 and > 4 (MD = 35.58, p = 0.001).
Table 10: Tukey HSD Analysis of Cleavage and Blast Rates by Ranges (< 3 to > 4).
|
Dependent Variable |
MD (I-J) |
Std. Error |
p-value |
95% C.I |
|||
|
LB |
UB |
||||||
|
Cleavage Rate |
< 3 |
3 - 3.5 |
4.5834 |
7.3967 |
0.925 |
-15.088 |
24.254 |
|
|
|
3.5 - 4 |
-2.1626 |
8.3212 |
0.994 |
-24.292 |
19.967 |
|
|
|
> 4 |
26.4203* |
8.0796 |
0.01 |
4.933 |
47.907 |
|
|
3 - 3.5 |
3.5 - 4 |
-6.746 |
8.5242 |
0.858 |
-29.416 |
15.924 |
|
|
|
> 4 |
21.8369 |
8.2885 |
0.053 |
-0.206 |
43.88 |
|
|
3.5 - 4 |
> 4 |
28.5829* |
9.1231 |
0.015 |
4.32 |
52.845 |
|
Blast Rate |
< 3 |
3 - 3.5 |
16.6855 |
8.1362 |
0.184 |
-4.952 |
38.323 |
|
|
|
3.5 - 4 |
15.7036 |
9.1532 |
0.327 |
-8.639 |
40.046 |
|
|
|
> 4 |
35.5753* |
8.8874 |
0.001 |
11.94 |
59.211 |
|
|
3 - 3.5 |
3.5 - 4 |
-0.9819 |
9.3765 |
1 |
-25.918 |
23.954 |
|
|
|
> 4 |
18.8898 |
9.1171 |
0.177 |
-5.357 |
43.136 |
|
|
3.5 - 4 |
> 4 |
19.8717 |
10.0352 |
0.209 |
-6.816 |
46.56 |
|
*. The mean difference is significant at the 0.05 level. |
|||||||
The Table 11 shows the descriptive analysis of fertility results between the range (1.8). The Table 11 signifies descriptive analysis (standard deviation and mean) of diverse variables (embryo development rates, cleavage, fertility and age) among four ranges (1.8). Essential trends comprise depreciate fertility, blastocyst rate with greater range, whereas mid range cleavage elevates with higher variability peaks in higher ones.
Table 11: Descriptive Statistics of Fertility Outcomes Across Four Ranges (1.8).
|
|
N |
Mean |
SD |
|
|
Wife Age |
< 1.6 |
9 |
30.6 |
3.9 |
|
1.6 - 1.7 |
13 |
31.6 |
4.8 |
|
|
1.7 - 1.8 |
14 |
30.6 |
4 |
|
|
> 1.8 |
17 |
29.8 |
4.6 |
|
|
Husband Age |
< 1.6 |
9 |
34.7 |
3.8 |
|
1.6 - 1.7 |
13 |
37.2 |
4.7 |
|
|
1.7 - 1.8 |
14 |
35.3 |
4.2 |
|
|
> 1.8 |
17 |
35.4 |
6.9 |
|
|
Fert Rate |
< 1.6 |
9 |
78.1 |
10.3 |
|
1.6 - 1.7 |
13 |
78.6 |
16.4 |
|
|
1.7 - 1.8 |
14 |
74.5 |
19.4 |
|
|
> 1.8 |
17 |
67.5 |
24.1 |
|
|
Cleavage Rate |
< 1.6 |
9 |
95.2 |
14.3 |
|
1.6 - 1.7 |
13 |
97.3 |
7.2 |
|
|
1.7 - 1.8 |
14 |
97.2 |
15.5 |
|
|
> 1.8 |
17 |
84.3 |
35.4 |
|
|
D5 Rate
D6 Rate
Blast Rate
Gr A+B Rate |
< 1.6 |
9 |
76.8 |
19.1 |
|
1.6 - 1.7 |
13 |
57.8 |
32.8 |
|
|
1.7 - 1.8 |
14 |
62 |
34.3 |
|
|
> 1.8 |
17 |
51.6 |
42 |
|
|
< 1.6 |
9 |
26 |
22.8 |
|
|
1.6 - 1.7 |
13 |
42.2 |
32.8 |
|
|
1.7 - 1.8 |
14 |
30.8 |
30.6 |
|
|
> 1.8 |
17 |
30.8 |
37.1 |
|
|
< 1.6 |
9 |
56.7 |
27.4 |
|
|
1.6 - 1.7 |
13 |
56.2 |
23.8 |
|
|
1.7 - 1.8 |
14 |
53.2 |
22.1 |
|
|
> 1.8 |
17 |
39.6 |
27.8 |
|
|
< 1.6 |
9 |
55.6 |
32.4 |
|
|
1.6 - 1.7 |
13 |
61.7 |
26.1 |
|
|
1.7 - 1.8 |
14 |
47 |
31.8 |
|
|
> 1.8 |
17 |
44.1 |
33.8 |
|
The Table 12 represents ANOVA outcome across range (1.8). This outcome indicates null essential variations among every variable in the group. The low F-value shows that group means are the same and acquired variations are the result of random occurrence rather than variations in the group.
Table 12: ANOVA Results for Fertility Outcomes Across Four Ranges (1.8).
|
|
Sum of Squares |
df |
Mean Square |
F |
p-value |
|
|
Wife Age |
Between Groups |
23.695 |
3 |
7.898 |
0.414 |
0.744 |
|
Husband Age |
Between Groups |
43.887 |
3 |
14.629 |
0.524 |
0.668 |
|
Fert Rate |
Between Groups |
1144.982 |
3 |
381.661 |
1.026 |
0.389 |
|
Cleavage Rate |
Between Groups |
1816.844 |
3 |
605.615 |
1.167 |
0.332 |
|
D5 Rate |
Between Groups |
3853.265 |
3 |
1284.422 |
1.06 |
0.375 |
|
D6 Rate |
Between Groups |
1681.159 |
3 |
560.386 |
0.536 |
0.66 |
|
Blast Rate |
Between Groups |
2879.595 |
3 |
959.865 |
1.493 |
0.228 |
|
Gr A+B Rate |
Between Groups |
2702.648 |
3 |
900.883 |
0.921 |
0.438 |
DISCUSSIONS
The presented randomized controlled study examines the influence of sperm and oocyte quality on ICSI results, primarily centred on BR, FR and quality of embryo. To achieve this, the study examined 53 ICSI cycles classified into four groups such as ≤4.5, 4.5–5, 5–5.5, and >5.5. It is functioned with Hamilton AI software, Lenshooke AI, classification of gametes in terms of TZI and oocyte scoring technique. The findings of the study signifies that lower gamete score is associated with greater BR (64.84%) and FR (80.12%), whereas greater score (>5.5) shows minimized success rate (BR: 44.24%, FR: 74.34%). Good blastocyst rates and Day 5 stays constant among groups, recommending that the numerous gamete defects essentially influence blastulation and fertilization. The study emphasizes the significance of exact gamete quality evaluation with coordinated sperm and oocyte scoring technique, which is the important approach is ART. Nevertheless, limitations of limited sample size and utilization of group culture procedure, may impact the individual abnormality results.The strength of the study is the utilization of technology to categorize defects as low, moderate and high, providing clear understanding of quality of gamete. The outcome of the study coordinates with prior studies which suggests lower scores in gamete can attain better results.These findings of the study pose essential implications for health care providers and policy making authorities. The physicians can utilize this data to enhance gamete selection methods and can deliver better guidelines for ICSI patients. For policymakers, utilizing AI technology and laser aided tools into standardized ART standards could enhance the reliability and consistency in clinic results. Future studies can be analyzed by combining metabolic assessment and genetic factors with morphological assessment to deliver a better understanding of gamete quality. Moreover, tracking relationships among gamete score and live birth rate will enhance the efficacy of the findings.
CONCLUSION
The presented study highlights the essential influence of gamete quality on ICSI success rate, mainly focusing on blastocyst rate and fertilization. It is examined with 53 ICSI cycles by utilizing Hamilton laser software and Lenshooke AI device. The outcome shows the lower gamete score (<4.5) signifies limited abnormalities, correlated with greater blastocyst (64.84%) and fertilization rate (80.12%). Besides, it delivers the standard framework to examine gamete quality by objectively classifying sperm and oocyte defects. The findings recommend that deliberate gamete section is important in optimizing success rate in ART. Future studies can centre on analyzing long term effects of abnormalities in gamete on implantation and live birth rate can enhance the assessment efficiency. Implementing the evaluation can improve ART efficacy and enhance pregnancy results for ICSI patients.
Strength and Limitations of the Presented Study
- The suggested study applies a well-defined morphologic grading system for gamete, assuring constant examination over all samples.
- The handling of larger datasets with various patients boosts applicability of the study findings.
- The presented study delivers significant insights into the influence of egg and sperm quality in ICSI outcomes.
- The design of the study centred on morphological factors, however other criteria like metabolism or genetics can be analyzed to improve the scope of the study.
REFERENCES
- Wu YC, Chia-Yu Su E, Hou JH, Lin CJ, Lin KB, Chen CH. Artificial intelligence and assisted reproductive technology: A comprehensive systematic review. Taiwan J Obstet Gynecol. 2025; 64: 11-26.
- Taylor L, Hood A, Mancuso F, Horan S, Walker Z. Effects of assisted reproductive technology on genetics, obstetrics, and neonatal outcomes. Neoreviews. 2025; 26: e89-e99.
- Shirasawa H, Terada Y. Embryologist staffing in assisted reproductive technology laboratories: An international comparative review. Reprod Med Biol. 2025; 24: e12628.
- Fuentes F, Aguila L, Pérez F, Muñoz E, Arias ME, Felmer R. Comparative analysis of Piezo-ICSI and conventional ICSI in bovine embryo development. Theriogenology. 2025; 232: 46-55.
- Gilboa D, Garg A, Shapiro M, Meseguer M, Amar Y, Lustgarten N, et al. Application of a methodological framework for the development and multicenter validation of reliable artificial intelligence in embryo evaluation. Reprod Biol Endocrinol. 2025; 23: 16.
- Fawzy M, Elsuity MA, Magdi Y, Rashwan MM, Gad MA, Adel N, et al. Evaluating the effectiveness of assisted oocyte activation in icsi: pairwise meta-analyses and systematic evidence evaluation. BJOG. 2025; 132: 724-741.
- Njagi P, Groot W, Arsenijevic J, Mburu G, Chambers G, Calhaz-Jorge C, et al. Financial cost of assisted reproductive technology for patients in high-income countries: A systematic review protocol. PLoS One. 2025; 20: e0318780.
- Budiharto JM, Margiana R, William W, Supardi S, Narulita P. Relationship between spermatogenesis, DNA fragmentation index, and teratozoospermia index. Int J Health Sci. 2022; 6: 1827-1837.
- Candela L, Boeri L, Capogrosso P, Cazzaniga W, Pozzi E, Belladelli F, et al. Correlation among isolated teratozoospermia, sperm DNA fragmentation and markers of systemic inflammation in primary infertile men. PLoS One. 2021; 16: e0251608.
- Claffey A, Ngo A, McIntire D, Doody K, Doody K. Unveiling clinic variation in utilization of ICSI, PGT, and blastocyst transfer: A comprehensive study using the SART database (2014-2020). J Assist Reprod Genet. 2025; 42: 799-807.
- Zhu L, Lin T, Yang X, Zhang D. Nomogram to predict cumulative live birth rate following in vitro fertilization/intracytoplasmic sperm injection cycles in patients with endometriosis. BMC Pregnancy Childbirth. 2025; 25: 38.
- Agarwal A, Panner Selvam MK, Ambar RF. Validation of lenshooke® x1 pro and computer-assisted semen analyzer compared with laboratory-based manual semen analysis. World J Mens Health. 2021; 39: 496-505.
- Kang J, Qiao J. Impact of congenital uterine anomalies on reproductive outcomes of IVF/ICSI-embryo transfer: A retrospective study. Eur J Med Res. 2024; 29: 48.
- Huang B, Wang Z, Kong Y, Jin M, Ma L. Global, regional and national burden of male infertility in 204 countries and territories between 1990 and 2019: An analysis of global burden of disease study. BMC Public Health. 2023; 23: 2195.
- Zander-Fox D, Lam K, Pacella-Ince L, Tully C, Hamilton H, Hiraoka K, McPherson NO, et al. PIEZO-ICSI increases fertilization rates compared with standard ICSI: A prospective cohort study. Reprod Biomed Online. 2021; 43: 404-412.
- Baffa J, Karavani G, Akroof B, Kattan MS, Lau S, Jarvi K. Sperm retrieval, fertilization rates, and clinical outcomes of infertile men with Y chromosome microdeletion a retrospective cohort study. Can Urol Assoc J. 2025; 19: 116-122.


