Adipokines, Leptin or Adiponectin Ratio and C-Reactive Protein Levels in a Population with High Prevalence of Diabetes the Brazilian Xavante Indians
- 1. Department of Social Medicine, University of São Paulo, Brazil
- 2. Institute of Biological and Health Science, Federal University of Mato Grosso, Brazil
- 3. Division of Endocrinology, Federal University of São Paulo, Brazil
Abstract
The aim of this study was to evaluate serum levels of C-reactive protein (CRP), adiponectin and leptin and their relationship with categories of glucose tolerance and body mass index (BMI) in a population with high prevalence of diabetes, the Brazilian Xavante Indians. A cross-sectional study was conducted among 938 Xavante Indians aged 20 years or more, from the Sangradouro and São Marcos reservations, Mato Grosso state, Brazil. Individuals were classified into three groups according to their BMI: eutrophic (BMI < 25 kg/m2 , n=138); overweight (BMI 25-29.9 kg/m2 , n=323) and obese (BMI ≥ 30 kg/m2 , n=477). Using the 75g oral glucose tolerance test, individuals were classified, according to the WHO 1999 criteria, as normal glucose tolerance (NGT), impaired glucose tolerance (IGT) or diabetes (DM). Prevalence rates of DM were 25.4% in the eutrophic group, 26.6% in the overweight group and 25.4% in the obese group. Geometric means with their 95% confidence intervals for C-reactive protein, adiponectin and leptin serum levels were calculated among groups according to gender, glucose tolerance and BMI. Two-way ANOVA with logarithmic transformation of data was used to test geometric mean differences among groups. Levels of CRP in the NGT group were lower in overweight women. Among the women, those with obesity and IGT or DM had higher CRP levels than those in the eutrophic or overweight groups. For all glucose tolerance categories and for both genders, adiponectin levels were lower in obese individuals, with the differences being significant for men in the NGT and IGT groups and for women in the IGT group. Leptin levels were higher in overweight and obese individuals of both genders and of all glucose tolerance categories, with the differences being significant for all, except the women in the diabetic group. Leptin/adiponectin ratios were higher in overweight and obese individuals of both genders, independent of the glucose tolerance category. These data support the fact that metabolic changes promoted by being overweight/obese and glucose tolerance abnormalities induce alterations in inflammatory mediators and hormones. The higher leptin/adiponectin ratios detected in overweight and obese Xavante Indians of both genders in the NGT group deserve further attention, in this population with high risk for diabetes, since these adipokines are significant factors in b-cell failure and the low-grade inflammation process, characteristic of obesity.
Keywords
- Diabetes
- Obesity
- Brazilian Indians
- C-Reactive Protein
- Adiponectin
- Leptin
- Leptin/Adiponectin ratio
Citation
Honorio-França AC, Dal Fabbro AL, Martinez EZ, Franco LF, Vieira-Filho JPB, et al. (2015) Adipokines, Leptin/Adiponectin Ratio and C-Reactive Protein Levels in a Population with High Prevalence of Diabetes – the Brazilian Xavante Indians. J Endocrinol Diabetes Obes 3(1): 1066.
INTRODUCTION
Being obese and overweight are common metabolic disorders and their growing frequencies worldwide are a major Public Health concern [1]. Obesity induces insulin resistance with consequent hyperinsulinemia, which is the underlying mechanism in the development of metabolic syndrome and type 2 diabetes mellitus [2,3].
Populations from some ethnic groups, particularly the indigenous populations of the Americas, present higher risk for diabetes mellitus [4]. High prevalence of diabetes and obesity were reported in the Brazilian Xavante Indians, an indigenous population that has remained genetically isolated [5,6]. They comprise approximately 20,000 individuals, one of the largest indigenous groups in Brazil [7]. The high prevalence of obesity and diabetes in the Xavante group was attributed to recent changes in their lifestyle, particularly regarding eating habits and physical activity [5]. Among obese individuals, there is an increase in the expression and secretion of proinflammatory cytokines and elevation of plasma levels of C-reactive protein (CRP), leading to chronic low-grade inflammation [8], that appears to play a central role in the development of a variety of metabolic and hormonal dysfunctions [9,10].
Adipose tissue has been recognized as an important endocrine and metabolically active organ that expresses and/or secretes various substances of local or systemic action. A growing number of hormones and other active circulating factors have been found to be secreted by adipose tissue and to have established roles in the progression to diabetes [11].
Bioactive molecules known as “adipokines” (adipocytokines), including leptin and adiponectin, significantly contribute to the development of metabolic abnormalities. The effects of leptin and adiponectin on vascular function, immune regulation and fat metabolism, make them key players in the pathogenesis, and thus responsible for the development of diabetes [12,13]. Increased body weight and central fat accumulation lead to changes in serum levels of leptin and adiponectin, the reduction of insulin sensitivity and the development of glycemic dysregulation [14].
The Xavante Indians started to have permanent contact with the Brazilian society since 1957. Presently, they have lost their nomadic life style, become more sedentary, and are incorporating in their diet, several foods from the general Brazilian diet. Thus, important changes, and in a short period of time, have been observed in the nutritional and health profile of this population, such as the emergence of obesity and diabetes [5]. The association of obesity and diabetes with inflammatory and hormonal factors in this particular population has not yet been described.
The aim of this study was to evaluate serum levels of the CRP, adiponectin and leptin in Xavante Indians and to correlate them with categories of glucose tolerance and body mass index.
MATERIALS AND METHODS
A cross-sectional study was conducted among Xavante Indians aged 20 years or more, from the Sangradouro and São Marcos reservations, Mato Grosso state, Brazil. These reservations were visited 10 times between 2008 and 2012. The study was approved by the Brazilian National Indian Foundation, the agency responsible for indigenous protection, and by the Brazilian National Ethics Committee of the Ministry of Health, in accordance with the Declaration of Helsinki. Local indigenous leaders were previously contacted to explain the study and the procedures. All participants gave written informed consent prior to taking part in the study. For those who were illiterate, fingerprints were used to document their approval.
Data collection, physical examination, anthropometric measurements and blood sampling were performed early in the morning in the Indian villages. Blood samples were kept in ice box and transported to the headquarter of the Indian reservation, when they were centrifuged, separated into aliquots, and stored at – 20ºC before transportation to the city of São Paulo – SP, for laboratory analysis.
Subject evaluation
The collected information included name, age, and sex, name of parents, marital status and prior health problems. All anthropometric measurements were made in the morning, with subjects wearing light clothes and barefoot. Weight was measured using a portable digital scale (Plenna®) and height by a stadiometer (AlturaExata®). Body Mass Index (BMI) was calculated as the ratio of weight (kg) to the square of height (m).
The Xavante Indians were divided into three groups according to their BMI eutrophic, composed of those with BMI < 25 kg/m2 (n=138); overweight, with BMI 25-29.9 kg/m2 (n=323), and obese with BMI ≥ 30 kg/m2 (n=447). Individuals with basal capillary glucose <200 mg/dL and not taking anti-diabetic medication were submitted to a 75g oral glucose tolerance test (OGTT). Capillary glycemia was measured using a portable glucometer (HemoCue@ Glucose201+ HemoCue AB, Angelholm, Sweden) at fasting and 2 hours after the 75 g anhydrous glucose load (Glutol@).
According to the 2-h glycemia in the OGTT the participants were classified into the following categories, using the WHO/IDF [15] criteria: normal glucose tolerance (NGT) group when the 2-h glycemia value was < 140 mg/dL, impaired glucose tolerance (IGT) group when 2-h capillary glycemia was between 140-199 mg/dL and diabetes mellitus (DM) group when the 2-h capillary glycemia was ≥ 200 mg/dL. Those subjects routinely using oral anti-diabetics or insulin, or with basal capillary glycemia ≥ 200 mg/dL were also added to the DM group. Basal glycemia was not used to classify the subjects, except when ≥ 200 mg/dL, since the fasting condition in this population is not very reliable.
Blood sampling
Blood samples were collected in tubes, without anticoagulant, and centrifuged for serum separation. Serum samples were stored individually at - 20°C for CRP, adiponectin and leptin determinations.
CRP levels were measured using a Cobas C series autoanalyzer (Roche/Hitachi Diagnostics).
Adiponectin and leptin concentrations were determined using ELISA kits (Human Adiponectin Elisa kit, Millipore, USA and Human Leptin Elisa kit, Millipore, USA). The reaction rates were measured by absorbance in a spectrophotometer with a 450 nm filter. The results were calculated using the standard curve and shown in µg/mL for adiponectin and ng/mL for leptin.
Statistical Analysis
The prevalence of normal glucose tolerance (NGT), impaired glucose tolerance (IGT) and Diabetes Mellitus (DM) were calculated for the BMI, gender and age categories. Geometric means and their respective 95% confidence intervals were calculated for CRP, adiponectin, leptin, and leptin/adiponectin according to gender, glucose tolerance and BMI and the Two-way ANOVA with logarithmic transformation of data was used to verify differences in geometric means among these groups. Geometric means were used due to the data being highly skewed. The level of significance was set at 0.05 for all tests.
RESULTS
The distribution of the NGT, IGT and DM frequencies according to BMI categories and gender is presented in (Table 1),
Table 1: Number and percentage of normal glucose tolerance (NGT), impaired glucose tolerance (IGT) and diabetes mellitus (DM) according to body mass index (BMI) categories, by gender in Brazilian Xavante Indians.
| Glucose Tolerance BMI (kg/ m²) | Men N=456 | Women N=482 | Total N=938 | Total | ||||||||||||||||
| NGT | IGT | DM | NGT | IGT | DM | NGT | IGT | DM | ||||||||||||
| N | % | N | % | N | % | N | % | N | % | N | % | N | % | N | % | N | % | N | % | |
| <25 | 41 | 17.2 | 20 | 13.9 | 10 | 13.5 | 20 | 14.5 | 22 | 12.5 | 25 | 15 | 61 | 16 | 42 | 13 | 35 | 14.5 | 138 | 14.7 |
| 25-29.9 | 91 | 38.2 | 47 | 32.6 | 26 | 35 | 47 | 34 | 52 | 29.5 | 60 | 35.6 | 138 | 37 | 99 | 31 | 86 | 35.5 | 323 | 34.4 |
| ≥ 30 | 106 | 44.5 | 77 | 53.5 | 38 | 51.5 | 71 | 51.5 | 102 | 58 | 83 | 49.4 | 177 | 47 | 179 | 56 | 121 | 50 | 477 | 50.8 |
| Total | 238 | 100 | 144 | 100 | 74 | 100 | 138 | 100 | 176 | 100 | 168 | 100 | 376 | 100 | 320 | 100 | 242 | 100 | 938 | 100 |
which shows that most of the subjects with diabetes were in the obese and overweight groups. However, when considering prevalence, the rates for diabetes were similar in all BMI categories (25.4% in the eutrophic group, 26.6% in the overweight group and 25.4% in the obese group), as shown in (Figure 1).
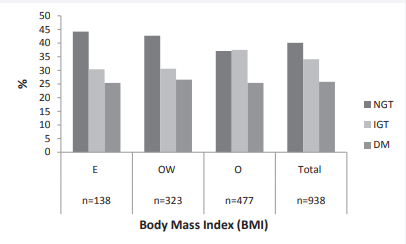
Figure 1 Prevalence of normal glucose tolerance (NGT), impaired glucose tolerance (IGT) and diabetes mellitus (DM) in the total population and by Body Mass Index (BMI) categories in Xavante Brazilian Indians. E: Eutrophic; OW: Overweight; O: obese.
The distribution of the NGT, IGT and DM frequencies according to age group, BMI category and gender are presented in (Table 2).
Table 2: Distribution (%) of Brazilian Xavante Indians by glucose tolerance categories (NGT, IGT and DM) by age group, body mass index (BMI) categories and gender.
|
Glucose Tolerance Age group (years) |
Men N=456 | Women N=482 | Total N=938 | |||||||||||||||||||||||||||
| NGT N=238 (52.2) |
IGT N=144 (31.6) |
DM N=74 (16.2) |
NGT N=138 (28.6) |
IGT N=176 (36.5) |
DM N=168 (34.8) |
NGT N=376 (40) |
IGT N=320 (34.2) |
DM N=242 (25.8) |
Total N=938 (100) |
|||||||||||||||||||||
| % | % | % | % | % | % | % | % | % | % | |||||||||||||||||||||
| E | OW | O | E | OW | O | E | OW | O | E | OW | O | E | OW | O | E | OW | O | E | OW | O | E | OW | O | E | OW | O | E | OW | O | |
| 20-39 | 10 | 26 | 30 | 5 | 17 | 33 | 4 | 9 | 20 | 8 | 25 | 43 | 6 | 17 | 38 | 2 | 10 | 25 | 9 | 25 | 36 | 5 | 17 | 37 | 3 | 9 | 23 | 6 | 18 | 33 |
| 40-59 | 3 | 5 | 12 | 1 | 5 | 15 | 3 | 18 | 26 | 1 | 4 | 6 | 3 | 14 | 3 | 13 | 18 | 2 | 4 | 10 | 4 | 14 | 3 | 14 | 21 | 2 | 7 | 14 | ||
| ≥60 | 4 | 8 | 2 | 8 | 10 | 6 | 7 | 8 | 5 | 5 | 6 | 2 | 7 | 10 | 5 | 9 | 14 | 7 | 5 | 7 | 2 | 7 | 10 | 6 | 9 | 12 | 6 | 7 | 9 | 4 |
| Total | 17 | 38 | 45 | 14 | 32 | 54 | 14 | 35 | 51 | 14 | 34 | 51 | 13 | 30 | 57 | 14 | 37 | 50 | 16 | 36 | 48 | 12 | 31 | 57 | 15 | 35 | 50 | 15 | 34 | 51 |
NGT: Normal Glucose Tolerance; IGT: Impaired Glucose Tolerance; DM: Diabetes; E: Eutrophic ; OW: Overweight; O - obese
In all glucose tolerance categories, the frequency of obesity was higher in the younger age group, in both genders.
Table 3 presents the geometric means and 95% confidence intervals for CRP, adiponectin, and leptin concentrations, and leptin/adiponectin ratios, according to glycemic status (NGT, IGT and DM), gender and BMI categories. Obese women presented higher CRP levels than overweight and eutrophic women in the IGT and DM groups. In the NGT group, CRP levels were significantly higher in overweight men than in overweight women (Table 3).
Table 3: Geometric means and 95% confidence intervals of CRP, Adiponectin, Leptin and Leptin/Adiponectin ratio in normal glucose tolerance (NGT) impaired glucose tolerance (IGT) and diabetes mellitus (DM), by gender and body mass index categories in Brazilian Xavante Indians.
| Variables | Sex | Total = 938 | ||||||||
| NGT | IGT | DM | ||||||||
| Geometric Mean [CI] | Geometric Mean [CI] | Geometric Mean [CI] | ||||||||
| E | OW | O | E | OW | O | E | OW | O | ||
| CRP (mg/L) | Women | 3.11 [1.91;5.06] | 1.68 [1.22;2.30]* | 2.99 [2.31;3.87 | 3.07 [1.93;4.88] | 2.50 [1.85;3.38] | 3.34 [2.68;4.15]+ | 3.98 [2.58;6.16] | 3.38 [2.55;4.48] | 4.54 [3.57;5.76]+ |
| Men | 2.33 [1.65;3.29] | 2.49 [1.98;3.13] # | 2.85 [2.31;3.53] | 3.37 [2.07;5.49] | 3.63 [2,64;4.99] | 3.05 [2.38;3.91] | 2.83 [1.42;5.62] | 2.68 [1.75;4.10] | 3.13 [2.20;4.46] | |
| Total Adiponectin (ug/mL) | Women | 26.24 [15.27;45.10] | 14.89 [10.34;21.45] | 14.24 [10.62;19.11] | 41.33 [24.34;70.10]+ | 27.99 [20.01;39.16]+ | 14.22 [11.14;18.14]* | 18.21 [11.22;29.55] | 14.72 [10.68;20.29] | 14.51 [10.93;19.26] |
| Men | 25.16 [17.08;37.08] | 22.67 [17.56;29.26] | 12.79 [10.03;16.31]* | 27.31 [15.43;48.33] | 17.91 [12.38;25.91] | 11.44 [8.58;15.24]* | 26.39 [12.27;56.77] | 15.05 [9.08;24.93] | 10.38 [7.01;15.38]* | |
| Leptin (ng/mL) | Women | 2.98 [1.99;4.47] | 10.89 [8.35;14.20]* | 18.22 [14.65;22.67]* | 4.11 [2.77;6.09] | 10.75 [8.32;13.91]+ | 17.27 [14.36;20.78] * | 3.23 [2.22;4.71] | 7.00 [5.48;8.94]*◊ | 13.42 [10.89;16.55]* ◊ |
| Men | 0.48 [0.36;0.63] # | 1.74 [1,44;2.11]* # | 5.32 [4.44;6.36]* # | 0.63 [0.42;0.94] # | 1.81 [1.38;2.38]* # | 5.87 [4.74;7.27]* # | 0.76 [0.42;1.39] # | 1.53 [1.06;2.21] # | 4.43 [3.30;5.93] *# | |
| Leptin/ Adiponectin ratio | Women | 0.11 [0.05;0.24] | 0.74 [0.45;1.22]* | 1.25 [0.83;1.87]* | 0.10 [0.05;0.20] | 0.39 [0.24;0.63]* | 1.26 [0.89;1.77]* | 0.18 [0.09;0.35] | 0.51 [0.32;0.80]* | 0.99 [0.67;1.47]* |
| Men | 0.02 [0.01;0.03]# | 0.08 [0.06;0.11]*# | 0.41 [0.29;0.57]*# | 0.03 [0.01;0.06]# | 0.10 [0.06;0.17]*# | 0.55 [0.37;0.83]*# | 0.02 [0.01;0.07]# | 0.10 [0.05;0.20]*# | 0.43 [0.25;0.73]*# | |
Among the men, adiponectin levels were lower in the obese group in comparison with the overweight and eutrophic groups, and the differences were statistically significant in all categories of glucose tolerance. Among the women, adiponectin levels were also lower in the obese group, however, the differences were significant only in the IGT group; in the IGT group, and the overweight women presented lower adiponectin levels than those of the eutrophic group. Differences between the genders regarding adiponectin levels were not statistically significant (Table 3).
Among the men, leptin levels were higher in the obese group in comparison with the overweight and eutrophic groups in all categories of glucose tolerance and in the overweight group in relation to the eutrophic group for the NGT and IGT groups. Among the women, leptin levels were higher in the obese group in relation to the overweight and eutrophic groups, and in the overweight group in comparison with the eutrophic group, for all categories of glucose tolerance. Leptin levels were higher in women than in men in all BMI and glucose tolerance categories (Table 3).
Leptin/adiponectin ratios were higher in overweight and obese individuals of both genders, and in all categories of glucose tolerance. Women had higher leptin/adiponectin ratio than men in all BMI and glucose tolerance categories (Table 3).
DISCUSSION
One of the most important risk factor for the development of type 2 diabetes mellitus is obesity [16]. Abnormalities in the pancreatic β-cell function have been associated with hormones and others active circulating factors secreted by the adipose tissue [11]. Obesity has been shown to be associated with a proinflammatory state [17]. The association of the development of type 2 diabetes with a state of subclinical inflammation was postulated in the last decade [18,19]. Chronic low-grade inflammation and signals of inflammation have been described through the production of various inflammatory mediators, which in turn, could be involved in the development of metabolic complications [20,21].
The high prevalence of obesity and diabetes in Xavante Indians was linked to changes in the lifestyle, particularly regarding eating habits and physical activity, of a genetically predisposed population [5]. In this study, the prevalence of being obese and overweight were higher in the younger age groups (20-39 and 40-59 years) which are probably the age groups that have suffered more influence from contact with colonizing fronts of the Brazilian society.
Obese Xavante women exhibited higher levels of CRP than the overweight or eutrophic women in the IGT and DM groups. This trend was less evident among obese Xavante men. Among the obese Xavante, there is a tendency for higher CRP levels in women, in all categories of glucose tolerance, and its role in gender related differences in the prevalence of diabetes requires further studies. Secretion of CRP by the liver is stimulated by several inflammatory cytokines, which are released in response to trauma, infection and inflammation, with this protein rapidly reducing the resolution of these conditions [22].
Adipose tissue is now recognized to be an important endocrine organ, secreting a variety of polypetides (adipokines), such as TNF-α, IL-6, adiponectin and leptin, which are involved in the regulation of energy metabolism, insulin resistance and metabolic syndrome [23,24]. Obesity has been shown to cause resistance or reduced sensitivity to various hormones, including adiponectin and leptin [25].
Adiponectin levels were lower in obese Xavante, of both genders, for all glucose tolerance groups. It is well known that increased adiposity is associated with decreased adiponectin secretion. Adiponectin has beneficial effects, improving insulin sensitivity and vascular function, thus being an anti-diabetic and anti-atherogenic [26,27]. Low levels of adiponectin have been associated with the development of type 2 diabetes [28], whereas an increase in adiponectin levels might be associated with better glycemic control and reduced inflammation in individuals with diabetes [29]. A meta-analysis study showed that high levels of adiponectin are associated with a lower risk of diabetes [30]. Among the obese Xavante, adiponectin levels were not lower in the group with diabetes, probably due to the fact that we measured total adiponectin and not the high molecular weight fraction.
Leptin levels were higher in overweight and obese Xavante than in the eutrophic subjects, for all glucose tolerance groups and both genders. The elevation of leptin levels that accompanies increased adiposity is in agreement with a possible role of leptin resistance in human obesity [31]. Leptin levels were higher in women of all glucose tolerance groups. Leptin is synthesized by adipocytes in response to changes in body fat mass and nutritional status [32], and is involved in the induction of low-grade inflammation associated with obesity [33].
The effects of leptin on pancreatic β-cells are direct and the relationship between β-cells and adipose fat suggests a mechanism for the role of excess fat in pancreatic dysfunction [11]. It is now accepted that leptin has an inhibitory effect on insulin secretion from pancreatic β-cells, in vitro and in vivo, and has the additional effect of reducing preproinsulin gene expression [34].
Overweight and obese Xavante of both genders in the NGT group presented lower adiponectin and higher leptin levels, which could be an indicator for their higher risk for developing diabetes. It has been shown that subjects without diabetes but with higher CRP and lower adiponectin levels are more likely to develop type 2 diabetes that this association is not completely independent of obesity [35], and measures that increase adiponectin levels are important targets for decreasing the risk of diabetes [29].
The ability of leptin and adiponectin to stimulated fatty acid oxidation in muscle is impaired in obese individuals [36], and an intrinsic relationship between adiponectin/leptin (A/L) acting as a possible marker of the inflammation state has been suggested [37,38].
The leptin/adiponectin ratio has a stronger association with the risk of type 2 diabetes, metabolic syndrome or coronary artery disease than leptin or adiponectin alone and may be a useful index for insulin resistance [39,40]. Xavante women had higher leptin/adiponectin ratios than men, for all BMI and glucose tolerance categories, suggesting that the women have more insulin resistance and therefore a higher risk for diabetes.
Increased CRP levels affect adiponectin and leptin gene expression and this might represent a mechanism by which CRP regulates the occurrence of insulin resistance and obesity [41]. Indigenous people appear to have an enhanced proinflammatory microenvironment, reflecting environment-gene interactions [42,43]. The Xavante compose a population that has remained genetically isolated over the past decades [6] (Kuhn et al., 2012) and the practice of consanguineous unions that occurs within the community has probably contributed to the high prevalence of diabetes/obesity among this population [5].
The data obtained in the present study support the fact that metabolic changes promoted by being overweight and obese cause alterations in inflammatory mediators and hormones in Xavante Indians. However, lower adiponectin and higher leptin levels detected in the obese subjects of the NGT group deserve further attention, as these adipokines are likely to be a significant factor in pancreatic β-cell failure and chronic low-grade inflammation.
ACKNOWLEDGEMENTS
This study was supported by the Fundação de Amparo à Pesquisa do Estado de São Paulo-FAPESP (proc. 2010/05634- 0) and the Conselho Nacional de Desenvolvimento Científico e Tecnológico-CNPq (proc. 476347/2007-6). and Coordenação de Aperfeiçoamento de Pessoal de Nível Superior – CAPES [PNPD] - Brazil.
The authors are thankful to the Salesian Mission and Xavante Indigenous community from the Sangradouro/Volta Grande and São Marcos reservations for the collaboration received in the development of this study.
REFERENCES
7. Instituto Brasileiro de Geografia e Estatística (IBGE). Censo Demográfico 2010.
10. Kopelman P. Health risks associated with overweight and obesity. Obes Rev. 2007; 8: 13-17.
22. Das UN. Is obesity an inflammatory condition? Nutrition. 2001; 17: 953-966.
26. Ouchi N, Kihara S, Arita Y, Maeda K, Kuriyama H, Okamoto Y, et al. Circulation. 1999; 100: 2473-2476.


