Association between CD4+CD25+ Treg Cell and Graves
- 1. Department of Laboratory of Diabetes, Guang’anmen Hospital, China
- 2. Beijing University of Chinese Medicine, China
Abstract
Published data regarding the association between CD4+CD25+ Treg cell and Graves’ disease (GD). The present meta-analysis aimed to obtain a more precise estimation of the relationship between CD4+CD25+Treg cell and GD. All eligible case-control studies of CD4+CD25+Treg cell and GD were selected from PubMed, EMBASE, Cochrane central register of controlled trials, and Chinese National Knowledge Infrastructure (CNKI) and Wanfang databases up to October 2016. The data were extracted, and the mean difference (MD) and 95% confidence interval (CI) were calculated. A total of 22 case-control studies were assessed in this meta-analysis, including 766 cases and 528 controls. There was a significant association between decreased CD4+CD25+ Treg cell and GD. The proportion of CD4+CD25+ Treg cell in peripheral lymphocytes of the GD patients is lower than it in the normal people. Combining effect sizes from 22 studies for Graves’ disease as an outcome found a pooled effect of MD = −1.40 (95% CI: −1.96, −0.84; p< 0.00001) favoring the low CD4+CD25+ Treg cell level by the random effects model. However, a high degree of heterogeneity was found (I 2 =96%, p < 0.00001).
Conclusions: The results of this meta-analysis suggest that insufficiency of CD4+CD25+Treg cell in peripheral lymphocytes may be a pathogenic factor of GD.
Keywords
• CD4+CD25+Treg cell
• Graves’ disease
• Meta-analysis
Citation
Yuan Q, Zhao Y, Zhu X, Liu X (2017) Association between CD4+CD25+ Treg Cell and Graves’ Disease: A Meta-Analysis. J Endocrinol Diabetes Obes 5(1): 1097.
ABBREVIATIONS
GD: Graves’Disease; AITD: Autoimmune Thyroid Disease; TSAb: Thyroid Stimulating Antibodies; TSH: Thyrotrophin; TSHR: Thyrotrophin Receptor; Tregs: Regulatory T Cells
INTRODUCTION
Graves’ disease (GD) is an autoimmune thyroid disease (AITD). The incidence of GD is various in different regions but has a growing trend. In England, the incidence of GD is 1 to 2 cases per 1000 population per year, higher than the rate of 0.3‰ per year reported before [1]. The prevalence of GD in American and China is approximately 1.2% [2] and 2-3.0% [3], respectively. The frequency in women is much greater than it is in men [4]. The prevalent symptoms of GD include palpitations, tremulousness, heat intolerance, weight loss, and anxiety. And the physical findings of GD are tachycardia, proptosis, thyroid enlargement, and tremor [5]. Thyroid stimulating antibodies (TSAb) is believed to be a pathogenesis of GD. They mimic the action of thyrotrophin (TSH), binding to the thyrotrophin receptor (TSHR) and causing its activation, finally resulting in the uncontrolled production and release of thyroid hormones [6].
Although the presence of TSAb has been observed in GD patients, the mechanisms that lead to its production is still elusive. As the various results obtained by different researches [7-9], GD cannot be explained only by Th1/Th2 theory. Recently, much attention has been focused on regulatory T cells (Tregs) [10,11]. These cells express CD25 (a chain of the IL-2 receptor) on their cell surface and also express the fork head family transcription factor Foxp3 [12]. It constitutes 10% of peripheral CD4+ T cells [13], and the abnormalities in Tregs numbers and function are implicated in several autoimmune diseases [14]. Some investigators believed it is also associated with GD [15]. However, it is still controversial whether the numerical and/or functional abnormalities of CD4+ CD25+ Treg cell are associated with GD. So we do the meta-analysis to find the association between Treg cell and GD.
MATERIALS AND METHODS
Search Strategy
We performed a literature search using the electronic databases PubMed, EMBASE, Cochrane central register of controlled trials, Chinese National Knowledge Infrastructure (CNKI) and Wanfang databases (up to October 2016) to identify articles that evaluated the association between CD4+ CD25+ Treg cell and GD. The search terms were as follows: (Graves’ disease or toxic goiter or autoimmune thyroid disease or Basedow disease or hyperthyroidism or thyrotoxicosis) and (CD4+ CD25+ Treg cell or CD4+ CD25+ regulatory T cell or Treg cell or Treg or regulatory T cell or regulatory T lymphocyte). The search was limited to humans, without language restrictions. All eligible studies were examined carefully, and if more than one autoimmune thyroid disease type group was reported in a given report, then each type were extracted separately.
Inclusion and exclusion criteria
All the studies identified were reviewed independently by two investigators. The included studies conformed to the following criteria: (1) an assessment of the association between CD4+ CD25+ Treg cell and GD, (2) studies performed to compare the proportion of CD4+ CD25+ Treg cell in CD4+ lymphocyte, (3) a case control study design, (4) the cases were diagnosed as Graves’ disease and the control group was composed of healthy individuals, (5) human subjects. The studies were excluded from the meta-analysis as follows: (1) a case-only study design, (2) a lack of data regarding to the CD4+ CD25+ Treg cell, (3) the inclusion of duplicate data, (4) conference abstracts, case reports, case series, editorials or review articles. For overlapping studies, only the study with the largest sample numbers was included. The Newcastle-Ottawa Quality Assessment Scale was used to assess the quality of the studies included in the meta-analysis and performed by two independent investigators. If the two investigators reported different results, a discussion was conducted in order to reach an agreement. Finally, an expert (Liu Ximing) was invited to verify the information.
Statistical analysis
The Cochrane Collaboration RevMan 5.3 software program was used in this meta-analysis. The χ2 -test-based Qstatistic test was performed to assess the degree of study heterogeneity [16]. The effect of heterogeneity was quantified according to the I2 value. A significant Q test (p< 0.05) or I2 > 50% indicated heterogeneity across studies, in which case, the random effects model was used [17]. Otherwise, the fixed effects model was applied [18]. The mean difference (MD) and 95% confidence interval (CI) were calculated for the outcome. In case of heterogeneity, subgroup analysis was conducted with the Cochrane Collaboration RevMan 5.3 software program. The level of publication bias was assessed according to Egger’s and Begg’s tests with the STATA Software 12.0 package. Funnel plots were also used to evaluate the degree of publication bias.
RESULTS AND DISCUSSION
In our study, we initially searched 822 related references, among which 112 were duplicates. When removing the duplicates and other unrelated references (insufficient data about the CD4+ CD25+ Treg cell and disease definition unrelated to the Graves’ disease in the references), 22 references met our inclusion criteria and were recruited in the meta-analysis (Figure 1).
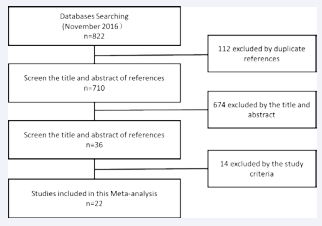
Figure 1 The flow diagram of the study selection.
All the references were used as continuous data on the meta-analysis of CD4+ CD25+ Treg cell and Graves’ disease.
Information of the Included Studies
The information of the included studies was listed in Table (1).
Table 1: The characteristics of the included studies in the meta-analysis.
| No. | First Author | Year | Country | Age | detection index | Proportion of gender (male/female) | Diagnostic criteria include high TPO and Tg | proportion of CD4+CD25+ Treg cell | Sample Size | ||||
| Case | Con | Case | Con | Case | Con | p value | (Case/Con) | ||||||
| 1 | Chaoming Mao et al.[19] | 2011 | China | N | CD4+CD25+Foxp3+ | F>M | F>M | Y | 1.57±0.67 | 3.36±0.96 | <0.001 | 48/48 | |
| 2 | Dang Shan et al.[20] | 2007 | China | 38±12 | 34±9 | CD4+CD25+ | 7/14 | 3/10 | N | 4.48±4.21 | 8.8±4.61 | <0.05 | 21/13 |
| 3 | Deshun Pan et al.[21] | 2009 | USA | N | CD4+CD25+CD127+ | N | N | 8.00±2.20 | 7.3±2.2 | >0.05 | 19/30 | ||
| 4 | Dong Jingwei et al.[22] | 2011 | China | N | CD4+CD25+CD127- | 58/32 | 24/16 | Y | 1.39±1.09 | 4.59±1.14 | <0.01 | 90/40 | |
| 5 | Gao Guihua et al.[23] | 2010 | China | 40.5 | 38 | CD4+CD25+Foxp3+ | 13/32 | 5/15 | N | 3.20±1.70 | 6.5±3.6 | <0.05 | 45/20 |
| 6 | Gao Shutao et al.[24] | 2011 | China | 41.6 | 35.6 | CD4+CD25+ | 5/15 | 8/12 | Y | 3.25±0.97 | 2.86±1.04 | >0.05 | 20/20 |
| 7 | Hong Qiang et al.[25] | 2010 | China | 40 | 46 | CD4+CD25+Foxp3+ | 13/39 | 11/22 | Y | 4.00±0.42 | 6.65±1.46 | <0.01 | 52/33 |
| 8 | Kazuhiko Matsuzawa et al.[26] | 2016 | Japan | 43.5±15.4 | 36.8±9.2 | CD4+CD25+Foxp3+ | N | Y | 6.80±1.50 | 6.8±1.3 | >0.05 | 28/15 | |
| 9 | Li Chunhua et al.[27] | 2015 | China | 34.5±11.60 | 33.23±10.60 | CD4+CD25+ | 23/17 | 9/11 | N | 1.45±0.95 | 3.13±0.67 | <0.05 | 40/20 |
| 10 | Li Huizhi et al.[28] | 2009 | China | 38.9 | 52.86 | CD4+CD25+ | 14/46 | N | N | 15.37±8.27 | 19.97±5.42 | 0.723 | 60/29 |
| 11 | Lv Meng et al.[29] | 2014 | China | N | CD4+CD25+Foxp3+ | N | N | 1.61±0.15 | 1.72±0.24 | >0.05 | 15/15 | ||
| 12 | Qian Wei et al.[30] | 2011 | China | 30.7±9.2 | 35.7±9.3 | CD4+CD25+Foxp3+ | 10/22 | 10/20 | N | 2.60±1.20 | 5.8±1 | <0.05 | 32/30 |
| 13 | Sun Weili et al.[31] | 2015 | China | 41.1±10.1 | 37.7±12.7 | CD4+CD25+ | 5/15 | 3/7 | N | 8.20±0.70 | 8.3±0.8 | >0.05 | 20/10 |
| 14 | Tang Dahai et al.[32] | 2008 | China | 41.2 | N | CD4+CD25+ | 7/29 | N | N | 6.96±1.98 | 8.22±2.78 | >0.05 | 36/20 |
| 15 | Wang hongxiang et al.[33] | 2006 | China | 28.49±4.16 | 29.61±5.74 | CD4+CD25+ | 21/11 | 14/6 | N | 7.38±2.15 | 7.54±2.35 | >0.05 | 32/20 |
| 16 | Wei Wei et al.[34] | 2015 | China | 35.6 | 34.8 | CD4+CD25+ | 3/16 | 5/15 | Y | 4.56±4.14 | 8.84±4.45 | 0.231 | 19/20 |
| 17 | Xie Xiaoyan et al.[35] | 2011 | China | 39.29±13.31 | 40.28±12.27 | CD4+CD25+Foxp3+ | 6/19 | 5/20 | Y | 1.43±0.91 | 1.66±0.27 | >0.05 | 25/25 |
| 18 | Zeng Hua et al.[36] | 2012 | China | 32 | 33 | CD4+CD25+CD127+ | 23/55 | 14/28 | N | 4.55±1.05 | 5.3±1.36 | 0.043 | 78/42 |
| 19 | Zha bingbing et al.[37] | 2012 | China | 32 | 32 | CD4+CD25+Foxp3+ | 3/13 | 5/13 | Y | 0.83±0.30 | 1.35±0.7 | >0.05 | 16/18 |
| 20 | Zhao Wenyan et al.[38] | 2011 | China | 41.6±12.9 | 35.6±10.2 | CD4+CD25+ | 15/5 | 12/8 | N | 3.25±0.97 | 2.86±1.04 | >0.05 | 20/20 |
| 21 | Zheng Lingtao et al.[39] | 2012 | China | 38 | 35 | CD4+CD25+ | 10/20 | 7/13 | Y | 15.94±5.02 | 23.23±4.72 | <0.05 | 30/20 |
| 22 | Zhou JIn et al.[40] | 2011 | China | 36.65±11 | 32±6.14 | CD4+CD25+Foxp3+ | 7/13 | 7/13 | Y | 1.93±1.35 | 3.02±1.76 | <0.05 | 20/20 |
| F: Female, M: Male, Y: Yes, N: Not mentioned | |||||||||||||
Most studies were published after 2010 (77.27%, 17/22). 20 studies were from China except 2 studies were from other countries. There were 1294 study subjects, including 766 (59.2%) cases with Graves’ disease and 528(40.8%) controls. All studies received a score of more than or equal to six, indicating good quality.
Continuous Data of CD4+CD25+ Treg cell and Graves’ disease
The analysis included 22 studies involving 766 cases and 528 controls. Combining effect sizes from 22 studies for Graves’ disease as an outcome found a pooled effect of MD = −1.40 (95% CI: −1.96, −0.84; p< 0.00001) favoring the insufficient of CD4+ CD25+ Treg cell in GD patients by the random effect analysis (Figure 2),
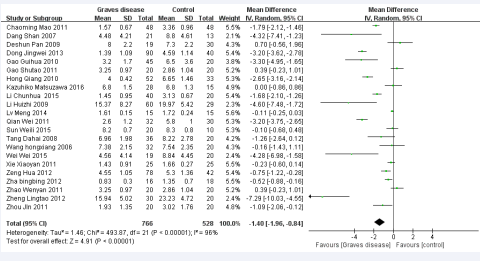
Figure 2 Forest plot of the studies comparing the association between CD4+CD25+Treg celland Graves’disease by meta-analysis with the random effects analysis.
which was statistically significant compared to the control group. However, a high degree of heterogeneity was found (I2 = 96%, p< 0.00001).
Subgroup analysis
We performed subgroup analysis to analyze the sources of heterogeneity (Figures 3-7).
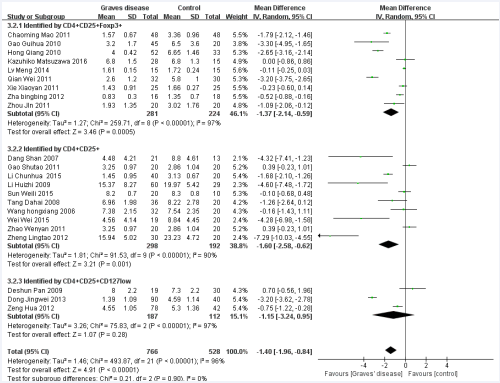
Figure 3 Forest plot of the studies comparing the association between CD4+CD25+Treg cell and Graves’disease in the subgroup of detection index by the random effects analysis.
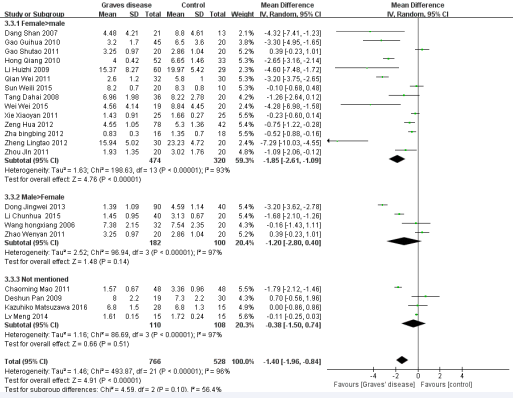
Figure 4 Forest plot of the studies comparing the association between CD4+CD25+Treg cell and Graves’ disease in the subgroup of gender proportion by the random effects analysis.
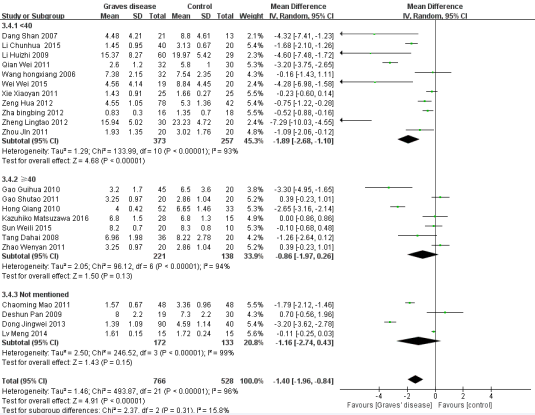
Figure 5 Forest plot of the studies comparing the association between CD4+CD25+Treg cell and Graves’ disease in the subgroup of different ages by the random effects analysis.
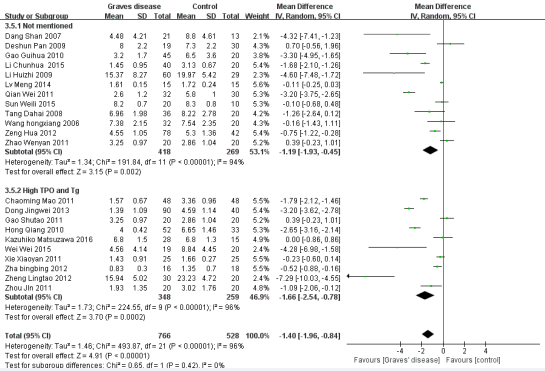
Figure 6 Forest plot of the studies comparing the association between CD4+CD25+Treg cell and Graves’disease in the subgroup of diagnostic criteria by the random effects analysis.
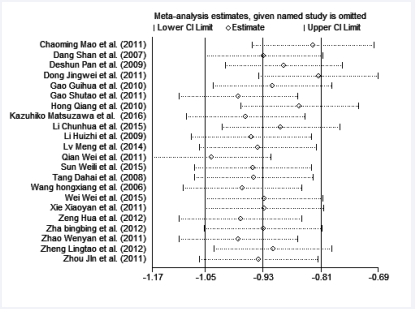
Figure 7 The sensitivity analysis for the association between CD4+ CD25+ Treg cell and Graves’disease.
Five factors were used for subgroup analysis, including detection index (CD4+CD25+Foxp3/+CD4+CD25+/other) (Figure 3), proportion of gender (Female> male/Male> female/Not mentioned), proportion of age (< 40/> =40/Not mentioned) (Figure 4), countries (China/other), diagnostic criteria (High TPO and Tg/Not mentioned) (Figure5). Figures (3-7) show that the heterogeneity remained high (> 75%) in all subgroups.
Meta regression analysis
A Meta regression was performed further to explore the possible sources of the heterogeneity. We put the five factors in the subgroup analysis into the Meta regression. As shown in Table (2),
Table 2: Meta regression of the five factors.
| Factor | Coefficient | SE | 95%CI | t | P | |
| Detection index | 0.2085533 | 0.3557076 | -0.5419242 | 0.9590308 | 0.59 | 0.565 |
| Gender proportion | 0.3103815 | 0.4033283 | -0.5405668 | 1.16133 | 0.77 | 0.452 |
| Age | -0.2671264 | 0.4153498 | -1.143438 | 0.609185 | -0.64 | 0.529 |
| Diagnostic criteria | -0.3261077 | 0.4924427 | -1.365071 | 0.7128555 | -0.66 | 0.517 |
| Constant | -0.8685331 | 1.199833 | -3.399958 | 1.662892 | -0.72 | 0.479 |
| Abbreviations: SE: Standard Error; CI: Confidence Interval; t: t-value; p: p-value. | ||||||
none of the five factors had any definite influence on heterogeneity.
Sensitivity analysis
In order to assess the stability of the results of the meta- analysis, the sensitivity analysis was performed and shown in Figure (8).
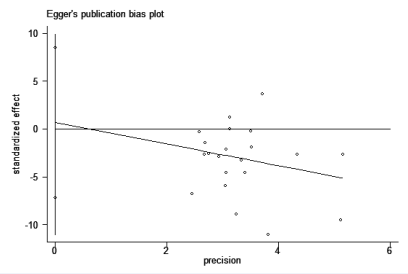
Figure 8 The Egger’s publication bias plot for the association between CD4+CD25+ Treg cell cell and Graves’ disease.
Statistically similar results were obtained after sequentially excluding each study, suggesting the stability and reliability of the results.
Publication bias
Figure (8) showed the Egger’s publication bias plot in the meta-analysis. The plots shape, as well as the p value from Egger’s regression (p = 0.852), showed strong evidence of publication bias.
CD4+ cells are thought to divide into Th1 and Th2 subsets. Th1 cells are characterized by the production of interferon-c (IFN-c) and induce cell-mediated immunity against intracellular pathogens. Th2 cells produce interleukin-4 (IL-4) and stimulate humoral immunity against parasitic helminthes [41]. Nowadays, some researcher found Th17, a newly identified CD4+ T cell subset. It also participates in orchestrating a specific kind of inflammatory response [42]. Aside from the mentioned subsets, CD4+ CD25+ Treg cell may be also an important role in the pathogenesis of GD. HUAN J found that the proportion of CD4+ CD25+ Treg cell in peripheral lymphocytes of the SLE patients in active period is lower than it in the normal people [43]. Because of its crucial role for the regulation of immune responses to pathogens, self-antigens, and allergens [44,45]. Some scholars regarded it as a pathological factor of GD. Zhou J found that the proportion of CD4+ CD25+ Treg cell in peripheral lymphocytes of the GD mice model is lower than it in the normal mice [46]. Nevertheless, the studies on the alteration of the proportion of CD4+ CD25+ Treg cell in people’s peripheral lymphocytes are still insufficient and controversial. In our research, some studies found the proportion of Tregs decreased in the peripheral blood of GD patients but some didn’t [24,28,29,31,32,35]. They found that there is no significant difference in the percentage of CD4+ CD25+ Treg cell between GD patients and the normal people.
In our meta-analysis, we found that the proportion of CD4+ CD25+ Treg cell in peripheral lymphocytes of the GD patients is lower than it in the normal people. The pooled effect of MD = −1.40 (95% CI: −1.96, −0.84). And it showed a statistically significant difference between them (p< 0.00001). Treg cell plays an important role in immune tolerance to self-antigens [47]. It can inhibit organ-specific autoimmune diseases and is potent suppressors of T cell activation in vitro. Treg cell can secrete inhibitory cytokines such as IL-10 and/or TGF-β, cell to cell contact, it may induce antigen-processing cells to enhance tryptophan metabolism and secrete inhibitory cytokines and in this way inhibit the activation of autoreactive T cells and helper T cells [48]. So the insufficient CD4+ CD25+ Treg cell in peripheral lymphocytes may decrease the secreting of inhibitory cytokines and finally lead to the activation of T cells and helper T cells. However, why some studies didn’t find significant differences between GD patients and healthy people of Treg in peripheral blood? We found that researchers who got this conclusion are detected by the index of CD4+ CD25+ . Some people have proved the development of Treg is regulated by the transcription factor Foxp3 [49]. Treg can be divided into 3 subtypes. They are CD69+ Treg lymphocytes, type 1 regulatory lymphocytes (Tr1) and natural Treg (nTreg). Tr1 and CD69+ Treg lymphocytes didn’t express Foxp3. However, immunosuppressive function of CD69+ Treg cells is also defective in the majority of patients with AITD [50]. So we speculated that GD is related to the declined Treg proportion and it caused by the decreasing of different subtypes of Treg.
Our meta-analysis is associated with several limitations. Firstly, we detected an obvious publication bias. The reason for the publication bias may be most of the included studies in this meta-analysis were did in China. Therefore, we didn’t know the alteration of the CD4+ CD25+ Treg cell in GD patients in other races and regions. Secondly, a high degree of heterogeneity was found (I2 = 96%, p< 0.00001) in this meta-analysis. We did the subgroup analysis to analyze the sources of heterogeneity, but the heterogeneity in subgroup is still high. In spite of these limitations, the present meta-analysis also has advantage. The quality of the case-control studies included in this meta-analysis was good and met the inclusion criteria.
CONCLUSION
The results of this meta-analysis indicate that the GD patients have a low proportion CD4+ CD25+ Treg cell in peripheral lymphocytes. Therefore, the deficiency of CD4+ CD25+ Treg cell in peripheral lymphocytes may be a role in the pathogenesis of GD. Well-designed studies with large samples and more regions are needed for further research.
ACKNOWLEDGEMENTS
We are very grateful to Pro. Shaojin Duan at Department of Laboratory of Diabetes, Guang’anmen Hospital, China Academy of Chinese Medical Sciences for his revising the article critically important intellectual content.
REFERENCES
1. Cooper GS, Stroehla BC. The epidemiology of autoimmune diseases. Autoimmun Rev. 2003; 2: 119-125.
5. Burch HB, Cooper DS. Management of Graves Disease: A Review. JAMA. 2015; 314: 2544-2554.
9. Nagayama Y. Graves’ animal models of Graves’ hyperthyroidism. Thyroid. 2007; 17: 981-988.
12. Ziegler SF. FOXP3: of mice and men. Annu Rev Immunol. 2006; 24: 209-226.
17. Dersimonian R, Nan L. Meta-analysis in clinical trials. Controlled Clinical Trials. 1986; 7: 177-188.
41. Zhu J, Paul WE. CD4 T cells: fates, functions, and faults. Blood. 2008; 112: 1557-1569.
44. Schwartz RH. Natural regulatory T cells and self-tolerance. Nat Immunol. 2005; 6: 327-330.
48. von Boehmer H. Mechanisms of suppression by suppressor T cells. Nat Immunol. 2005; 6: 338-344.


