GLP-1 Agonist Liraglutide and Metformin Combination may Reverse Prediabetes
- 1. Faculty of Agricultural Sciences, The Holy Spirit University, Lebanon
- 2. Department of Hematology, The Lebanese Canadian and Notre Dame University Hospitals, Lebanon
- 3. Department of Endocrinology, Middle East Institute, Lebanon
Abstract
Introduction and Objectives: Prediabetes (PD) is a state that precedes type 2 diabetes mellitus (T2D). As the obesity epidemic explodes, and T2D incidence is on the rise, an early intervention during PD would be the optimal approach to prevent the onset of T2D. The purpose of this study is to investigate the effects of the glucagon-like peptide-1 (GLP-1) agonist liraglutide in combination with metformin in eliminating the PD state.
Material and methods: This retrospective study was conducted in two health care centers on 79 overweight/obese prediabetic subjects aged 18 to 65 years. Fifty five subjects were treated with metformin, and 24 with metformin and liraglutide, in addition to lifestyle modifications. Data collected included: body weight, waist circumference, fasting plasma glucose (FPG), Glycated Hemoglobin (HbA1c), glucose tolerance test (GTT), fasting insulin level (FIL), blood pressure (BP), serum lipids and any side effects. The changes of these parameters were compared between groups at three time points: first visit, and 3 and 6 months later.
Results: The liraglutide/metformin group displayed significant weight loss, loss of the abdominal fat, improvements in FPG, HbA1c levels, systolic and diastolic BP and rise of High Density Lipoprotein (HDL). More importantly, 91.6% of the evaluable prediabetics treated with liraglutide/ metformin returned to normal glucose tolerance state during the six months period. No major side effects were observed, except for mild transient nausea.
Conclusion: These findings suggest that the liraglutide, combined with metformin and lifestyle intervention, could be a promising intervention to reverse PD and stop its progression. Validation of our data in a prospective, randomized design would be greatly anticipated.
Keywords
• Insulin resistance
• Pre-diabetes
• Type 2 Diabetes
• HbA1c. Glucagon-like peptide-1
Citation
Sara S, Tarek W, Elizabeth AJ (2018) GLP-1 Agonist Liraglutide and Metformin Combination may Reverse Prediabetes. J Endocrinol Diabetes Obes 6(1): 1113.
ABBREVIATIONS
IR: Insulin Resistance; PD: Pre-Diabetes; T2D: Type 2 diabetes; HbA1c: Glycated Hemoglobin; GLP-1: Glucagon Like Peptide-1; NGT: Normal Glucose Tolerance; M: Metformin; L+M: Lyraglutide and Metformin Combination; FPG: Fasting Plasma Glucose; GTT: Glucose Tolerance Test
INTRODUCTION
Diabetes Mellitus, with its rapidly rising incidence is projected to afflict at least 8% of the world population in 2030. As the incidence of obesity is reaching epidemic proportions, T2D and its precursor PD are becoming more serious public health problems with a staggering annual cost estimated at 245 billion dollars in the United States alone [1-6]. What makes the burden heavier and the impact more painful is the array of disabling complications affecting almost every organ and impacting the quality of life into a rapid decline [6,7].
PD is a state of insulin resistance, characterized by higher than normal blood glucose levels, that precedes and plays a pivotal role in the development of T2DM. Both insulin resistance (IR) and β-cell failure are strong predictors of future T2DM development. Weight loss and lifestyle changes to prevent or delay the progression to diabetes turned out to be a very difficult task to achieve than was perceived [8-11].
As defined by the ADA, PD is a fasting plasma glucose (FPG) of at least 100 mg/dl (5.6 mmol/liter) but less than 126 mg/dl (7.0 mmol/liter), which is frequently termed IFG, or an abnormal 2h response to a 75-g oral GTT of at least 140 mg/dl (7.8 mmol/ liter) and less than 200 mg/dl (11.1 mmol/liter), or with HbA1c values of 5.7–6.4%. [7,12] .
By the time overt diabetes develops, approximately 80% of the β-cell function is lost. Here comes the importance of an early intervention before the onset of T2D. Because of these facts, once T2D is fully diagnosed, it may be too late to treat the basic pathobiology and reverse the disease. We spend all our efforts indeed treating the consequences. Innovative therapeutic interventions in this field would be much more fruitful if reversing PD becomes the primary target of our therapy [11]. The pathophysiology of PD includes alterations in insulin sensitivity, reduced hepatic insulin sensitivity, β-cell dysfunction and/or chronic low β-cell mass, altered GLP-1 secretion and inappropriately elevated glucagon secretion. [11,13-17].
Liraglutide 3.0 mg per day is currently approved by the Federal Drug Administration (FDA) for weight management. Clinical trials showed that liraglutide 3.0 mg is significantly more effective than orlistat, diet and exercise alone, reducing weight in a dose dependent way over 20 and 52 weeks resulting in HbA1c reduction that is proportional to weight loss. A mean loss of 35.6% of the excess body weight (not total weight) was shown in 356 obese individuals taking 3.0 mg of liraglutide daily for 52 weeks. This study also proved weight-loss maintenance at 56 weeks in overweight and obese individuals compared to subjects treated with diet alone. In this trial, liraglutide induced additional reductions in waist circumference, FPG, Systolic BP (SBP) and C-reactive Protein (CRP) resulting in clear cardiovascular risk reduction [3, 18-25] .
The average weight loss for liraglutide at 56 weeks was 8.0% compared to 2.6% for the placebo group; and statistically significant improvements in BP, cardiovascular risk biomarkers, lipids and patient-reported quality of life (QoL); 61% had PD at randomization, and at 56 weeks, 69% of the PD subgroup treated with liraglutide no longer met the definition of PD [26,27].
GLP-1 receptor agonists (RA) enhance the endogenous secretion of insulin and help weight management by delaying gastric emptying resulting in appetite suppression. Consequently, the lipid profile, BP, IR, the inflammatory status and cardiac risks improve [5,8,18,28,29]. The weight loss is greater in patients with higher BMI. The average weight loss is about 4.4 kg greater than placebo and may reach 7.2 kg [25,30-32].
Similarly, in 2012, Astrup et al., showed that 52–62% of individuals with PD at randomization achieved reversal to normal at year 2. In another study on 176 obese PD subjects, reversal of PD to normal state was reported in 96% of subjects after 20 weeks of treatment with liraglutide [18,33].
Because most current therapeutic options address the impaired glucose action or stimulate insulin secretion rather than the declining β-cell function, failure of most anti-diabetic therapies ultimately ensues. Liraglutide and exenatide, the other GLP-1- RA, were the only medications shown to increase β-cell mass, stimulate β-cell proliferation and neogenesis and inhibit their apoptosis. [3,8,11,18,20,28,32,34,35]
Liraglutide is generally well tolerated. The most common adverse effects (≥10%) associated with liraglutide include hypoglycemia, headache, nausea, diarrhea and vomiting. The gastrointestinal disorders which occur in 20–30% of individuals, are usually mild and transient, increase with dose and decrease over time [9,21-24,28,29,35-37].
Accordingly, the objective of our study is to find out if incretinbased therapies, such as the GLP-1-RA liraglutide can effectively help to mitigate the progression of PD, and whether combining it with metformin may offer a safe novel approach to reverse PD and IR. The reason to believe this is a winning combination is the complimentarily of their mechanisms: metformin reduces sugar production while liraglutide improves insulin production and the beta cell function. Consequently, we ask whether the combination may help improve the elements of the metabolic syndrome defining PD.
MATERIAL AND METHODS
This is a retrospective study, conducted in two healthcare centers between June 2009 and March 2013. Data were extracted from the patients’ files. The inclusion criteria included nondiabetic men and women aged 18–65 years with body mass index ≥ 25 kg/m2 (overweight or obese subjects), taking metformin with or without Liraglutide. The subjects had to meet the ADA PD diagnosis criteria defined as: FPG between 100– 126 mg/dl, or 2 hour OGTT between 140 mg/dl – 200 mg/dl, or HbA1c values of 5.7–6.4%. The exclusion criteria included: diagnosis of type 1 or type 2 diabetes mellitus, BMI < 25 kg/m2 , age < 18 years or > 65 years, pregnant or lactating women, patients on corticosteroid therapy, having Cushing syndrome, impaired renal or liver functions, or with any cancer.
The study protocol was reviewed and approved by the Ethical Committee of the Faculty of agricultural and food sciences – USEK, and all participants provided informed consent.
The quantitative data were collected at 3 time points: T0 , at the first consultation, T3 , 3 months later and T6 , 6 months after treatment start. Gender, age and habitat were recorded as demographic characteristics.
The anthropometric measurements collected were height (cm), body weight (Kg) and BMI (Kg/m2 ), the waist circumference (cm) along with lifestyle modifications included physical activities.
T0, T3 and T6, follow up visits and laboratory tests were reviewed to collect data on side effects, causes of the drug discontinuation, FPG, OGTT, HbA1c, fasting insulin level, lipid profile (total cholesterol, HDL-C, LDL-C and TG), and blood pressures. The changes from T0 to T3 and T6 were studied using statistical parameters for each group.
STATISTICAL ANALYSIS
SPSS 22.0 software was used for statistical analysis. Sample characteristics and numerical data were summarized using means, standard deviations and percentages. General effects and comparisons between both groups were performed using one way ANOVA for continuous data. A two-tailed Pearson test was performed for correlation analysis between the variables. P< 0.05 was considered statistically significant.
Changes in weight loss, percentage of weight loss, waist circumference, BMI, FPG, HbA1c, total cholesterol, LDL-C, HDL-C, TG, SBP and DBP between groups and at T3 and T6 were analyzed using the one-way ANOVA test. ANOVA test was also used to determine if the weight loss was affected by physical activity and by the degree of diet commitment, and by nausea. Finally,
RESULTS
More than 1800 medical records were reviewed, only 79 subjects met the inclusion and exclusion criteria and were included in the study: 55 subjects were treated with metformin, and 24 subjects with metformin and liraglutide. All subjects were given a weight loss diet with recommendations for physical activity.
The dose of metformin was comparable in both groups with 1500 mg per day. Subjects treated with liraglutide started with the minimal dose of 0.6 mg by subcutaneous injections per day for the first week, 1.2 mg for the second, and 1.8 mg daily starting with the third week.
Patient baseline characteristics and laboratory data are shown in Table 1.
Table 1: Baseline characteristics between the 2 groups.
| Metformin | Metformin + Liraglutide | P Value | |||
| N | Mean | N | Mean | ||
| Age (years) | 55 | 38.87 | 24 | 39.25 | 0.896 |
| Waist (cm) | 55 | 108.8 | 24 | 108.9 | 0.723 |
| Weight (kg) | 55 | 98.7 | 24 | 97.9 | 0.298 |
| BMI (Kg/cm2) | 55 | 34 | 24 | 34.2 | 0.277 |
| FPG (mg/dl) | 55 | 102.02 | 24 | 106.04 | 0.117 |
| OGTT (mg/dl) | 15 | 148.27 | 3 | 156.67 | 0.471 |
| HbA1c (%) | 51 | 5.62 | 24 | 5.75 | 0.228 |
| Fasting insulin (mIU/L) | 48 | 17.35 | 23 | 21.73 | 0.523 |
| Total cholesterol (mg/dl) | 55 | 207.58 | 24 | 199.96 | 0.465 |
| LDL-C (mg/dl) | 55 | 130.60 | 24 | 122.41 | 0.381 |
| HDL-C (mg/dl) | 55 | 42.95 | 24 | 42.47 | 0.846 |
| Triglycerides (mg/dl) | 55 | 177.36 | 24 | 168.21 | 0.618 |
| SBP (mmHg) | 55 | 121.36 | 24 | 120.42 | 0.754 |
| DBP (mmHg) | 55 | 78.42 | 24 | 78.75 | 0.873 |
There were no significant differences in any of the demographic characteristics: gender, age, initial body weight, FPG, OGTT, Fasting insulin, HbA1C, and the lipid profile between the 2 groups.
All patients were following the weight loss diet, with > 50% commitment in 94.5% and 95.8%, for the metformin and metformin + liraglutide groups respectively. Only 58.2% of the subjects treated with metformin and 70.8% of subjects in the metformin + liraglutide group were practicing a regular physical activity; thus, slightly favoring the liraglutide group.
Patients treated with metformin had lost a mean 6.6 Kg in the first three months compared with 8.6 Kg for the metformin + liraglutide group; this difference was significant (p=0.028). The overall mean weight lost over 6 months was significantly different between the groups: 10.8 Kg for the metformin group (N=43) and 15.6 Kg for patients treated with metformin + liraglutide (N=15) (p=0.008). The percentage of weight loss during the six months period was significantly greater in the liraglutide group (14.9%; p=0.011) (Table 2).
Table 2: The difference in weight loss after 3 and 6 months of treatment in both groups.
| N | Mean | Minimum | Maximum | P value | ||
| Percentage of weight loss after three months | Metformin | 55 | 6.802 | -1.0 | 18.4 | 0.000 |
| Metformin + Liraglutide | 24 | 8.610 | 2.8 | 14.2 | ||
| Total | 79 | 7.351 | -1.0 | 18.4 | ||
| Percentage of weight loss 0.000 after six months | Metformin | 43 | 11.031 | -3.6 | 25.2 | 0.000 |
| Metformin + Liraglutide | 15 | 14.919 | 5.1 | 20.1 | ||
| Total | 58 | 12.037 | -3.6 | 25.2 |
In parallel, the waist circumference measurement, which is an indicator of central obesity, decreased during the six months by 10.3 cm in the metformin group and 16.9 cm in the metformin + liraglutide group (Figure 1), the difference between groups was very significant (p=0.000).
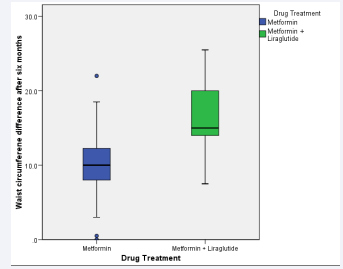
Figure 1: The differences in waist circumference (cm) after six months of treatment.
Moreover, there was a significant large positive correlation between weight loss and the decrease in waist circumference after six months (N=58; r =0.773) (Figure 2).
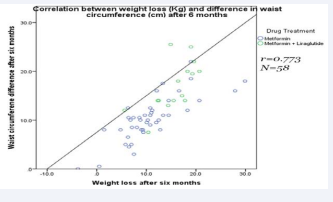
Figure 2: Scatter plot showing the correlation between the change in waist circumference (cm) and the weight loss after six months of treatment.
As a consequence to weight loss, the BMI has decreased in both groups during the first three months by 2.3 kg/m2 in the metformin group and 3.0 kg/m2 in the metformin + liraglutide group (p=0.036); and for the overall six months, the decrease in BMI was 3.8 kg/m2 in the metformin group and 5.4 kg/m2 in the metformin + liraglutide group (Figure 3) (p=0.009).
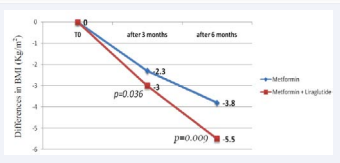
Figure 3: Graph showing the mean differences in BMI (Kg/m2) after three and six months in both groups.
No correlations were found between the initial BMI and the weight loss or the percentage of weight loss in the liraglutide group to the contrary of the metformin group where a large positive correlation between initial BMI and weight loss at both time periods was seen. Fasting plasma glucose decreased on average from 102.2 mg/dl at T0 to 95.73 mg/dl after 3 months and then to 92.88 mg/dl at T6 , in the metformin group. While for the second group, the mean decrease of FPG was more important: from 106.04 mg/dl to 92.52 mg/dl at T3 and to 84.75 mg/dl at (p=0.009).
HbA1c was also decreased, in the metformin group, by 0.17% and 0.21% at T0 -T3 and T0 -T6 time periods, respectively. While in the metformin + liraglutide group the decrease was 0.33% at T0 -T3 and 0.58% during the six months period (P=0.000). This significant decrease did not correlate with the weight loss, unlike the case in the metformin group, where a significant positive correlation was found (Figure 4).
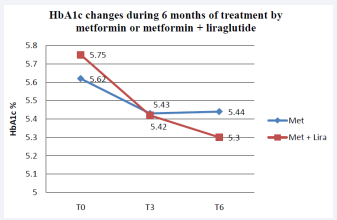
Figure 4: Mean HbA1c (%) in the metformin and metformin + liraglutide groups after 3 and 6 months of treatment
The OGTT test and the fasting insulin tests have not been taken into consideration because of the existence of a lot of missing data. For some patients, data was available at T3 and/or T6 , but not at T0 . The initial mean total cholesterol was 207.5 mg/dl in metformin group and 199.9 mg/dl in the metformin + liraglutide group. For the metformin group a decrease was shown at T3 (180.3 mg/dl; N=53), but no changes at T6 (181.1 mg/dl; N=42); while in patients treated with liraglutide the total cholesterol has decreased over the six months period: 160.8 mg/dl at T3 (N=24) and 147.6 mg/dl at T6 (N=12). Despite the differences existing between both groups, the results were not significant neither at T3 nor at T6 . Similar results were shown for LDL: a decrease in both groups at T3 , while at T6 the decrease was shown only in the metformin + liraglutide group only; the differences between groups were not significant. However, there was a significant difference in the HDL cholesterol changes between groups, with more important increase shown by the liraglutide treatment (Figure 5).
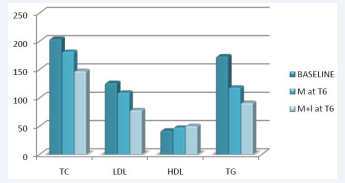
Figure 5: The different in the lipid profile ( in mg/dl) between the 2 groups and baseline at 6 months of treatment
Triglycerides levels decreased in both groups at both time points, but no significant differences were present between groups. The changes of lipid profile parameters in both groups are summarized in Figures 5. A correlation between changes in lipid metabolism parameters and weight loss was also analyzed; significant positive correlations were found in the liraglutide group, only at T3 , between the weight loss and the four parameters: total cholesterol (r=0.449), LDL (r=0.437), HDL (r= - 0.352) and TG (r=0.557). There was also a the positive correlation between the difference in total cholesterol (mg/dl) and the weight loss (kg) after 3 months of treatment in both groups. Positive changes in the blood pressure were shown in the systolic (SBP) and diastolic blood pressure (DBP). There was a significant difference in SBP after six months of treatment between the metformin group and the metformin + liraglutide group (p=0.042) (Figure 6).
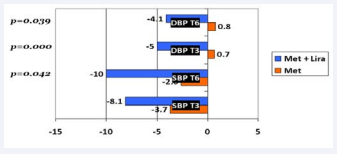
Figure 6: Graph showing the mean changes in systolic blood pressure (SBP) and diastolic blood pressure (DBP) in mmHg in both groups.
The DBP did not change significantly in the metformin group during the six months treatment, it has decreased significantly by 4.17 mmHg in the liraglutide group (p=0.039). There was no correlation between weight loss, at T3 and T6 , and changes seen in the SBP and DBP. Out of the 24 patients treated with liraglutide, 10 patients (41.6%) discontinued the treatment because of the costs. 14 patients (58.3%) have experienced mild transient nausea, with the initiation of the treatment. Seventy-three PD patients had abnormal FPG levels and/or elevated HbA1c at T0 (based on the ADA PD diagnosis criteria). The other six subjects which were diagnosed based on the OGTT test only, were excluded because of the absence of sufficient data at the followup time. Out of these 73 subjects, 42 in the metformin group and 12 in the liraglutide group had sufficient records (FPG and/ or HbA1c) after six months of follow-up and were considered evaluable. In the metformin group, 1 person progressed to T2DM (HbA1c: 6.7%), 26 subjects (61.9%) no longer meet the PD criteria and can be considered to have reverted to normal. Most significantly, 11 subjects or 91.6% in the metformin + liraglutide group reverted to normal (Table 3 and Figure 7).
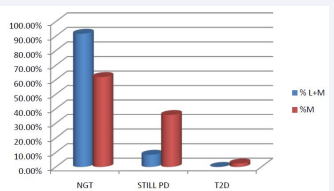
Figure 7: Percentage of subjects on Lyraglutide and Metformin (L+M) or Metformin alone (M) reverting to normal glucose tolerance (NGT) or remaining in PD.
Table 3: Results at 6 months of the persons with enough data showing the numbers and percentages of subjects who reverted to normal Glucose Tolerance (NGT) or who remained in PD.
| CLASSIFICATION AT T6 | Lira + Met | % Lira+Met | Met | %Met |
| NGT | 11 | 91.60% | 26 | 61.90% |
| STILL PD | 1 | 8.40% | 15 | 35.70% |
| T2D | 0 | 0 | 1 | 2.40% |
| NOT ENOUGH DATA | 12 | 13 | ||
| TOTAL | 24 | 100% | 55 | 100% |
DISCUSSION
The results of this study are consistent with the concept that PD is not necessarily an irreversible condition that always leads to T2D. Liraglutide 1.8 mg per day in overweight/obese prediabetics has shown an important positive effect in weight management, a significant reduction of 15% of the total body weight during 6 months could be obtained, with a major loss of abdominal fat, and decrease in waist circumference. BMI improved with no correlation with the initial BMI [30]. Liraglutide also improved glucose homeostasis, particularly lowering the fasting plasma glucose levels by 21.25 mg/dl on the average in 6 months compared to a reduction of 10.29 mg/dl in the metformin group. In Comparison to published data, our results indicate that liraglutide was more effective in lowering Fasting Plasma Glucose (FPG) in IGT subjects [11].
Regarding the HbA1c, the liraglutide 1.8 mg per day has shown a very significant reduction of 0.58% in 6 months independently of weight loss. Niswender et al., (2012) found the drop of HbA1C to be mostly dependent on the amount of weight lost in patients on liraglutide 3.0 mg per day. Zhang et al., (2012) also found this effect with liraglutide 3.0 mg per day in PD expressed as a reduction of HbA1c levels by more than 1% over 26 weeks correlating with a mean weight loss of 2.8 kg [20,25]. Based on FPG and HbA1c, 91.6% of PD subjects treated with liraglutide and metformin reverted to normal glucose tolerance within 6 months (Table 3), compared to 61.9% in the metformin treated group. Diabetes prevention studies have shown that moderate short-term weight loss is associated with long-term reductions in diabetes incidence but some of the improvements we encountered did not always correlate with the amount of weight lost possibly because of our small sample size [3,15].
As it was cited, liraglutide was demonstrated to have cardio protective effect, explained by the amelioration of BP and the lipid profile. For the BP, a significant decrease in both systolic and diastolic blood pressure was observed. Liraglutide had beneficial effects on the lipid profile namely reductions in total cholesterol, LDL-C and triglycerides concentrations and HDL increase. Other studies showed significant increase in HDL-C and decrease in triglycerides. However, and as it was demonstrated in this study, most of these effects have been shown to be related to weight loss rather than a direct effect of liraglutide [8,21,29].
Liraglutide was well tolerated with mild transient nausea that disappeared after dose escalation during the first four weeks.
There has been several attempts at reversing diabetes over the past 100 years. The initial trials focused on lifestyle modifications demonstrating about 50% reduction in T2D in subjects with highrisk. Sartor et al compared subjects with impaired GTT receiving diet or diet and tolbutamine and found that tolbutamine with diet regulation, may prevent or postpone full clinical diabetes (a). In another large study, 3234 nondiabetic persons with high FGT and GTT were treated with either placebo, metformin, or a lifestylemodification program Metformin, and lifestyle changes made the most impact on reducing the incidence of diabetes development compared to placebo. The lifestyle changes were found to be more effective than metformin alone (b,c).
Our findings of weight loss, decreasing the waist circumference and BMI; improving fasting plasma glucose levels, HbA1c, systolic and diastolic blood pressure; increasing HDL-C; and most importantly, reversing PD to a normal state are similar to the findings by several other studies targeting diabetes prevention [38-41]. We show that this PD reversal can be enhanced with certain medications like Liraglutide and metformin along with lifestyle modifications. As the treatments applicable to PD advance, the effectiveness of these preventions become more important. Additional, larger, randomized, controlled trials with long-term follow-up become more critical to determine whether the beneficial effects of liraglutide and metformin in PD overweight/obese subjects are able to stop or at least delay the onset of T2D significantly.
CONCLUSION
By the time T2D is diagnosed, it is usually too late to aim at reversing the toxic effects of hyperglycemia, beta cell dysfunction, and insulin resistance. Interventions to delay or even prevent the development of T2D complications becomes the main objective of therapy. Lifestyle intervention, unfortunately, fail most of the time to stop PD. With the newly introduced GLP-1 agonist therapy, there is significant hope to change the progressive course of diabetes for the better.
The present study, albeit limited by its design and small scale, provides convincing evidence that the GLP-1 agonist liraglutide combined with metformin and lifestyle interventions could be a treatment option in overweight/obese prediabetic patients. Reducing body weight, decreasing abdominal obesity, regulating FPG and HbA1c levels, lowering systolic and diastolic blood pressure independently of the weight loss effect, as well as improving the lipid profile are excellent outcomes in this group of patients. The duration of the weight loss and the improved metabolic profile induced by liraglutide need to be established. In addition, the impact of this treatment on longterm microvascular and macrovascular comorbidities needs to be clarified and established using longer follow up. This study is clearly limited by the small number of subjects enrolled, the retrospective design, and the lack of long term follow up.
We look forward to a prospective, randomized study that may be able to confirm and give new directions in the treatment of PD. Following in the footsteps of several diabetes prevention trials [38-41], the main outcome of our study is perhaps to present a proof of concept leading to active efforts to prevent T2D full development in subjects at risk rather than wait to deal with the dramatic picture of diabetes and its array of complications.
REFERENCES
13. McCulloch D, Robertson P. Prediction and prevention of type 2 diabetes mellitus.
18. Holst J. Incretin hormones and the satiation signal. Int J Obes. 2013; 37: 1161-1168.
21. Gupta V. Pleiotropic effects of incretins. Indian J Endocrinol Metab. 2012; 16: S47-S56.
33. Bloomgarden ZT. Incretin Concepts. Diabetes care. 2010; 33: e20-e25.
34. Cernea S, RAZ I. Therapy in the Early Stage: Incretins. Diabetes Care. 2011; 34: S264-S271.
36. Ross SA, Ekoé, JM. Incretin agents in type 2 diabetes. Canadian Family Physician. 2010; 56: 639-648.


