Impact of a High-Intensity Lifestyle Intervention Program in Patients At-Risk for Diabetes Mellitus Type 2
- 1. Division of Endocrinology, University of Kentucky, USA
- 2. Weight Management Services Corp.99 Summer St, USA
- 3. HMR Weight Management Services Corp. 99 Summer St, USA
Abstract
Background: Lifestyle modification and weight loss are the best ways to prevent type 2 diabetes. The Centers for Disease Control (CDC) has established criteria for Diabetes Prevention Programs (DPP) to help identify programs that have efficacy in diabetes prevention.
Subjects/ Methods: This is a retrospective study that investigated 400 patients (200 patients with pre-diabetes and 200 patients at-risk for type 2 diabetes) who met CDC criteria for entry into a DPP and participated in the Health Management Resources (HMR) clinic-based program for a minimum of 1 year. Changes in body weight, BMI, total cholesterol/HDL ratio, triglycerides, systolic blood pressure, diastolic blood pressure, fasting blood glucose, dietary intake, and average physical activity per week were reported.
Results: Following the HMR program the average FBG was reduced from 107.3 to 95.6 mg/dL in patients with prediabetes. Mean weight loss was 56.1 pounds or 22.2% ideal body weight (IBW) in those with pre-diabetes and 48 pounds or 20.0% of IBW in those at risk for diabetes. Patients at risk for diabetes increased physical activity by a mean of 276 min/wk. 47.3% of all study patients reported eating higher fat foods at baseline compared to only 4.3% of patients at the end of the program.
Conclusions: The HMR program is effective in preventing type 2 diabetes mellitus and fulfills criteria of a CDC DPP.
Keywords
- Prediabetes
- Obesity
- Prevention
- Diabetes
Citation
Adams D, Gotthelf L, Addy C (2018) Impact of a High-Intensity Lifestyle Intervention Program in Patients At-Risk for Diabetes Mellitus Type 2. J Endocrinol Diabetes Obes 6(1): 1114.
ABBREVIATIONS
CDC: Centers for Disease Control; DPP: Diabetes Prevention Programs; HMR: Health Management Resources; HRA: Health Risk Assessment; DPRP: Diabetes Prevention Recognition Program; PA: Physical Activity; PCF: Portion-Control Foods; V/F: Vegetable and Fruit Intake; TC/HDL: Total Cholesterol/High Density Lipoproteins; FBG: Fasting Blood Glucose
INTRODUCTION
In 2014 the CDC estimated that 1 in 3 adults in the United States had prediabetes [1]. It is estimated that every year somewhere between 2-11% of patients with prediabetes will be diagnosed with overt diabetes [2,3].Weight loss and lifestyle modification is the cornerstone of diabetes prevention and has been proven in several large studies including the Finnish Diabetes Prevention Study and the Diabetes Prevention Program [4,5].One study has demonstrated that every kilogram of weight loss results in an approximate 16% risk reduction for developing type 2 diabetes [6]. Despite the proven benefit of lifestyle modification patients often find it difficult to institute significant lifestyle changes especially when most do not have access to any formal training on the components of a healthy lifestyle. Many patients find it helpful to participate in structured programs that provide formal training and have proven efficacy in preventing diabetes in at-risk individuals. The Centers for Disease Control (CDC) has established criteria for Diabetes Prevention Programs (DPP) to help patients and health care providers identify programs that have demonstrated proven success in diabetes prevention [7]. The Health Management Resources (HMR) clinicbased program has been shown to result in significant weight loss and lifestyle changes [8]. However the HMR program has never been evaluated on the basis of prevention of diabetes mellitus type 2. This study investigates the effect of the HMR clinic based program in individuals at-risk for developing type 2 diabetes.
MATERIALS AND METHODS
Study population
Patients were enrolled in an HMR program at one of 66 U.S.-based HMR clinic locations and had completed a health risk assessment (HRA) at baseline and during participation in the weight maintenance phase (phase 2) of the program between 2012 and 2016 (n=2,655). Only patients who had continuous participation between initial and follow-up surveys were included (patients did not report that they had restarted the program and a maximum of 912 days or 2.5 years between initial and follow-up surveys was further set to double check continuous participation). Those with complete biometric data (n=2270) were included and divided into 2 groups based on the CDC DPP eligibility criteria (see below) and analyzed separately. According to CDC Diabetes Prevention Recognition Program (DPRP) requirements, a minimum of 50% of participants must have had a recent blood test indicating they have prediabetes. Therefore, an equal number of participants (n=200) were selected for each group, as described below, and as might occur in an actual DPRP. The study groups were established by including those with the most recent enrollment on a chronological basis until 200 patients was reached. This study was approved by the New England Independent Review Board (NEIRB, Needham, MA, USA) which determined that the study met requirements for a waiver of informed consent based on criteria from 45 CFR 46.116(d).
Inclusion criteria
Patients in group A (patients with prediabetes) had to have a baseline FBG >100 <125 mg/dL, reported no diagnosis of diabetes and no oral diabetes medications or insulin use at baseline, and had a follow-up HRA that was completed > 1 < 2.5 years following the initial HRA.
Patients in group B (those at-risk for diabetes) had to have a baseline FBG 45 years AND BMI >27 kg/ m2 (based on the CDC Prediabetes Screening Test, individuals who receive a score of 9 or greater are at a high risk for diabetes and qualify for a DPP program; the minimum age and BMI included in group B would receive a score of 10 on the Screening Test), reported no diagnosis of diabetes and no oral diabetes medications or insulin use at baseline, and had a follow-up HRA that was completed > 1 < 2.5 years following the initial HRA.
Exclusion criteria
Patients were excluded if they did not have continuous enrollment in the HMR program between time of enrollment and completion of the follow-up HRA, if they did not complete the HRA at follow-up, or if they did not have complete and valid biometric data.
Intervention
HMR clinic-based programs provide intensive behavioralbased intervention to facilitate lifestyle change with the following goals:
1) To increase physical activity (PA),
2)To improve dietary behaviors as achieved by increasing vegetable and fruit intake (V/F) and by following a structured diet (using portion-control foods –PCF – as a tool to maintain portion and calorie control to achieve weight loss and as an optional/ strategic tool, in conjunction with healthy meals comprised of lean proteins, whole grains and V/F, for weight maintenance), and
3)To develop behavioral skills to effectively manage the environment and social situations. The HMR program is based on a behavioral learning model with specific, measurable, and evidence-based treatment variables, enabling participants to keep simple, daily records of these behaviors, which serves to enhance accountability and which serves as the basis for coaching intervention.
HMR programs are offered in clinic-based settings, with faceto-face group coaching. Clinic-based programs provide a range of treatment options ranging from highly restricted diets (e.g., very low calorie and low calorie diets) to less restricted diets (which include V/F), with or without medical supervision, as appropriate.
The HMR program is divided into two phases. Phase 1 (weight loss phase) provides a structured eating plan using PCF to focus on weight loss. Phase 1 also enables participants to begin to learn strategies for changes in diet and physical activity, which will be necessary for long-term weight and health management, as delivered through weekly 75 to 90-minute group coaching sessions. In Phase 1 patients have a goal of achieving >300 minutes/wk of physical activity or >2,000 kcals/wk.
Phase 2 is the weight maintenance phase of HMR programs. Participants move to Phase 2 after having reached their goal weight or when they are ready for less structure in their diet. During Phase 2 participants continue to attend weekly 60-minute coaching sessions, where they learn even more strategies to manage their weight as they face “real world” eating challenges such as socializing, dining out, or traveling. Participants are coached in maintaining physical activity (> 300 minutes/week) and in making healthier eating choices (lean proteins, whole grains, fruits/vegetables), with optional/strategic use of PCF to help with additional weight loss or maintaining weight loss.
Patients participating in clinic programs complete an HRA (The HMR Risk Factor Questionnaire) at the time of enrollment and again during their participation in phase 2. The HRA includes questions on family and personal health, current lifestyle risk factors (physical activity, smoking, alcohol, diet, anger/stress, seat belt use and other lifestyle health factors). Biometric values, including TC/HDL (total cholesterol/high density lipoproteins), triglycerides, blood pressure, fasting blood glucose (FBG), are assessed by laboratory values, and blood pressure, height and weight are assessed by clinic health professionals.
The HRA question pertaining to physical activity assesses moderate, vigorous, very vigorous and non-recreational exercise based on minutes and hours spent in a typical week. Specifically, it asks how much time, in the last 6 months, one has spent in a typical week consistently doing activities of various intensities (examples of activities are provided). The result is a total number of hours of PA which was then reported as minutes. PA was converted into calories using HMR’s Physical Activity Chart, an easy system to estimate calories burned per minute for different types of activities. The system, which is taught to participants, is based on weight, intensity of the activity and the duration of the activity in order to estimate calories per minute.
Dietary intake is assessed by two lists of foods – one lower fat (e.g., vegetables, fruit, bread, fish, poultry, etc.) and the other higher fat foods (e.g., red meat, cheese, pastries, sauces, etc.). Respondents select a choice which describes their food choices in a typical week over the past 6 months – from all/virtually all low fat to all/virtually all high fat – on a 9 point scale. For the analysis, 9 choices were condensed into a 5 point scale by combining categories. Additional dietary questions ask about the number of times in a typical week that fried foods, red meat, and higher fat desserts and snacks are consumed.
Endpoints
Changes from baseline in body weight, body mass index (BMI; kg/m2), biometric indices (total cholesterol/HDL ratio, triglycerides, systolic blood pressure, diastolic blood pressure, fasting blood glucose), physical activity (minutes and kcals/wk) and change in dietary intake as assessed prior to starting the HMR Program (baseline) and during Phase 2 (weight maintenance) were reported.
Analysis
Data were analyzed for group A and group B separately. Changes from baseline to follow-up are reported for weight, BMI, biometric values, PA and dietary intake. Weight change is represented by weight loss in pounds, percent of initial body weight (IBW) lost and BMI change. Change in biometric indices is reported as a percent change. PA is reported both in mean minutes per week and kcals per week and in percent change in minutes per week (Table 1).
Table 1: Baseline and follow-up data on weight, biometric indices, and physical activity.
| Group A (patients with a laboratory diagnosis of pre-diabetes) | Group B (at high risk for developing diabetes) | Overall | |||||||
| Baseline | Follow-up | Change | Baseline | Follow-up | Change | Baseline | Follow-up | Change | |
| Weight, lbs. | 253.3 | 197.2 | -56.1 | 239.7 | 191.7 | -48 | 246.5 | 194.5 | -52 |
| BMI, kg/m2 | 40.3 | 31.4 | -8.9 | 38.7 | 30.9 | -7.8 | 39.5 | 31.2 | -8.3 |
| Systolic blood pressure, mmHg | 131 | 125 | -4.6% | 127 | 120 | -5.5% | 129 | 123 | -4.7% |
| Diastolic blood pressure, mmHg | 80 | 75 | -6% | 79 | 73 | -7.6% | 80 | 74 | -7.5% |
| Total cholesterol/HDL ratio | 4.0 | 3.3 | -17.5% | 3.7 | 3.2 | -13.5% | 3.9 | 3.3 | -15.4% |
| Triglycerides, mg/dL | 170.3 | 112.3 | -34.1% | 126.5 | 100.2 | -20.8% | 148.4 | 106.3 | -28.4% |
| Fasting blood glucose, mg/dL | 107.3 | 95.6 | -10.9% | 89.1 | 89.1 | 0% | 98.2 | 92.4 | -5.9% |
| Physical activity, min/ wk (kcals/wk) | 120 (881) | 402 (2592) | 235% | 138 (930) | 414 (2525) | 200% | 129 (905) | 408 (2559) | 216% |
Changes in dietary intake are reported as changes in the consumption of lower/higher fat food choices, fried foods, red meat and higher fat desserts and snacks (Figures 1-2).
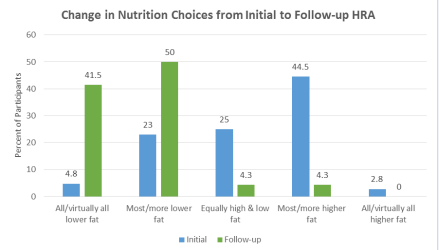
Figure 1 Baseline and follow-up on nutrition choices as reported on HRA.
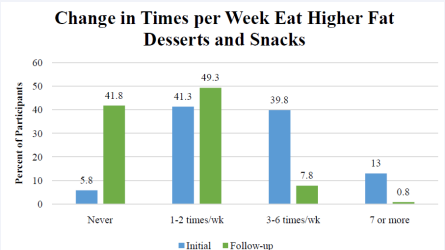
Figure 2 Baseline and follow-up on how many times patients choose higher fat foods per week.
RESULTS AND DISCUSSION
Five hundred seventy-nine (579) patients met the entry criteria for the study – 241 in group A and 338 in Group B. Two hundred (200) patients in each group were included as part of the analysis.
Group A (patients with a laboratory diagnosis of prediabetes): The mean age of study participants at baseline was 57.6 years. 68.5% (n=137) of Group A were women; 31.5% (n=63) were men. The mean percent of initial body weight (IBW) lost was 22.2%. It is particularly worthy to note that the average FBG decreased from the pre-diabetes range (107.3 mg/dL) to below the range for pre-diabetes (95.6 mg/dL). Data in Table 1 are reported as absolute mean changes and percent changes from baseline.
Group B (at-risk for developing diabetes based on the CDC Prediabetes Screening Test): The mean age at baseline was 58 years.79.5% (n=159) of Group B were women and 20.0% (n=41) were men. The mean percent of IBW lost was 19.2%. Data in Table 1 are reported as absolute mean changes and percent changes from baseline.
Participants in the HMR program were also noted to have improvements in several biometric parameters. Total cholesterol was reduced by 15.4% overall. Triglycerides also decreased by 28.4% overall. Both systolic and diastolic blood pressure was reduced slightly, 4.7% and 7.5% overall respectively.
Since there was no difference in the dietary change data for Groups A & B (n=400), these data were combined for analysis. Figure 1 shows the changes in food choices at the follow-up HRA relative to baseline. Responses indicate a shift from eating more high fat foods at baseline to eating more low fat foods during Phase 2 (weight maintenance). The majority of phase 2 patients (91.5%) report eating lower fat foods compared to 27.8% making those food choices at baseline. Nearly half of patients (47.3%) reported eating most/more higher fat foods at baseline compared to only 4.3% of patients in Phase 2. Fifty-three percent (52.8%) of patients reported eating higher fat desserts and snacks >3 times per week at baseline vs. 8.6% of phase 2 patients (Figure 2).
Discussion
The data from this study show that participants in an HMR clinic-based intensive behavioral lifestyle intervention program and who would otherwise have been eligible for participation in a DPRP program, both based on either FBG or the CDC Prediabetes Screening Test (>45 years and BMI>27 kg/m2), exceeded the standards for weight change and minutes per week of physical activity as defined by DPRP criteria.
It is useful to compare the results of this trial to data from the first four years of the National DPP. The average baseline weight for participants in the National DPP was 213.4 pounds compared to an overall average of 246.5 pounds in this study. Data from the National DPP showed that participants on average lost 4.2% of their body weight compared to 21.0% overall in the HMR program. The greater average baseline weight and percentage weight loss in participants in the HMR program may suggest that the HMR program may be better suited for motivated participants who are at higher body weights. One of the most important aspects of any lifestyle intervention program is participation and less than half (48.3%) of participants in the National program remained in the program for more than 6 months. Weight loss heavily correlated to number of sessions attended [9].
Physical activity is a major component of the HMR Program. Participants in HMR programs track their PA daily and submit their PA data to health coaches on a weekly basis, with a goal of achieving >300 minutes of PA or >2,000 kcals/wk. The goal of any lifestyle program should be to maintain those behaviors, including physical activity and nutritional changes as well as weight loss. HMR participants in this retrospective study averaged 129 min/wk at baseline which increased to 408 min/wk during weight maintenance, which exceeds the DPRP standard by 172%. The average physical activity of the HMR is twice as much as the reported physical activity of participants in the National DPP even among those who attended sessions for 12 months [10].
In both Group A and Group B, there were substantial changes in biometric indices after participating in the HMR Program. Of particular note is the mean decrease in FBG in Group A, from 107.3 mg/dL (prediabetes) to 95.6 mg/dL, which is no longer in the prediabetes range. Group B was specifically selected based on age and BMI from the CDC Prediabetes Screening Test and not FBG, which is presumptively why there is no change in FBG in this group. However, it is also important to note that the FBG in Group B stayed below the prediabetes range and did not demonstrate an increase at follow-up, indicating that, on average, these participants did not progress towards prediabetes or diabetes. Other notable changes in biometric indices include a 15.4% reduction in total cholesterol and a 28.4% reduction in triglycerides. Weight loss typically results in a reduced need for lipid lowering medications and antihypertensive agents however this information was not included in the final analysis of this trial.
One major limitation of this study is that it is retrospective and not a prospective, randomized study. Several other studies have demonstrated the efficacy of the HMR program. One randomized trial demonstrated that the HMR clinic-based programs an average weight loss of 8.5% body weight after 18 months of follow-up [11]. The overall average weight loss for the CDC diabetes prevention program was 4.2% [9]. Another retrospective study demonstrated that in patients with severe obesity (BMI ≥ 40) the HMR program resulted in an average weight loss of 19.9% of body weight after 26 in the program [12]. This is an important finding because patients with severe obesity have a greater risk for the development of diabetes and this study supports the fact that the HMR program can cause weight loss and reduce the risk of developing type 2 diabetes.
Another limitation of this study is that it only included patients with continuous participation in the program and excluded patients that withdrew from the program. As the data from the National DPP indicate program participation is likely the most significant predictor of success in any lifestyle intervention program. Finding the program that results in the best participation for each individual is imperative. HMR does other programs including a remote program which utilizes group telephone calls to help facilitate lifestyle changes. Because this study was designed to determine whether the HMR program successfully fulfills criteria for a CDC DPP dropout rate was not evaluated. The HMR program averages an approximate 9% per month dropout rate in phase 1 and 6% dropout rate per month in phase 2. For comparison some studies evaluating lifestyle changes in patients at risk for diabetes have noted a dropout rate as high as 16% at 1 year [13].
CONCLUSIONS
The HMR Program fulfills all the DPRP standards in terms of weight loss, physical activity and nutrition. HMR can be one option for individuals with prediabetes who are seeking a more intensive program for diabetes prevention.
CONFLICT OF INTEREST
This study was primarily conducted and funded by Health Management Resources Weight Management Corporation. There are no other conflicts of interest.


