Accelerator Mass Spectrometry in Study of Tissue-Specific Distribution of Methanol in Mice
- 1. Institute of Molecular Biology, Russia
- 2. Laboratory of radiocarbon methods of analyses, Novosibirsk State University, Russia
- 3. Institute of Catalysis SB RAS, Russia
- 4. Budker Institute of Nuclear Physics, Russia
Abstract
Accelerator mass spectrometry (AMS) is increasingly widely used in biomedical research. This paper presents the very first AMS application to study of 14C labels in different organs in mice at 1,3,10 and 24 hours after intraperitoneal administration of 14C methanol. Kinetics of elimination of methanol and its metabolites from various mouse organs was demonstrated using AMS for the first time. Graphitized samples of liver, kidney, and brain were prepared for AMS by adsorption-catalytic method using a platinum catalyst and calcium oxide as a sorbent. After administration of 14C methanol with a radioactivity of 20 Bq, the concentration of radiocarbon in organs of all tested mice was a few times larger than that one of control mice. After administration of a 20 μl of 14C-labeled methanol, the content of methanol and its metabolites in liver remained consistently high throughout the test time (400-500 mg/kg), whereas this value in brain decreased to 20 mg/kg within 24 hours. The kinetics of elimination of methanol and its metabolites from kidneys was slower as compared with that in brain: down to a level of 100 mg/kg in 24 hours.
KEYWORDS
Accelerator mass spectrometry; 14C methanol; Liver; Brain; Kidneys; Mice.
CITATION
Gulyaeva LF, Pustylnyak VO, Okunev AG, Fedotenko TM, Kalinkin PN, et al. (2016) Accelerator Mass Spectrometry in Study of Tissue-Specific Distribution of Methanol in Mice. J Liver Clin Res 3(1): 1024.
ABBREVIATIONS
AMS: Accelerator Mass Spectrometry; DNA: Deoxyribo Nucleic Acid; BINP: Budker Institute of Nuclear Physics; SB RAS: Siberian Branch of Russian Academy of Sciences
INTRODUCTION
Study of pharmacokinetics of chemical compounds, including drugs and toxins, is an integral part of present-day biomedical research. In most cases, biological effects of chemical compounds depend on the period of substance accumulation in a target organ, as well as its concentration. Therefore, to maximize the therapeutic effect of a drug it is important to maintain its optimal concentration at the site of action. Further, if toxic effects of chemical compounds are studied, knowledge of tissue-specific effects of toxins is also required. In most cases, however, it is rather difficult to determine the drug concentration in tissue, and thus it is the concentration of chemical compounds in blood plasma that is analyzed in pharmacokinetic studies. Therefore, application of state-of-the-art ultra-sensitive analytical methods to assessment of biological effects of chemical compounds remains a topical task. Accelerator mass spectrometry (AMS) is one of these methods. Its sensitivity in determination of concentration of atoms of interest is at the level of 10-15 relative to the main isotope of substance under analysis [1,2]. AMS is most widely used in pharmacology and toxicology, and, more recently, in biochemical studies of DNA adduct formation, the age and time of cell renewal, etc. [3,4]. At the moment, there are quite a number of toxicological studies on methanol due to its high toxicity and in some cases mortality to humans. This alcohol is widely used as a solvent in chemical industry and as a precursor for synthesis of numerous chemical compounds. Moreover, methanol may be found in fake alcohol and cause serious intoxication, sometimes fatal [5,6]. The toxicity of methanol was proved to be associated with formic acid, resulting from methanol oxidation by aldehyde dehydrogenase with following oxidation of the product formaldehyde by aldehyde dehydrogenase [7]. Formic acid inhibits mitochondrial cytochrome oxidase, which leads to hypoxia [8], which is accompanied by development of metabolic acidosis and other clinical symptoms in some tissues of the body [9]. Parameters of methanol pharmacokinetics in humans and experimental animals have been investigated now. target tissues, which are the first to accumulate methanol, have been identified (liver, kidneys, and brain) [8,10,11]. However, no studies on the kinetics of methanol accumulation and elimination in different tissues of animals have been carried out using the ultra-sensitive AMS method. The present work investigates the distribution of 14C labels in various organs of mice after intraperitoneal administration of 14C methanol.
MATERIALS AND METHODS
Animals
The studies were conducted with male CBA mice weighing 23-25 g from the hatchery of the Scientific Research Institute of Clinical Immunology of Siberian Branch of Russian Academy of Medical Sciences. The animals were kept in cages with 12hour illumination and had free access to food and water. Before the experiments, the mice were under 7-day quarantine and acclimatization in a vivarium. The captivity conditions excluded influence of external factors that could affect the results. The air, food, water and littering contained no toxic agents.
A 20 μl of 14C methanol of a radioactivity of 20Bq was administered intraperitoneally to a mouse. At fixed time points (1,3,10, and 24 hours, 5 animals per the point) after administration, the mice were sacrificed by cervical dislocation, and organs to study (liver, kidneys, and brain) were retrieved. Intact mice were used as control animals (4 animals) and the same organs (liver, kidneys, and brain) were retrieved at the same time points. The retrieved organs were frozen in liquid nitrogen and stored at -80?C till preparation of samples for AMS analysis.
Preparation of biological samples for AMS analysis
The mode of preparation of biological samples for AMS analysis shall enable conversion of the starting biomaterial into graphitic form, which significantly increases the effectiveness of AMS analysis. The biological samples were prepared using the setup shown in (Figure 1).
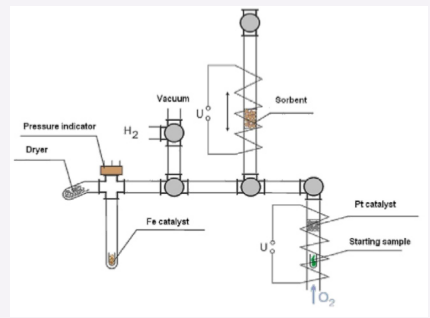
Figure 1 Setup for biological tissue graphitization.
A sample weighing about 20 mg was subjected to oxidation in oxygen flow at 850°C, the combustion products passed additionally through a platinum catalyst. Next, the resulting gas mixture was passed through a quartz capillary with a 1-gram amount of sorbent (calcium oxide) at a temperature of 450°C. Then the system was closed and pumped out using a membrane pump; the sorbent was heated to a temperature of 900°C, and CO2 released by the sorbent was moved into a graphitization tube with a catalyst (6.8 mg of iron powder) by means of freezing in liquid nitrogen. The capillaries were interconnected via one touch fittings (SMC) and Luer-lock valves.
After the gas transfer, the carbon dioxide was thawed; its pressure was measured; the gas was frozen out once more at the bottom of a quartz tube; the tube was filled with hydrogen to an H2:CO2 ratio of 2.5 to 3. The amount of the hydrogen was controlled by the pressure sensor readings. Then the quartz tube was thawed and the total pressure in the system was measured, whereupon the bottom part of the tube was placed in an oven. The water formed during the graphitization was removed using magnesium perchlorate, which was located in a cold zone of the tube. The graphitization kinetics was monitored by the pressure change using Honeywell or MPX 4250 sensors. After completion of the graphitization, the quartz cuvette with iron was taken out and the catalyst was weighed. The carbonized iron powder was pressed into aluminum pistons for further analysis by AMS.
As a result, the carbon weight content in the target samples for AMS analysis was over 85% of its amount in the starting samples.
Accelerator mass spectrometer
The accelerator mass spectrometer was designed, manufactured and put in operation at Budker Institute of Nuclear Physics (BINP) SB RAS [12-14]. The BINP AMS concept involves additional methods of selection and identification of radiocarbon ions [15,16] which increases the precision of AMS analysis in case of unwanted isobaric impurities in samples [17]. As compared with foreign analogs, the BINP AMS is additionally aimed at separation of nitrogen atoms, the mass of which is almost identical to that of radiocarbon, 14 a.m.u. [18].
The instrument was calibrated using carbon fibers, which George S. Burr (USA) also measured on the AMS of Argonne University with a result of 1.1048 ± 0.0019 with respect to the standard dated 1950. The radiocarbon concentration was normalized to that one of modern carbon.
RESULTS AND DISCUSSION
The AMS analytical method is based on the knocking-out, ionization, and extraction of individual atoms from a sample. The resulting ion beams are subjected to numerous procedures of elimination of parasitic ion background in the accelerator mass spectrometer and subsequent single-piece counting of atoms of interest. The content of a rare isotope to detect in the sample can be at a level of 10-15 relative to the main isotope. A typical AMS analysis of 14C labeling requires a carbon amount of about 1 mg in substance sample. The substance that is administered into living systems is marked with radiocarbon labels. Because of the high sensitivity of the AMS, that may be a minimum amount of 14C in and the radiation effect on the body stays at the natural background level. In AMS analysis, one measures the total radiocarbon concentration in the sample, i.e. both the natural one and that introduced by the radiocarbon labels. Therefore, the concentration of radiocarbon labels is determined by subtraction of the natural concentration from the measured one. It should be noted that variation of natural radiocarbon concentration in living systems does not exceed a value of a few percent, which is determined by fractionation of biochemical processes. Biological samples for AMS analysis shall meet certain requirements [19]. One of the most important requirements is the purity of sample manufacturing (the radiocarbon contamination level). Natural radioactive isotopes in the atmospheric air may get into the sample during graphitization because of the residual pressure in the reactor, incomplete sealing of the reactor etc. Besides, there may be radiocarbon in the catalyst, chemical agents, or equipment used for graphitization. So, we graphitized 5 samples of fine-grain high-density graphite with a radiocarbon content of about 0.2 % of that in living organisms.
The results of measurements of radiocarbon concentration in the samples are shown in Figure (2).
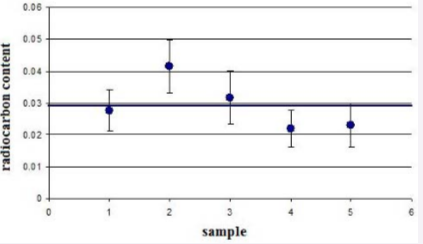
Figure 2 Tests of purity for 5 samples of high density graphite.
From the results it is evident that the value of contamination got in graphitization is approximately 3%, which well meets the requirements to graphitization purity. Current of carbon negative ions, formed during the sputtering of the sample material in the ion source of the AMS, from carbon fiber without graphitization was a kind of standard for graphitized samples since the fiber consists almost entirely of carbon and has high thermal conductivite and electrical conductivity.
The adsorption-catalytic method was used for graphitization of samples of liver, kidney and brain of laboratory mice – both control animals and those treated with 14C methanol. The measurements were carried out with samples of graphite initially without 14C and samples made from control mice without injection of labeled methanol. Figure (3) shows the results of the measurements of the control samples, from which one can see that within 1 % the 14C content does not change significantly from organ to organ.
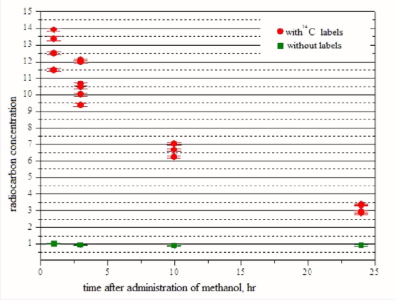
Figure 3 14C content in graphitized samples of liver (1), kidneys (2), blood (3), and brain (4) of the control mice.
Figure (4) shows the radiocarbon concentration in mouse kidneys versus time after intraperitoneal administration of methanol with and without 14C labels, for each individual animal.
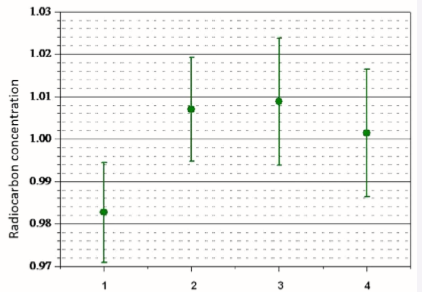
Figure 4 Radiocarbon concentration in mouse kidneys versus time after intraperitoneal administration of methanol with and without 14C labels.
Besides, it presents the statistical error of single-piece counting of radiocarbon atoms in the AMS analysis. One can see that the spread of values for individual animals greatly exceeds the statistical spread of radiocarbon analysis. Radiocarbon concentration after administration of 14C methanol without labels is approximately the same, independent of time and corresponding to the natural one. Radiocarbon concentration afer administration of methanol with 14C labels with a radioactivity of 20 Bq a few times exceeds the normal one throughout the observation period.
The concentration of 14C labels corresponds to difference in radiocarbon concentration in samples with and without the labels. The methanol concentration was found from the known radioactivity of labeled methanol of mass unit. Results of the experiment on determination of concentration of 14C-labeled methanol in different mouse organs are shown in Figure (5).
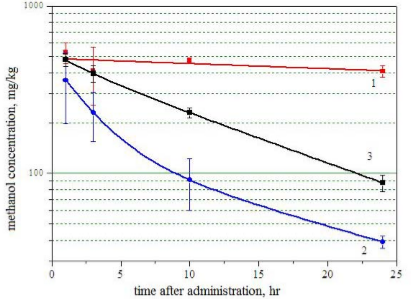
Figure 5 Content of 14C-labeled methanol in different mouse organs versus time after intraperitoneal administration. 1: liver; 2: brain; 3: kidneys..
The error corresponds to spread from animal to animal. Previous studies have shown that methanol, with any mode of administration, reaches its peak concentration in blood within 30-90 min [11]. Relying on this fact, we determined the 14C content in liver, kidneys, and brain at 60 min, 3, 10 and 24 hours after administration of 14C methanol to mice. These results show that the level of 14C-labeled carbon remains high in liver (400-500 mg/kg) throughout the test time, which may reflect accumulation of methanol metabolites with a key role of alcohol dehydrogenase and aldehyde dehydrogenase of liver [7]. It should also be noted that under exposure to methanol, liver is a target organ for formation of adducts with DNA and proteins [20]. Consequently,the consistently high level of radiocarbon in liver may be evidence of such mechanism of toxicity of methanol. Kidneys displayed comparable radiocarbon content at the first measurement (60 min), while the radiocarbon concentration in brain was markedly lower. In brain, the 14C content decreased to 20 mg/kg in 24 hours, whereas in kidneys the amount of the label was about 100 mg/kg. These results correspond to previous data that showed the highest concentration of methanol to be found in liver, then in kidneys, and the least in muscles, adipose tissue and brain [21,22]. One can assume that the low methanol content in brain registered in those papers is associated with sufficiently fast kinetics of its elimination, as shown in our study. It should also be noted that earlier Golovenko et al. also investigated concentration of radioactive products in brain, liver and blood plasma of outbred white mice over an interval of 6 hours after intragastric administration of 14C methanol [11]. Golovenko et al., demonstrated very small difference in the methanol pharmacokinetic profiles for brain and liver and associated this fact with rapid metabolism of methanol to formaldehyde and formic acid, which are in turn involved in the metabolism of endogenous substances and thus are excreted from the body more slowly. Our results are in agreement with the kinetics for liver, but not for brain. This discrepancy may be due to the different methods of administration of methanol into experimental animals.
CONCLUSION
The obtained results not only provide ideas of the kinetics of methanol elimination and its metabolites from different mouse organs, but they also demonstrate that the AMS method can be applied to research in the field of toxicology and pharmacology. It should be noted that AMS analysis relies on registration of introduced radiocarbon labels, no matter how large the drug dose is. Thus one can use the AMS method for research with drug doses orders of magnitude less than the limits of sensitivity of other methods.
ACKNOWLEDGEMENTS
Inessa Voronova is acknowledged for the participation in some biological experiments.


