Electrochemical Determination of Uric Acid using Nano Resin Modified Carbon Paste Electrode as a New Sensor
- 1. Analytical Research Laboratory, Department of Chemistry, University of Sistan and Baluchestan, Zahedan, Iran
ABSTRACT
A fast, simple and sensitive uric acid sensor was prepared by nano resin. The modi?ed electrode offers a considerable improvement in voltammetric sensitivity toward uric acid, compared to the bare electrode. Lewatit FO36 nano resin is a macroporous, mono dispersed, weakly basic, polystyrene-based resinwith graphite powderas new modi?ed carbon paste electrode (CPE/LFONR) was used for the electroanalytical determination of uric acid (UA) in real samples. The variation of peak current with pH and scan rate, were optimized. The electron transfer coef?cient and diffusion coef?cient of UA at the modi?ed electrode were calculated. The electrochemical behavior of UA at CPE/LFONR was studied by cyclic voltammetry (CV), linear sweep voltammetry (LSV), Chronoamperometry (CA) and Chronocoulometry (CC). Under the optimum conditions (pH and scan rate), a linear dependence of the uric acid oxidation signals was observed to concentration in the ranges of 0.3-3.1 µmol L-1 and 3.1- 32.0 µmol L-1 with a detection limit (3s) of 0.176 µmol L-1 at pH 6.0. Using chronoamperometry and Chronocoulometry, diffusion coef?cient was calculated 3.70 × 10⁻⁶ and 5.91 × 10⁻⁶ cm2/s respectively. The results indicate that the proposed method is highly sensitive for uric acid detection in real samples such as human urine and human blood serum.
KEYWORDS
Modified carbon paste electrode, Linear sweep voltammetry, Lewatit FO36 nano resin, Uric acid
CITATION
Rajabi H, Noroozifar M, Sabbaghi N (2017) Electrochemical Determination of Uric Acid using Nano Resin Modified Carbon Paste Electrode as a New Sensor. J Mater Appl Sci 1(1): 1002.
INTRODUCTION
One of the basic nitrogenous compound in urine and the product of purine metabolism in the human body is uric acid [2,6,8-trihydroxypurine]. Uric acid is biomedical important that plays determining roles in human metabolism, in the central nervous and renal systems [1-4]. Level of abnormal UA in a human body could be caused by several illnesses such as hyperuricemia, gout, Lesch–Nyan syndrome, as well as cardiovascular and chronic renal sickness. A lot of methods such as enzymatic method [5], high performance liquid chromatography [6] and so on for the determination of UA were used.
Although, these methods have some disadvantages, such as the complex operating process, strict pre-disposal and expensive instruments. The electrochemical procedures have been widely investigated in the determination of biologically important molecules and drugs in recent years because of their simplicity, easy of miniaturization, high sensitivity and relatively inexpensive as compared to conventional spectrophotometric and colorimetry methods [7-11]. The many electrochemical methods are available for the determination of trace amount of UA [12-16].
Many effort had been done to fabrication of amperometric biosensors for determination of uric acid with various modified electrodes such as Pt electrode which was deposited with polyaniline [17], modified carbon electrode with Ir [18], polypyrrole film on Pt surface [19], glassy carbon (GC) modified with electrode ZnO nano rods [20], polyaniline deposited on indium tin oxide (ITO)-coated glass plate [21], polyaniline and polypyrrole [22], and polyaniline/carboxylated multiwalled carbon nanotubes (c-MWCNTs) deposited on ITO-coated glass plate [23-24].
As we know, one of most important modified electrode is Zeolite modified electrode (ZMEs) for different fields of electrochemistry [25-33]. Lewatit FO36 nano resin (LFONR) is a macroporous, monodispersed, weakly basic, polystyrene-based ion exchange resin for the selective adsorption of oxoanions, such as arsenate or arsenite ions (Shape 1).
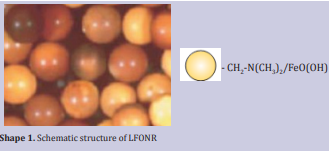
Shape 1. Schematic structure of LFON
The rigid macro pores of the LFONR are filled with iron oxide particles and the iron oxide is distributed in a layer with a few nanometers thick. The combination of the ion exchange resin and iron nanooxide is termed a hybrid system. The “hybrid“ nature of Lewatit FO36 nano resin is unique. It is doped with a nano-scale film of iron oxide covering the inner surfaces of the pores of the polymer bead. LFONR has a content of approximately 15 % iron measured on dry weight base. Sorbents based on hydrated ferric hydroxide such as LFONR and natrolite zeolite–iron oxyhydroxide system [34] are primarily used just for anions such as arsenic [35-37], phosphate, chromate, and cations removal such as Cu, and Pb [38-41] from waters and wastewaters. There are a few reports on the using ion exchangers “resin” for preparation of modified electrode. For example, determination of adrenaline [42] and ascorbic acid [43] using anion-exchange resin with triiodide carbon paste electrode and copper (II) phosphate immobilized in a polyester resin, respectively.
In our previous work, we have demonstrated the ability of silver hexacyanoferrate [44,45], natrolite zeolite–iron oxyhydroxide [25] as modifire with iron compounds for determination some of biological compounds and toxic materials. Herein, we presented, for the first time, a Lewatit FO36 (nano resin) modified carbon paste electrode (CPE/LFONR). It is a weakly basic ion exchange resin which is doped with a nano-scaled film of iron oxide covering the inner surfaces of the pores of the polymer bead.
The fabrication of electrode was easy to and it showed excellent electrochemical properties. A rapid and sensitive response towards UA oxidation was exhibited by the modified sensor. The detection performance for UA was examined by linear sweep voltammetry, also an analysis of UA in real samples of human serum and urine carried out.
MATERIALS AND METHODS
Material and reagent chemicals
Uric acid, sodium hydroxide and phosphoric acid with analytical grade were purchased from Merck (Darmstadt, Germany) unless otherwise stated. Lewatit FO36 nano resin was supplied from LANXESS (Deutschland GmbH, Germany). Graphite powder and paraffin oil (DC = 350, density = 0.88 g/ cm3 ) as binding agents (both from Merck) were used to prepare pastes. All solutions were freshly prepared with double-distilled water. Fresh urine and serum samples were obtained from the Omid Clinical Laboratory (Zahedan, Iran). All experiments were performed under nitrogen atmosphere at room temperature.
Apparatus
LSV, CV, CA and CC experiments were carried out using an SAMA 500 Electroanalyser (SAMA Research Center, Iran) controlled by a personal computer. All electrochemical studies were performed with a three-electrode assembly included a 50mL glass cell, a saturated calomel electrode as reference electrode, a platinum counter electrode, and the working electrode was CPE/ LFONR or carbon paste electrode (CPE). A pH-meter (Metrohm model 744) with a double junction glass electrode was used to check the pH of the solutions. Transmission electron microscopy (TEM) images were taken using a Philips CM120 transmission electron microscopy with 2.5 ?A resolution.
Preparation of the modified electrode
CPE/LFONR was prepared by mixing Lewatit FO36 nano resin (0.04 g) and hand mixing with 96 times its weight of graphite powder using a mortar and pestle. Paraffin oil (~ 0.4 mL) was added and the mixture was ground for 20 min until a uniform paste was obtained. The paste was packed into the end of a glass tube with an internal diameter of 3.0 mm and length of 10 cm. A copper wire was inserted into the carbon paste as an electrical contact. When necessary, a new surface was obtained by pushing some of the paste out of the tube and polishing the end with weighing paper. Also, unmodified CPE was prepared in the same way without adding Lewatit FO36 nano resin to the mixture. Unmodified CPEs were used for the purpose of comparison.
Preparation of real sample and other solutions
Fresh urine and blood serum samples were obtained from the Omid Clinical Laboratory (Zahedan, Iran) without any pretreatments. Samples of urine and blood serum were stored in a refrigerator immediately after collection. 10 mL of each sample was centrifuged for 20 min at 2000 rpm. The supernatant was filtered using a 0.45-μm filter and then diluted ten times with PBS (pH 6.0). The solution was transferred into the voltammetric cell to be analyzed without any further pretreatment. For the determination of recovery of UA in samples of urine and blood serum was used spiking method. 1 mL of the UA stock solution (0.01 M) was diluted to 10 mL with phosphate buffer, then a 100 µL portion of the solution was diluted in a voltammetric cell to 10 mL of 0.1 M phosphate buffer (pH 6.0). Phosphate buffer solutions with different pH were prepared from concentrated phosphoric acid (density 1.71 g/cm3 , Purity 85%) which were adjusted pH by 0.1 M of NaOH with pH-meter. Also, UA stock solutions, from specified amount of UA powder (assay ≥99%) in water distilled twice were prepared [46].
RESULTS AND DISCUSSION
Transmission electron microscopy (TEM) characterization
Fig. 1 shows TEM images for LFONR. The TEM images show the elliptic geometry of the LFONR granules with particles size bigger than 100 nm, because of resin swelling in aqueous environment.
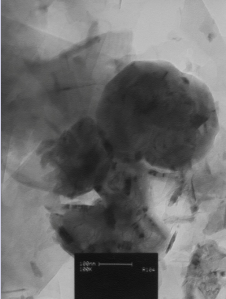
Figure 1. TEM image of CPE/LFONR
Electro oxidation of UA at bare and modified CPE/LFONR
In the present work, we examined the enhanced electrochemical responses of UA at CPE/LFONR. Fig. 2 showed typical cyclic voltammograms of different electrodes in a buffer solution (pH 6.0) with a scan rate of 25 mV s-1.
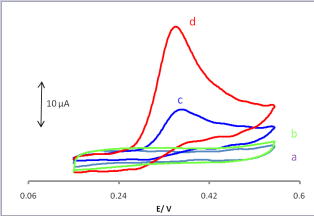
Figure 2. Cyclic voltammograms of (a) carbon paste electrode and (b) Lewatit FO36 nano resin modified carbon paste electrode in 0.1M phosphate buffer (pH 6.0) at the scan rate of 25 mVs−1 without of uric acid; (c,d) as (a,b) in presence 0.05 mM of uric acid.
Voltammetric responses of CPE and CPE/LFONR in absence were shown Fig.2a and 2b. In case of solution containing UA, an electrochemical signal of UA was obtained with the oxidation peak current (Ipa) of 5.9 μA (Fig. 2c) for bare CPE. On the other hand, at CPE/LFONR, the oxidation peak current (Ipa) was obtained at 16.1 μA (Fig. 2, curve d). On the surface of CPE/LFONR, the oxidation peak appeared the peak current with 16.1 μA (Fig. 2, curve d), which indicated that the presence of Lewatit FO36 resin (nano resin) in the CPE could enhance the peak current. The advantages of CPE/ LFONR had been elucidated with fast electron transfer rate of Lewatit FO36 nano resin. The oxidation peak current increased the oxidation peak current increased to 16.1 μA.
According to FeIII /FeII redox pair in structure of LFONR we drown following electrochemical mechanism:
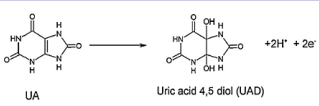
Here, UA was chemically oxidized to uric acid 4,5 diol, at the electrode surface (Scheme 1).
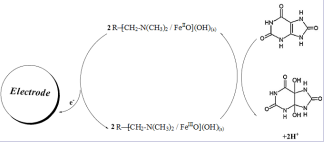
Scheme 1. Electrocatalytic mechanism for the electrooxidation of UA at the surface of CPE/LFONR
The microscopic areas of the CPE and the CPE/LFOR were obtained by CV using 1 mM K3 Fe(CN)6 as a probe at different scan rates. For a reversible process, the Randles–Sevcik equation can be used:
where ipa refers to the anodic peak current, n is the electron transfer number, A is the surface area of the electrode, DR is the diffusion coefficient, C0 is the concentration of K3 Fe(CN)6 and ν is the scan rate. For 1 mM K3 Fe(CN)6 in the 0.1 M KCl electrolyte, n3/2 1 and DR 1/2 7.6 × 10⁶ cms-1; the microscopic areas were calculated from the slope of the ipa - v1/2 relation. In bare CPE, the electrode surface was found to be 0.071 cm2 , and for CPE/LFOR the surface was 0.334 cm2 (nearly 4.7 times greater than that of CPE) [47,48].
Effect of pH on the oxidation of UA at CPE/LFONR
The effect of solution pH on electrochemical responses of UA at the surface of CPE/LFONR was investigated over a pH range of 2.0 to 8.0 using cyclic voltammetry (Fig. 3).
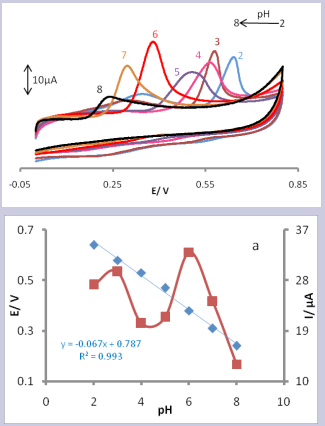
Figure 3. CVs of CPE/LFONR in presence 0.1mM UA (at 25 mV/s-1) at various buffered pHs. The numbers 2-8 correspond to 2, 3, 4, 5, 6, 7, and 8 pHs, respectively. Inset (a) shows the dependence of anodic peak currents and anodic peak potentials with pH for UA.
The results showed that the peak current reached to a maximum value at pH 6.0 (Fig. 3, Inset a). This pH value was selected for further experiments. The results also showed a linear negative shift for the variation of the anodic peak potential of UA with increasing the solution pH (from 2.0 to 8.0) with a slope of -67 mV/pH unit (Fig. 3, Inset a), which indicates that the total numbers of electrons and protons taking part in the charge transfer were the same for UA. According to the above results, the electro-oxidation reaction of UA at CPE/ LFONR can be expressed in Scheme 2 [15].
Sheme 2. The mechanism for electrooxidation of UA at a surface of electrode
Effect of scan rate
The effect of the potential scan rate (ν) on the peak current (Ip ) with 2 mM UA at pH 6.0 was studied in the range of 10-550 mV/s at the CPE/LFONR. As can be seen in Fig. 4,
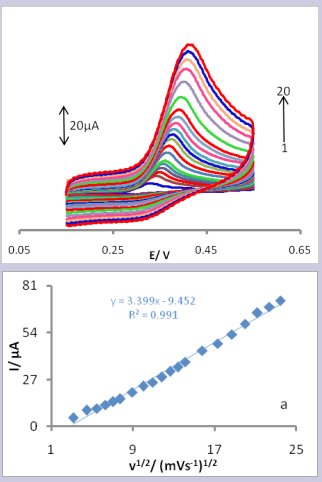
Figure 4. Cyclic voltammograms of the CPE/LFONR in the presence of 0.1mM UA and pH 6.0 at various scan rates; 10, 20, 30, 40, 50, 60, 80, 100, 120, 140, 160, 180, 200, 250, 300, 350, 400, 450, 500 and 550 mVs-1 (1 to 20). Inset (a): Variation of the anodic peak currents versus ν1/2.
the CVs showed a positive shift in Ep, which confirmed the kinetic limitation of the electrochemical reaction. On the other hand, the linear relationship between the peak current and square root of the scan rate (ν1/2) for the following equation confirmed a diffusion controlled process for the electro-oxidation of UA on the surface of the CPE/LFONR in the range of the potential sweep rates used (Fig. 4, curve a). Tafel plot is drawn from the data of the rising part of the current-voltage curve recorded at a scan rate of 20 mV/s. This part of the voltammogram, known as the Tafel region, is affected by electron transfer kinetics between the substrate (UA) and surface confined CPE/LFONR since it can be assumed that the deprotonation of the substrate is a sufficiently fast step. The slope of the Tafel plot, which is equal to 2.3RT/n(1−α)F, was 0.084 V/decade [49-51]. This gave α = 0.30 [52]. In addition, the value of αnα (nα is the number of electrons involved in the rate determining step) was calculated for the oxidation of UA at pH 6.0 for both the modified and unmodified carbon paste electrodes using the following equation [53].
where Ep/2 is the potential corresponding to Ip/2. The values for αnα were 0.30 and 0.12 for the CPE/LFONR and the CPE, respectively.
Using the slope of plot in Fig. 4, curve a and according to Eq. (2) for a totally irreversible diffusion-controlled process [54] and considering the related diffusion coefficient (DUA = 3.7 × 10⁻⁶ cm2 /s, obtained by chronoamperometry in the next section) and electron transfer coefficient (αUA = 0.30 obtained from Tafel plots as described below) for UA, it is estimated that the total number of electrons (n) in the anodic oxidation of UA is 1.85 ? 2.0.
We also calculated the standard heterogeneous rate constant (ks ) value for UA oxidation at CPE and CPE/LFONR using the Velasco equation [55]:
where D is the apparent diffusion coefficient, Ep is the oxidation peak potential, Ep/2 is the half-wave oxidation peak potential, and ν is the scan rate. The D value was determined using the Cottrell slope obtained by the single potential chronoamperometry technique. D values of 3.7 × 10⁻⁶ and 1.9 × 10⁻⁷ cm2 /s were obtained for UA at CPE/LFONR and CPE, respectively. The estimated ks values for the oxidation of UA at CPE/LFONR and CPE were found to be 3.08 × 10⁻³ and 1.36 × 10⁻⁴ cm/s, respectively. The higher ks value obtained for UA at CPE/ LFONR indicates that the oxidation of UA was faster at CPE/ LFONR than at graphite paste electrode.
Chronoamperometric and chronocoulometric study
Chronoamperometry was employed to investigate the electrochemical behavior of an aqueous buffered solution (pH 6.0) containing various concentrations of UA at CPE/LFONR by setting the working electrode potential at 0.45V vs. Hg/ Hg2 Cl2 /KCl sat (Fig. 5a).
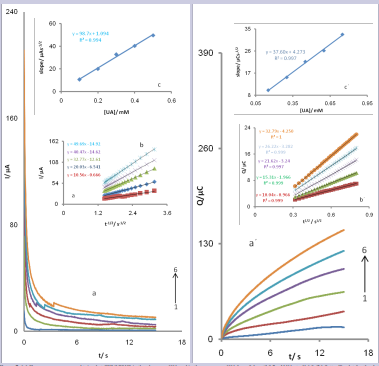
Figure 5. (a) Chronoamperograms obtained at CPE/LFONR in the absence of UA and in the presence of UA from 0.1 until 0.5 mM UA at pH 6.0, (b) Cottrell’s plot for the data from the chronoamperograms, (c) plot of the straight lines against the UA concentration (a´) Chronocoulometric response of the modified CPE/LFONR in 0.1M phosphate buffer solution (pH 6.0) at potential step of 0.35Vfor different concentrations of UA. The letters 1–6 correspond to 0, 0.15, 0.3, 0.45, 0.6 and 0.75 mM UA and (b´) plots of Q versus t1/2 obtained from the chronocoulograms and (c´) plot of the straight lines against the UA concentration
A plot of I vs. t−1/2 for CPE/LFONR in the presence of UA gives a straight line (Fig. 5b), the slope of which can be used to estimate (Fig. 5c) the diffusion coefficient of UA (D). The value of the D was found to be 3.7 × 10⁻⁶ cm2 /s [56,57]. The chronocoloumetry as well as the other electrochemical methods was employed for the investigation of electrode processes at chemically modified electrodes. Chronocoloumetric measurements of UA at CPE/LFONR were done by setting the working electrode potential at 450 mV for various concentrations of UA (Fig. 5a´). For an electroactive material (UA in this case) with a diffusion coefficient of D, the current for the electrochemical reaction (at a mass transport limited rate) is described by the Cottrell equation and its integral gives the cumulative charge passed [52]:
Under diffusion control, a plot of Q versus t1/2 will be linear, and from the slope the value of D can be obtained. Fig. 5b´ shows the experimental plots with the best fits for different concentration of UA employed. The slopes of the resulting straight lines were plotted versus the UA concentrations (Fig. 5c´). The value of the D was found to be 5.91 × 10⁻⁶ cm2 /s.
Calibration plot and limit of detection
Linear sweep voltammetry was used to determine the concentration of UA (Fig. 6).
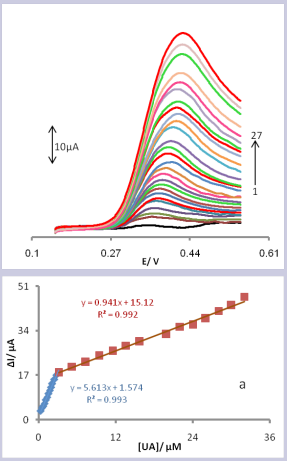
Figure 6. Linear sweep voltammograms of CPE/LFONR 0.1 mol/L PBS (pH 6.0) containing different concentrations of UA. The numbers 1–27 correspond to: 0, 0.3, 0.5, 0.7, 0.9, 1.1, 1.3, 1.5, 1.7, 1.9, 2.1, 2.4, 2.7, 3.1, 5.2, 7.3, 9.4, 11.5, 13.6, 15.7, 19.9, 22, 24, 26, 28, 30 and 32 μM of UA. Inset (a) represents the variations of anodic peak currents vs. uric acid concentration.
Voltammograms clearly show that the plot of peak current versus UA concentration is constituted of two linear segments with different slopes (slope: 5.613 µA.µM-1 for first linear segment, 0.941 µA.µM-1 for second linear segment), corresponding to two different ranges of substrate concentration, 0.3- 3.1 µmol L−1 for first linear segment and 3.1– 32.0 µ molL−1 for second linear segment (Fig. 6, curve a). The decrease of sensitivity (slope) in the second and third linear ranges are likely to be due to kinetic limitation. The detection limit (3σ) for UA in the first range region was found to be 0.176 µ molL-1 and which was found 5.87 µM with formula of 10 S/m [58].
Real sample analysis
The practical application of the current method was tested by measuring the concentration of UA in human blood serum and urine samples. The recovery experiments were carried out by the standard addition method for the determination of UA in blood serum and urine samples. The human blood serum and urine samples were diluted by 20 times in a 0.1 M phosphate buffer solution (pH 6.0) without any treatment. The UA oxidation peak was observed in LSVs after different spiked concentrations of UA to serum and urine samples. The recovery results were obtained, and the results are summarized in Table 1.
Table 1: Determination of UA in human serum and urine samples using CPE/ LFONR(n = 3)
| Sample | Detected (µM) | Added (µM) | Found (µM) | Recovery (%) | RSD (%) |
| Serum | 0.8 | 1.0 | 1.7 | 95.4 | 1.3 |
| 4.0 | 4.9 | 102.1 | 1.8 | ||
| 10.0 | 11.2 | 103.7 | 2.6 | ||
| 20.0 | 20.6 | 99.0 | 3.2 | ||
| Urine 1 | 3.7 | 1.0 | 3.8 | 102.6 | 3.7 |
| 4.0 | 8 | 103.9 | 1.8 | ||
| 10.0 | 12.9 | 94.2 | 2.7 | ||
| 20.0 | 23.9 | 100.8 | 3.1 | ||
| Urine 2 | 4.7 | 1.0 | 5.6 | 98.2 | 0.8 |
| 4.0 | 8.9 | 102.3 | 1.9 | ||
| 10.0 | 15.1 | 102.7 | 2.5 | ||
| 20.0 | 23.9 | 96.8 | 2.8 |
CONCLUSION
In this paper, we introduced a sensor based on a Lewatit FO36 nano resin modified carbon paste electrode. The Lewatit FO36 nano resin can increase anodic peak current of UA with respect to currents obtained from a CPE. The results indicated that application of Lewatit FO36 nano resin leads to high sensitivity in the real sample analysis. The simple fabrication procedure, high speed of use, suitable linear dynamic range, low detection limit, and high sensitivity, suggest that the proposed sensor is an attractive candidate for practical applications.
ACKNOWLEDGMENT
We gratefully acknowledge the financial support of the University of Sistan and Baluchestan (USB). We are also very grateful to three anonymous reviewers for their comments which allowed us to improve our work.
DISCLOSURE
The authors declare no conflicts of interest.


