Biomechanics of the Implant Jaw Bone Model
- 1. Student scientific supervisor, Russia
- 2. Doctor of Technical Sciences Saratov State Technical University, Saratov, Russia
Abstract
The article investigates the biomechanics of masticatory loading on a dental implant with a ZrO2 crown. Various loading conditions are analyzed to ensure the reliability of dental implant performance.
Keywords
• Implant; Bone; Cancellous bone; Cortical bone; Load; Osseointegration; Cx`rown
INTRODUCTION
It is well known that after implant placement into bone, an interaction occurs between the implant surface and the bone, resulting in osseointegration. Osseointegration is defined as a direct structural connection between living, organized bone and the surface of an implant subjected to functional loading. Achieving osseointegration requires compliance with several conditions: the use of a biocompatible material, appropriate macrodesign, a suitable surface, correct surgical technique, and adequate loading of the implant [1-3].
Objective of the study
To analyze the stress-strain state during the interaction of bone and an implant with a zirconium dioxide crown
Geometric model
During the study, the following components were designed: cortical bone, abutment, implant, cancellous bone, and crown. All dimensions and physical properties of the bone tissues were taken from CT scan results and implemented in the Solid Edge software. The cancellous bone is surrounded by cortical bone with a thickness of 2 mm. A molar crown made of zirconium dioxide was also designed and assigned the corresponding material properties. The overall dimensions of the assembly are approximately 43.5 mm in height and 16 mm in width. Holes were created in the bone tissue models for implant placement. In addition, a tetrahedral mesh with an element size of 1.37 mm was applied to the entire assembly to perform the calculations (Table 1).
Table 1: Material dimensions.
|
Object |
Material |
Mass, kg |
Volume, mm3 |
Weight, ? |
|
Cortical bone |
Cortical tissue |
0,022 |
12664 |
0,216 |
|
Implant |
Titanium |
0,001 |
146 |
0,006 |
|
Abutment |
Titanium |
0,001 |
112 |
0,005 |
|
Cancellous bone |
Cancellous bone |
0,036 |
44000 |
0,350 |
|
Crown |
Zirconium dioxide |
0,004 |
629 |
0,035 |
To ensure correct calculation of masticatory loading and the accuracy of the results, surface contacts between the crown and the implant and between the implant and the bone surface were taken. A one-stage (immediate) load of 200–400 N is a safe, measured pressure on the implant with a temporary crown immediately after surgery. This load stimulates healing, prevents bone atrophy, and allows chewing soft foods without overloading the structure [4].. The application algorithm generates conditional stresses at each contacting surface, providing idealized conditions for simulating their interaction. For the accuracy of the experiment, it was assumed that the surfaces of the cancellous and cortical bone were 100% osseointegrated and free of gaps. In order to conduct a reliable load experiment, it is necessary to study the material properties as well as the implant placement process (Figure 1, Table 2 and 3).
Figure 1 Dimensions of the modeled assembly components, where: 1 – abutment 2 – implant 3 – cancellous bone 4 – cortical bone 5 – ZrO? crown.
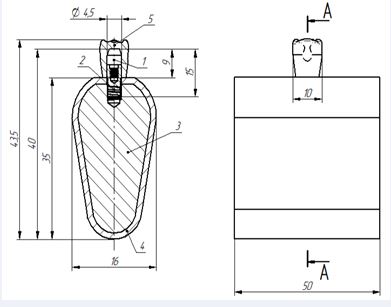
Table 2: Contact modeling
|
Contact name |
Contact type |
Search distance |
|
Crown–abutment |
Bonding |
0,04 mm |
|
Abutment–implant |
Bonding |
0,04 mm |
|
Implant–cancellous bone |
Bonding |
0,04 mm |
|
Cancellous bone–cortical bone |
Bonding |
0,04 mm |
Table 3: Number of elements and nodes analyzed
|
Object |
Nodes |
Elements |
|
Crown |
126 346 |
80562 |
|
Abutment |
31586 |
25014 |
|
Implant |
33000 |
21587 |
|
Cancellous bone |
84656 |
52346 |
|
Cortical bone |
108545 |
77458 |
Material properties
The total displacement under all applied forces remains within the same minimum and maximum ranges, which may indicate the stability of the system under increasing load. Previously [2], a calculation without a crown was performed, in which the displacements were slightly greater than those under the same load with the crown present. These results demonstrate a relationship between the applied force and the maximum displacement of the object, which may be useful for further analysis of the stability and strength of both configurations (Table 4-Table 8) (Figure 2-Figure 5).
Table 4: Titanium
|
Attribute |
Value |
|
Density |
4511,000 kg/m^3 |
|
Coefficient of thermal expansion |
8,2·10?? 1/°C |
|
Thermal conductivity |
0,016 kW/(m·K) |
|
Specific heat capacity |
519,000 J/(kg•K) |
|
Elastic modulus |
102731,879 MPa |
|
Poisson’s ratio |
0,340 |
|
Yield strength |
172,369 MPa |
|
Ultimate strength |
241,316 MPa |
Table 5: Cancellous bone.
|
Attribute |
Value |
|
Density |
800,000 kg/m^3 |
|
Coefficient of thermal expansion |
4,3 ·10??/°C |
|
Thermal conductivity |
0,000 kW/(m·K) |
|
Specific heat capacity |
0,000 J/(kg•K) |
|
Elastic modulus |
1400,000 MPa |
|
Poisson’s ratio |
0,300 |
|
Yield strength |
10,000 MPa |
|
Ultimate strength |
12,000 MPa |
Table 6: Cortical bone
|
Attribute |
Value |
|
Density |
1740,000 kg/m^3 |
|
Coefficient of thermal expansion |
5,1 ·10??/°C |
|
Thermal conductivity |
0,001 kW/(m·K) |
|
Specific heat capacity |
1,000 J/(kg•K) |
|
Elastic modulus |
14000,000 MPa |
|
Poisson’s ratio |
0,300 |
|
Yield strength |
100,000 MPa |
|
Ultimate strength |
150,000 MPa |
Table 7: Zirconium dioxide
|
Attribute |
Value |
|
Density |
5680,000 kg/m^3 |
|
Coefficient of thermal expansion |
10,3 ·10??/°C |
|
Thermal conductivity |
3,000 kW/(m·K) |
|
Specific heat capacity |
400,000 J/(kg•K) |
|
Elastic modulus |
210000,000 MPa |
|
Poisson’s ratio |
0,300 |
|
Yield strength |
195,000 MPa |
|
Ultimate strength |
1400,000 MPa |
|
Elongation, % |
4,000 |
Table 8: Loads.
|
Load name |
Load type |
Load value |
Load distribution |
Load direction |
Load direction parameter |
|
Force 1 |
Force |
200 ? |
On the crown |
( 0,20, 0,00, 0,98 ) |
Along the vector |
|
Force 2 |
Force |
300 ? |
On the crown |
( 0,20, 0,00, 0,98 ) |
Along the vector |
|
Force 3 |
Force |
400 ? |
On the crown |
( 0,20, 0,00, 0,98 ) |
Along the vector |

Figure 2 Displacements under a force of 200 N (normal masticatory load).

Figure 3 Displacements under a force of 300 N (increased masticatory load).
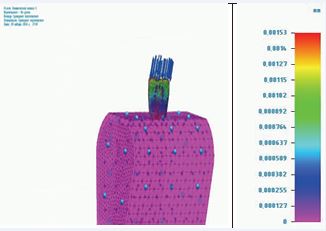
Figure 4 Displacements under a force of 400 N (maximum masticatory load).

Figure 5 Graph of displacement and coordinate dependence on load.
Stress analysis results
Safety margin results (Figure 6-Figure 12) (Table 9-Table 17)
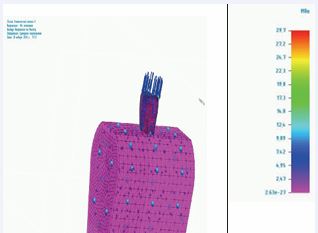
Figure 6 von Mises stresses (Force 200 N).

Figure 7 von Mises stresses (Force 300 N).

Figure 8 von Mises stresses (Force 400 N).

Figure 9 Graph of safety factor dependence on load.
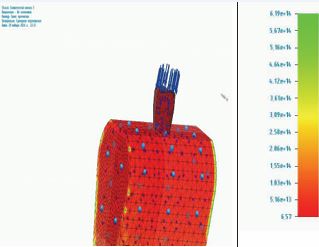
Figure 10 Safety factor results (Force 200 N).
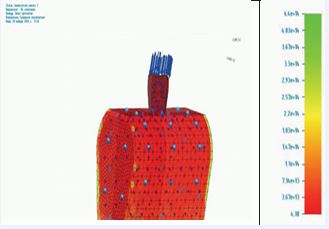
Figure 11 Safety factor results (Force 300 N).
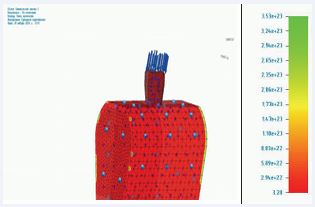
Figure 12 Safety factor results (Force 400 N).
Table 9: Force 200 N.
|
Results component: total displacement |
||||
|
Range |
Value |
X |
Y |
Z |
|
Minimum |
0 mm |
-12,596 µm |
-7,778 µm |
27,966 µm |
|
Maximum |
0,000764 mm |
3,872 µm |
-2,661 µm |
45,171 µm |
Table 10: Force 300 N.
|
Results component: total displacement |
||||
|
Range |
Value |
X |
Y |
Z |
|
Minimum |
0 mm |
-12,596 µm |
-7,778 µm |
27,966 µm |
|
Maximum |
0,00115 mm |
3,872 µm |
-2,661 µm |
45,171 µm |
Table 11: Force 400 N
|
Results component: total displacement |
||||
|
Range |
Value |
X |
Y |
Z |
|
Minimum |
0 mm |
-12,596 µm |
-7,778 µm |
27,966 µm |
|
Maximum |
0,00153 mm |
3,872 µm |
-2,661 µm |
45,171 µm |
Table 12: Force 200 N
|
Results component: von Mises |
||||
|
Range |
Value |
X |
Y |
Z |
|
Minimum |
2,63e-27 MPa |
11,771 µm |
20,000 µm |
4,849 µm |
|
Maximum |
29,7 MPa |
3,948 µm |
-5,738 µm |
33,352 µm |
Table 13: Force 300 N.
|
Results component: von Mises |
||||
|
Range |
Value |
X |
Y |
Z |
|
Minimum |
4,55e-28 MPa |
11,771 µm |
20,000 µm |
4,849 µm |
|
Maximum |
44,5 MPa |
3,948 µm |
-5,738 µm |
33,352 µm |
Table 14: Force 400 N.
|
Results component: von Mises |
||||
|
Range |
Value |
X |
Y |
Z |
|
Minimum |
3,81e-27 MPa |
11,771 µm |
20,000 µm |
4,849 µm |
|
Maximum |
59,4 MPa |
3,948 µm |
-5,738 µm |
33,352 µm |
Table 15: Force 200 N.
|
Results component: safety factor / coordinates |
||||
|
Range |
Value |
X |
Y |
Z |
|
Minimum |
6,57 |
3,948 µm |
-5,738 µm |
33,352 µm |
|
Maximum |
6,19e+14 |
9,726 µm |
20,000 µm |
-6,969 µm |
Table 16: Force 300 N
|
Results component: safety factor / coordinates |
||||
|
Range |
Value |
X |
Y |
Z |
|
Minimum |
4,38 |
3,948 µm |
-5,738 µm |
33,352 µm |
|
Maximum |
4,4e+14 |
8,409 µm |
20,000 µm |
-2,848 µm |
Table 17: Force 400 N
|
Results component: safety factor / coordinates |
||||
|
Range |
Value |
X |
Y |
Z |
|
Minimum |
3,28 |
3,948 µm |
-5,738 µm |
33,352 µm |
|
Maximum |
3,53e+23 |
-3,901 µm |
20,000 µm |
-16,762 µm |
CONCLUSION
- The minimum stress values for all three applied forces remain insignificant. It can be noted that the crown helps to reduce stress values [2],
- the maximum stress values increase with the applied force from 29.7 to 59.4 MPa. This indicates that as the load increases, the material experiences higher stress levels.
- displacements along the X, Y, and Z axes remain constant for all load levels, which indicates the stability of the structure.
- the minimum values of the safety factor under applied forces of 200–400 N range from 6.57 to 3.28, which demonstrates a sufficient safety margin of the structure.
FINDINGS
The results of the safety factor analysis show a relationship between the applied force and the safety level of the crown-supported structure. The minimum safety factor values decrease with increasing load, indicating the need for careful monitoring of the structural condition under higher loads.
The comparative analysis of the stress–strain state of the implant without a crown and the implant with a crown and bone showed that the crown–implant system plays a key role in load distribution and in ensuring long- term durability. Applying a load to the occlusal edge of an implant under vertical loading along its axis results in significant splitting stresses along the implant’s vertical axis. Maximum stresses in the implant extend to the area of contact with the cortical plate on the load side, where they are concentrated. Stresses are also recorded on the opposite surface of the implant in the area of its interaction with the bone tissue. When the implant is immersed in bone tissue, the primary stresses in both the implant and the bone tissue are determined at the apex of the implant and the bone and are of a splitting nature. On the pressure side, the maximum stresses vary, and on the opposite side, a compression zone forms, extending to the apex of the implant. The stresses are compensated, but an unevenly applied load at an angle can create fatigue stress nodes in the area of contact between the implant and the bone tissue on the pressure side, which can negatively impact the usability of the implant-supported denture.
REFERENCES
- Jebbar N, Bachiri A, Boutabout B. Three-dimensional finite element analysis of the effect of impact loading from a variable-mass impactor on stress distribution at the bone implant interface. Russian J Biomechan. 2023; 27: 6-15.
- Eremeev SM, Rybakov AA, Pichkhidze S.Ya. Study of masticatory loading on an implant. In: Problems and Prospects of Russia’s Development: Youth View into the Future. Proceedings of the 8th All- Russian Youth Scientific Conference, ML-28. Kursk: Universitetskaya Kniga, 2025; 12-222.
- Eremeev SM, Zakharevich AM, Pichkhidze S.Ya. Analysis of the stress–strain state of the implant–jaw bone model. Proceedings of the 6th All-Russian Conference of Advanced Developments, ML-30, Kursk: Universitetskaya Kniga. 2025; 4: 91-99.
- Implantation Center // Akademstom URL: akademstom.ru (accessed on March 1, 2026).