A Multi-parameter Combined Machine Learning Model for Predicting Perineural invasion of rectal cancer
- 1. Department of Radiology, Affiliated Xinhua Hospital of Dalian University, China
- 2. Department of Interventional, Affiliated Xinhua Hospital of Dalian University, China
- 3. Department of Radiology, Dalian Public Health Clinical Center, China
Abstract
Objective: To investigate the value of a mechanical learning model based on multiparametric MRI imaging histology combined with clinical and conventional radiological features for preoperative prediction of perineural invasion (PNI) in rectal cancer.
Methods: We retrospectively collected a total of 123 patients diagnosed with rectal cancer by postoperative pathology from January 2016 to December 2019 in our hospital. Based on the postoperative pathology results, the patients were categorized into PNI(-) and PNI(+).Clinical data and imaging data of patients were collected. All patients were randomly divided into training cohort (n = 86) and validation (n = 37) cohort according to a ratio of 7:3. The volumes of interest were manually delineated in the T2-weighted images (T2WI) and T1-weighted images (T1WI) images, from which a total of 1476 radiomics features were extracted. Thereafter, we used Spearman correlation analysis and Mann-Whitney U test and Least Absolute Shrinkage and Selection Operator (LASSO) for feature selection sequentially, and logistic regression algorithm (LR, Logistic Regression) for the PNI prediction model construction. Three single-mode models and two mixed-mode models were included. The predictive performance and clinical utility of the models were evaluated by receiver operating characteristic curve (ROC), calibration curve and decision curve analysis (DCA).
Results: The integrated Clinical-mMRI model showed the best predictive efficacy, which yielded an AUC of 0.72 (95% CI 0.612-0.827) in the training cohort and 0.901 (95% CI 0.802-0.999) in the validation cohort. Calibration curve showed good agreement between predicted results of the model and actual events, and DCA indicated good clinical usefulness.
Conclusions: The integrated Clinical-mMRI model is better than other predictive models, and it has value in predicting the PNI status of patients with rectal cancer before surgery.
Keywords
• Radiomics
• Machine learning
• Rectal cancer
• Perineural invasion
• Prediction model
Citation
Song C, Sun Y, Qin L, Ai Q, Weng W (2025) A Multi-parameter Combined Machine Learning Model for Predicting Perineural invasion of rectal cancer. J Radiol Radiat Ther 13(2): 1114.
INTRODUCTION
Colorectal cancer is threatening people’s health as the third cancer in the world, and despite the great progress made in the diagnostic and treatment programs for colorectal cancer, most of the patients are in the middle or late stages at the time of diagnosis, so colorectal cancer is still the second leading cause of cancer deaths [1]. Intertumoral Heterogeneity (IHT) of rectal cancer is related to tumor aggressiveness, metastasis and recurrence, and influences the therapeutic efficacy and prognosis of the tumor. IHT makes the survival rate of rectal cancer patients with the same TNM stage may be very different [2]. MRI is usually recommended as the first choice of imaging examination for rectal cancer. MRI can evaluate the tumor location, TNM stage, rectal mesenteric area, Extramural vascular invasion (EMVI), and Circumferential Resection margin (CRM) status of rectal cancer, and it has the characteristics of high resolution, no ionizing radiation, high safety, and high accuracy [3].Perineural Invasion (PNI) is thought to be associated with a poor prognosis for patients, and is a type of tumor cell invasion of neural structures that may lead to metastasis and recurrence of the tumor [4]. PNI has been included in the NCCN guidelines for colorectal cancer and other guidelines for risk factors for poor prognosis after surgery. With the development of medical imaging and computer technology, Radiomics, an emerging diagnostic technique, has emerged, making preoperative evaluation of PNI possible. Radiomics is the extraction of a large number of multidimensional features from traditional imaging images, and through high-throughput quantitative analysis and the application of automated data characterization algorithms, the imaging data in the region of interest are transformed into spatial data with high resolution and can be explored for characterization and modeling to assess and validate the pathology, mutation status, response to treatment, and clinical prognosis [5]. Therefore, this study intends to investigate the value of multiparametric MRI imaging grouping model for preoperative prediction of preoperative PNI status of rectal cancer based on rectal high-resolution T1WI and T2WI images and clinical radiological features.
METHODS
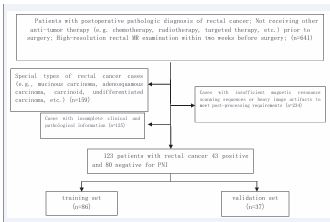
The Research Ethics Committee of Xinhua Hospital Affiliated to Dalian University (Dalian, China) approved this study (project approval number 2022-088-01) and waived informed consent for this retrospective study. This study retrospectively collected 713 patients with postoperative confirmed rectal cancer from January 2016 to December 2019 in Xinhua Hospital affiliated to Dalian University. Among the inclusion criteria: ? patients with postoperative pathological diagnosis of primary rectal cancer; ? patients who did not receive other antitumor treatments (e.g., chemotherapy, radiotherapy, targeted therapy, etc.) before surgery; ? high-resolution rectal MRI before and after Vaseline treatment within two weeks prior to surgery ? had complete clinical and pathological data. Exclusion criteria: ? special type of rectal cancer cases (such as special type of adenocarcinoma, adenosquamous carcinoma, carcinoid tumor, etc.) (n=159); ? cases receiving other anti-tumor treatments prior to the operation (n=52); ? cases without pre- and post-Vaseline perfusion MRI scans or with heavy image artifacts that could not satisfy the requirements for post treatment (n=234); ? cases with incomplete clinical and pathological data (n=125). 125). Finally, a total of 123 patients were included in the study, with 43 positive and 80 negative PNI. Preoperative clinical data and routine radiological characteristics of the enrolled patients were collected, including gender, age, preoperative serum CEA level, tumor location, T-stage, N-stage, and EMVI (Figure 1).
Figure 1: Procedure of case screening in this study.
The postoperative pathological tissues were diagnosed by two or more attending professional pathologists. According to the 8th edition of the AJCC staging system, when the tumor cells grew along the direction of the nerve fibers and encircled more than one-third of the circumference of the nerve fibers, or when the tumor cells infiltrated the nerve sheaths of the nerve fibers and entered into the neural fascia membrane, the tumor cells were defined as PNI-positive, and vice versa, were defined as PNI-negative. There were 43 cases in the PNI-positive group and 80 cases in the PNI-negative group.All patients underwent rectal MR scanning within two weeks prior to surgery. The enrolled patients were scanned preoperatively with Siemens Avanto 1.5T superconducting MR scan with a 6-channel body surface phased array coil. Patients were placed in supine position with head first. Patients were cleansed with corkscrew to clean the bowel before examination and scopolamine was injected intramuscularly to avoid artifacts caused by bowel peristalsis. Fast spin-echo sequences were selected for all scans, as follows: ?oblique axial T2WI; ? sagittal T1WI was scanned after 80-100 ml of petroleum jelly was instilled in the rectum. (Detailed scanning parameters are shown in Table 1.
Table 1: MRI Scanning parameters.
|
parameters |
position |
FOV(cm) |
matrices |
TR(ms) |
TE(ms) |
layer thickness (mm) |
bandwidths (Hz/px) |
|
T2WI |
oblique axes |
22×22 |
448×448 |
4000-5000 |
90 |
3-4 |
159 |
|
T1WI |
sagittal |
25×25 |
320×320 |
500-550 |
10 |
3-4 |
178 |
MRI images of enrolled patients were independently evaluated for routine radiologic features and segmentation of lesions outlined by one experienced radiologist and confirmed by another physician. Both physicians were unaware of the patient’s information and pathologic results, and when there was a disagreement between the two physicians’ results, the other senior radiologist reassessed them. Routine radiological features included (i) the location of the tumor, (ii) the TNM stage of the tumor, and (iii) the status of extra-mural vascular infiltration (EMVI) status. Images were imported into the open-source software ITK-SNAP (version 3.8.0, http://www. itksnap. org), and the region of interest was outlined layer by layer along the tumor margins in the Vaseline-perfused sagittal T1WI images and oblique axial T2WI images (Figure 2).
Figure 2 Schematic diagram of manually outlining lesions using ITK SNAP
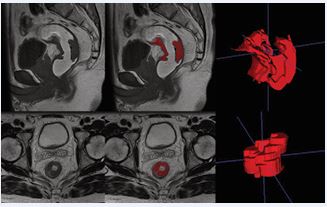
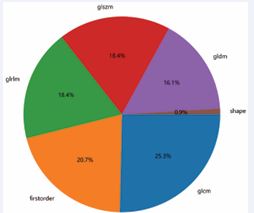
The contents of the intestinal lumen and the uninvaded rectal wall were avoided as much as possible during the outlining process to ensure the accuracy and reproducibility of the outlining. The PyRadiomics package in Python 3.11.1 was used to extract 1,476 features from each software in T1WI and TWI, and the extracted imaging histology features mainly included three main categories: 1) first-order features; 2) morphological features; 3) grayscale features, gray-level co-occurrence matrix (Grey-Level Co-occurrence Matrix, GLCM) features, Grey-Level Dependence Matrix (GLDM) features, Grey Level Run Size Matrix (GLRLM) features, and Grey-Level Size Zone Matrix (GLSZM) features (Figure 3).
Figure 3 Feature distribution map.
Imaging histology features are of different orders of magnitude, and it is necessary to standardize the features before screening them, and in this study, the Z-score method was used for standardization to transform the data into comparable data. Screening of imaging histology features can prevent overfitting phenomenon when constructing the model, this study firstly applies ICC to extract the features with correlation coefficient >0.75, and then adopts Spearman correlation test, Mann-Whitney U-test and LASSO to screen the features sequentially. The collected clinical and conventional radiological features of the patients were analyzed by univariate and multivariate logistic regression, and the statistically significant independent risk factors were screened out (P < 0.05). Then the optimal Radiomics features screened in T1WI and T2WI were combined with the clinical features to construct logistic regression (LR) models using the above variables in the training set, respectively, named Clinical Radiomics Model, T1 Model, T2 Model, Combined Radiomics Model, and Combined Clinical-Imaging Radiomics Model, and the predictive efficacy of the models was evaluated by using ROC curves, and the area under the ROC curves, AUC, and the accuracy, specificity and sensitivity of the model, and to validate the predictive efficacy of the model in the validation set. In order to make the model more convenient for clinical application, the clinical Radiomics model was visualized using a nomogram. Nomogram was used to visualize the clinical radiology-imaging model.
Statistical methods
Python software was used for feature extraction and screening, model construction, assessment of predictive efficacy, and graph production. The diagnostic efficacy of each imaging genomics model was assessed by the ROC curve AUC, and the AUC and its 95% confidence interval (CI), accuracy, sensitivity and specificity were calculated to compare the diagnostic efficacy of each imaging genomics model. The differences in AUC values between the models were compared using the Delong test, and the differences were considered statistically significant at P < 0.05. Calibration curves were used to assess model predicted probability versus actual probability. The clinical decision curve (DCA) was used to assess the clinical application value of the model. Statistical analyses of clinical and routine radiological data were processed by SPSS 27.0 software. p < 0.05 indicated that the difference was statistically significant. Whether the quantitative data conformed to normal distribution was tested by Kolmogorov-Smirnov, and obedience to normal distribution was indicated by X± S, and disobedience to normal distribution was indicated by M (P25, P75). Independent samples t-test or Mann Whitney U-test was used to compare continuous variables, and χ2 test or Fisher exact test was used to compare categorical variables.
RESULTS
A total of 123 patients with primary rectal cancer were included in this study (91 males and 32 females, age range 33-90 years), of which 80 were PNI-negative and 43 were PNI-positive. All patients were randomly divided into the training set and the validation set in a ratio of 7:3. The results of the comparisons of the clinical and radiological characteristics within the training and validation sets, are shown in Table 2.1. All the clinical data and routine radiologic characteristics were not statistically significant between the training set and validation set (P>0.05). Clinical data: patients’ serum CEA levels, gender, and age were not statistically different within the validation set and the training set (P values of 0.222, 0.215, and 0.586 for the training set, and 0.575, 0.467, and 0.695 for the validation set, respectively). Conventional radiological features: the differences in tumor location and T staging were statistically significant only in the training set, while the differences in the validation set were not statistically significant (P values of 0.008, 0.002 for the training set and 0.530, 0.057 for the validation set, respectively); the differences between the N staging and EMVI were statistically significant within the validation set and the training set (P values of 0.002, 0.004 for the training set, 0.027, 0.042 for the validation set, respectively). One-way logistic regression analysis showed that tumor location, T stage, N stage, and EMVI were significant factors in distinguishing between positive and negative PNI (P values of 0.035, 0.021, 0.002, and 0.005, respectively),
Table 2.1: Clinical and routine radiological characteristics of patients with rectal cancer.
|
Clinical and routine radiological characteristics |
Training set |
|
Validation set |
|
P** |
||
|
PNI(+) n=29 |
PNI(-) n=57 |
P |
PNI(+) n=14 |
PNI(-) n=23 |
P |
0.661a |
|
|
SEX |
|
|
0.222a |
|
|
0.575a |
0.239a |
|
Male |
23(79.31) |
38(66.67) |
|
12(85.71) |
18(78.26) |
|
|
|
Female |
6(20.69) |
19(33.33) |
|
2(14.29) |
5(21.74) |
|
|
|
Age (Y) |
62.14 |
65.23 |
0.215b |
64 |
63 |
0.467c |
0.847c |
|
(±11.488) |
(±10.963) |
(58, 70) |
(56, 70) |
||||
|
CEA |
|
|
0.586a |
|
|
0.695a |
0.224a |
|
<4.7ng/ml |
15(51.72) |
33(57.89) |
|
10(71.42) |
15(65.22) |
|
|
|
>4.7ng/ml |
14(48.28) |
24(42.11) |
|
4(28.58) |
8(34.78) |
|
|
|
Tumor location |
|
|
0.008a* |
|
|
0.530a |
0.725a |
|
High (10-15cm) |
14(48.28) |
10(17.54) |
|
3(21.42) |
5(21.74) |
|
|
|
Mid (5-10cm) |
5(17.24) |
22(38.60) |
|
6(42.84) |
6(26.09) |
|
|
|
Low (0-5cm) |
10(34.48) |
25(43.86) |
|
5(35.74) |
12(52.17) |
|
|
|
T staging |
|
|
0.018a* |
|
|
0.057a |
0.985a |
|
T1-T2 |
9(31.03) |
33(57.89) |
|
4(28.58) |
14(60.87) |
|
|
|
T3-T4 |
20(68.97) |
24(42.11) |
|
10(71.42) |
9(39.13) |
|
|
|
N staging |
|
|
0.002a* |
|
|
0.027a* |
0.740a |
|
N0 |
1(3.45) |
21(36.85) |
|
0(0.00) |
9(39.13) |
|
|
|
N1 |
23(79.31) |
33(57.89) |
|
13(92.86) |
13(56.52) |
|
|
|
N2 |
5(17.24) |
3(5.26) |
|
1(7.14) |
1(4.35) |
|
|
|
EMVI |
|
|
0.004a* |
|
|
0.042a* |
0.425a |
|
- |
16(55.17) |
48(84.21) |
|
9(64.26) |
21(91.30) |
|
|
|
+ |
13(44.82) |
9(15.79) |
|
5(35.74) |
2(8.70) |
|
|
*1) a. χ2 test or Fisher's exact test, b. independent samples t-test, c. Mann-Whitney U-test. 2) *Differences are statistically significant, **Training set vs. validation set between groups
and multifactorial logistic regression analysis showed that N stage and EMVI were independent risk factors for predicting the status of PNI (P values of 0.042 and 0.022, respectively), as shown in Table 2.2. Firstly, 1476 Radiomics features in the T1 and T2 groups were analyzed by the ICC algorithm, respectively, and a total of 503 and 610 features with correlation coefficients >0.75 were obtained. Then Spearman correlation test was performed so that one of the features with correlation coefficient >0.9 was retained, leaving 297 and 281 features, respectively; then Mann-Whitney U-test was performed to select the features that were statistically significantly different from the PNI-positive and -negative groups (P<0.05), with 17 and 16 features, respectively; and finally, LASSO five-fold cross-validation was used to further perform feature screening. 8 remaining features in T1 group and 9 features in T2 group were used for Radiomics modeling. The clinical features and Radiomics features screened above were analyzed by logistic regression to construct the clinical radiological model, T1WI model, T2WI model, multiparameter Radiomics model, and Clinical Radiology Imaging Radiomics model for predicting the PNI of patients with rectal cancer, respectively, with the AUC values of the training set ranging from 0.720 to 0.768, and those of the validation set from 0.734 to 0.901, with the AUC values of the training set from 0.868 (0.794 to 0.942),
Table 2.2: Results of univariate and multivariate logistic regression analysis of clinical radiological characteristics in the training set
|
Clinical Radiological characteristics |
monofactor analysis |
multivariable logistic regression |
||
|
OR(95%CI) |
P? |
OR(95%CI) |
P? |
|
|
Tumor location |
0.544(0.310-0.957) |
0.035 |
- |
- |
|
T staging |
3.056(1.186-7.871) |
0.021 |
- |
- |
|
N staging |
5.525(1.890-16.147) |
0.002 |
3.485(1.044-11.633) |
0.042 |
|
EMVI |
4.333(1.561-12.029) |
0.005 |
3.665(1.207-11.125) |
0.022 |
and the validation set from 0.901 (0.804 to 0.942). The efficacy of the Clinical Radiomics model was higher than the other models, with an AUC of 0.868 (0.794~0.942) for the training set and 0.901 (0.802~0.999) for the validation set. After the Delong test to compare the differences in AUC between the different models, the AUC values of 0.002 0.005-- 3.485(1.044-11.633) 3.665(1.207-11.125) P?-- 0.042 0.022 the total number of scores obtained from the factors corresponding to the risk value, and the Novel Program is shown in Figure 7. DISCUSSION the clinical radiology model with the multiparameter Radiomics model and the clinical radiology-imaging radiology model were significantly different in the training set (p-value of 0.013 for all of them), and the differences between the training and validation sets of the remaining models were not statistically significant (p-value of >0.05 for all of them).The results of the ROC analysis of the five models for prediction of the PNI status are shown in Table 2.3, Figure 4.
Table 2.3: Results of ROC analysis of predictive PNI models
|
Model |
AUC(95%CI) |
Accuracy |
Sensitivity |
Specificity |
|
|
Clinical Radiology |
training set |
0.720(0.612~0.827) |
0.686 |
0.43 |
0.82 |
|
validation set |
0.819( 0.684~0.954) |
0.784 |
0.62 |
0.88 |
|
|
T1WI |
training set |
0.796(0.704~0.889) |
0.744 |
0.57 |
0.84 |
|
validation set |
0.734(0.572~0.896) |
0.703 |
0.54 |
0.79 |
|
|
T2WI |
training set |
0.811(0.722~0.900) |
0.756 |
0.70 |
0.79 |
|
validation set |
0.744(0.584~0.903) |
0.703 |
0.46 |
0.83 |
|
|
Multi-parametric Radiomics Modeling |
training set |
0.868(0.788~0.939) |
0.814 |
0.80 |
0.80 |
|
validation set |
0.881(0.773~0.989) |
0.784 |
0.85 |
0.79 |
|
|
Clinical Radiology - Radiomics Modeling |
training set |
0.868(0.794~0.942) |
0.814 |
0.80 |
0.82 |
|
validation set |
0.901(0.802~0.999) |
0.838 |
0.69 |
0.92 |
|
Figure 4 A-E shows the ROC curves of PNI predicted by clinical model (A), T1WI model (B), T2WI model (C), multiparametric Radiomics model (D), and clinical combined multiparametric Radiomics model (E) in the training and validation sets.
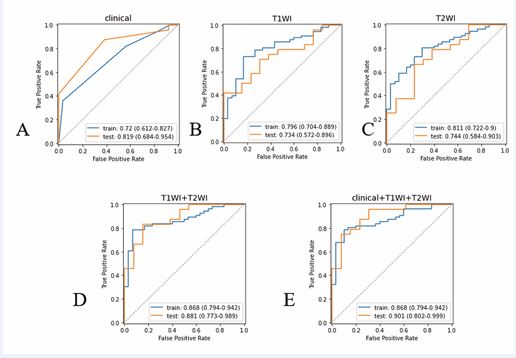
Figure 5 A-E shows the calibration curves of clinical radiological model, T1WI model, T2WI model, multiparameter radiomics model, and the clinical-radiological model model, respectively. The abscisce represents the predicted probability of PNI in rectal cancer patients, and the ordinate represents the actual probability.
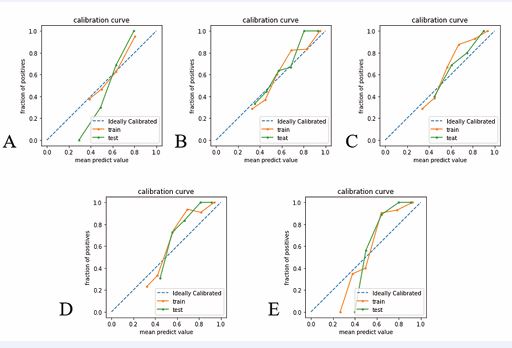
The calibration curves of the above five predictive PNI logistic regression models are shown in Figure 5, and the results of the Hosmer-Lemeshow test show that the calibration curves of each predictive model are well-fitted (P-values for the training set are, in order, 0.483, 0.982, 0.996, 0.347, 0.665; P-values for the validation set are, in order, 0.826, 0.779, 0.469, 0.939, 0.771). The clinical decision curves (DCA) for the Clinical Radiographic Model, T1WI Model, T2WI Model, Multi-Parametric Radiomics Model, and Clinical Radiographic-Imaging Radiomics Model are shown in Figure 6.
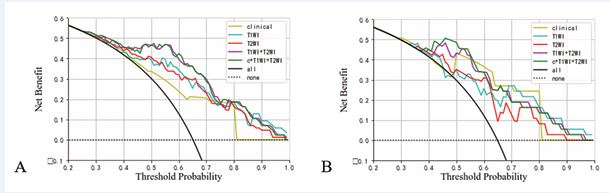
Figure 6 Decision curves analysis of each prediction model in the training set (A) and validation set (B).
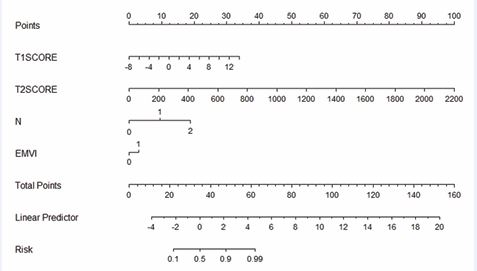
Based on the coefficients of each feature in T1WI and T2WI, the T1-Radscore and T2-Radscore values of each case were calculated respectively, and the scores were assigned based on the weights of the independent variables in the regression model, and the likelihood of PNI in patients with rectalthe cancer was obtained by summing total number of scores obtained from the factors corresponding to the risk value, and the Novel Program is shown in Figure 7.
Figure 7 Nomogram integrating Radscore with MR N stage and EMVI.
DISCUSSION
This study retrospectively analyzed the preoperative MRI imaging features and clinical data of patients with rectal cancer, and used radiomics features combined with clinical MRI features to construct a Machine Learning prediction model to predict PNI. And construct the nomograph of Radiomics score for visual prediction of PNI. In the study of rectal cancer, PNI has received more and more attention from scholars, and it has become a consensus that PNI is an independent risk factor for tumor prognosis. PNI mainly occurs in the tumor microcirculation stage, which is the process of tumor cell invasion along the nerve cells, and it is an important factor in the early recurrence of the tumor and metastasis. PNI is the result of the presence of a variety of neurotrophic and chemotactic factors between the tumor cells and the surrounding microenvironment interactions between tumor cells and the surrounding microenvironment interactions between tumor cells and the surrounding microenvironment [6,7]. Chemotherapy impedes tumor-specific perineural spread and can be used to guide postoperative adjuvant radiotherapy. Quah’s study of 448 patients with stage II rectal cancer suggests that PNI can be used as a high-risk factor to personalize treatment [8]. PNI detection provides basis for personalized adjuvant therapy in colorectal cancer patients [9]. In some previous studies, Jiayou Chen built a prediction model based on clinical features and T2WI sequences, and made a Novel Program for the evaluation of PNI [10]. Similarly in previous studies it has been similarly noted that in patients with rectal cancer who develop lymph node metastases and extra-mural vascular infiltration may have a greater probability of PNI [11]. This study is an attempt to construct a model for preoperative assessment of PNI status in patients with rectal cancer by trying to apply a combination of clinical and radiomic features. The information contained in radiomics features is characterized by high throughput and is a bridge between imaging and clinical diagnosis and treatment. It can provide a basis for clinicians to make clinical decisions and has important clinical application value [12,13]. The radiomic features extracted in this study describe the voxel gray intensity and spatial distribution of VOIs in different dimensions, which become important parameters for describing tumor heterogeneity. Whereas tumor heterogeneity is closely related to tumor response to treatment, accurate identification of tumor heterogeneity is critical in the development of a treatment plan [14,15]. In this study, the best model for preoperative prediction of PNI in rectal cancer was the Clinical-Radiomics model (combined model). In order to provide clinicians with a convenient and reliable tool for evaluating PNI, the Novel Program established in this study based on T1Radscore, T2Radscore, MR N staging, and EMVI can intuitively assess the PNI status of patients with rectal cancer, and this study can provide a basis for clinicians to personalize their diagnostic and treatment plans. In this study, we included 123 rectal cancer patients who underwent TME, and extracted tumour-based 3D-VOI Radiomics features from T1WI and T2WI images, which provide more complete information about tumour heterogeneity based on 3D-VOI compared to 2D ROI. 6 first-order features, 1 morphological feature, 5 GLCM features, 2 GLDM features and 2 GLAZM features were included in the Radiomics model incorporated, which described the voxel intensity or spatial distribution of the VOIs from different perspectives, and became an important parameter for describing the tumour heterogeneity. The included clinical-imaging features included MRI N-staging and EMVI, suggesting that patients who developed lymph node metastasis and extra-mural vascular invasion might be more prone to neurological invasion. The predictive performance of the constructed T1WI+T2WI Radiomics model (multiparametric Radiomics model) was slightly higher than that of the clinical radiological model (training set: AUC 0.720 vs 0.868 validation set AUC 0.819 vs 0.881), suggesting that the imaging histological analysis could be useful for preoperative assessment of the PNI status of rectal cancer, however, such a difference was not statistically significant, which could be attributed to the fact that the patients included in the study The relatively small sample size is related to this, and further studies are needed. The multiparametric Radiomics model was combined with the clinical radiology model to establish a clinical radiology-imaging histology model (the combined model), however, the AUC value of the combined model was only slightly higher than that of the multiparametric Radiomics model in the validation set (AUC 0.881 vs 0.901), suggesting that the clinical radiology features had a lesser role in the combined model. This study uniquely included sagittal T1WI sequences of the rectum after Vaseline perfusion. Typically, the rectum is in a semi-closed or closed state, making diagnosis difficult for the imaging physician and inaccurate outlining of the lesion. Vaseline, however, is stable in nature, less likely to cause discomfort in patients, and characterized by high signal in T1WI sequences, which can be contrasted with the low signal of the lesion. In the sagittal T1WI sequence after Vaseline infusion, the extent of lesion infiltration, the location of the lesion and the degree of narrowing of the intestinal lumen can be well observed. In this study, we combined the sagittal T1WI, axial T2WI and clinical radiological features after Vaseline perfusion to establish a clinicoradiological-Radiomics model to be applied to the prediction of the preoperative PNI status of patients with rectal cancer, which provides a strong basis for clinicians to personalize the diagnosis and treatment plan.
ACKNOWLEDGMENT
Funding
This work was supported by “2022 Dalian Medical Science Research Program Projects:2211043” and Affiliated Xinhua Hospital of Dalian University.
Conflicts of Interest
All authors have completed the ICMJE uniform disclosure form. The authors have no conflicts of interest to declare.”
Ethical Statement
The authors are accountable for all aspects of the work in ensuring that questions related to the accuracy or integrity of any part of the work are appropriately investigated and resolved.
Checklist
“The authors have completed the TRIPOD reporting checklist.”
Contributions
(I) Conception and design: CM Song, YB Sun; (II) Administrative support: WC Weng, Q Ai; (III) Provision of study materials or patients: WC Weng, Q Ai; (IV) Collection and assembly of data: CM Song; (V) Data analysis and interpretation: CM Song, YB Sun; (VI) Manuscript writing: All authors; (VII) Final approval of manuscript: All authors.
REFERENCES
- Sung H, Ferlay J, Siegel RL, Laversanne M, Jemal A, Bray F, et al. Global Cancer Statistics 2020: GLOBOCAN Estimates of Incidence and Mortality Worldwide for 36 Cancers in 185 Countries. CA Cancer J Clin. 2021; 71: 209-249.
- Cuyle PJ, Prenen H. Current and future biomarkers in the treatment of colorectal cancer. Acta Clin Belg. 2017; 72: 103-115.
- Gurses B, Boge M, Altinmakas E, Balik E. Multiparametric MRI in rectal cancer. Diagn Interv Radiol. 2019; 25: 175-182.
- Van Wyk HC, Going J, Horgan P, McMillan DC. The role of perineural invasion in predicting survival in patients with primary operable colorectal cancer: A systematic review. Crit Rev Oncol Hematol. 2017; 112: 11-20.
- Gillies RJ, Kinahan PE, Hricak H. Radiomics: Images Are More than Pictures, They Are Data. Radiology. 2016; 278: 563-577.
- Zhang M, Zhu ZL, Gao XL, Wu JS, Liang XH, Tang YL, et al. Functions of chemokines in the perineural invasion of tumors (Review). Int J Oncol. 2018; 52: 1369-1379.
- Saidak Z, Lailler C, Clatot F, Galmiche A. Perineural invasion in head and neck squamous cell carcinoma: background, mechanisms, and prognostic implications. Curr Opin Otolaryngol Head Neck Surg. 2020; 28: 90-95.
- Quah HM, Chou JF, Gonen M, Shia J, Schrag D, Landmann RG, et al. Identification of patients with high-risk stage II colon cancer for adjuvant therapy. Dis Colon Rectum. 2008; 51: 503-507.
- Zhou Y, Wang H, Gong H, Cao M, Zhang G, Wang Y. Clinical significance of perineural invasion in stages II and III colorectal cancer. Pathol Res Pract. 2015; 211: 839-844.
- Chen J, Chen Y, Zheng D, Pang P, Zhang H, Zheng X, et al. Pretreatment MR-based radiomics nomogram as potential imaging biomarker for individualized assessment of perineural invasion status in rectal cancer. Abdom Radiol. 2021; 46: 847-857.
- Parnaby CN, Scott NW, Ramsay G, Mackay C, Samuel L, Murray GI, et al. Prognostic value of lymph node ratio and extramural vascular invasion on survival for patients undergoing curative colon cancer resection. Br J Cancer. 2015; 113: 212-219.
- Miranda J, Horvat N, Araujo-Filho JAB, Charbel C, Cardoso DL, Chakraborty J, et al. The Role of Radiomics in Rectal Cancer. J Gastrointest Cancer. 2023; 54: 1158-1180.
- Bi WL, Hosny A, Schabath MB, Giger ML, Birkbak NJ, Mehrtash A, et al. Artificial intelligence in cancer imaging: Clinical challenges and applications. CA Cancer J Clin. 2019; 69: 127-157.
- Megyesfalvi Z, Gay CM, Popper H, Pirker R, Ostoros G, Heeke S, et al. Clinical insights into small cell lung cancer: Tumor heterogeneity, diagnosis, therapy, and future directions. CA Cancer J Clin. 2023; 73: 620-652.
- Vitale I, Shema E, Loi S, Galluzzi L. Intratumoral heterogeneity in cancer progression and response to immunotherapy. Nat Med. 2021; 27: 212-224.


