Texture Analysis Parameters of Temporomandibular Joint Articular Disc Associated with Clinical and MRI Characteristics of Patients with Temporomandibular Disorders
- 1. Department of Postgraduate Program in Dentistry, CEUMA University, Brazil
- 2. Department of Diagnostic Imaging, Federal University of Maranhão São Luíz, Brazi
- 3. Department of Occlusion, Fixed Prosthesis and Dental Materials, Federal University of Uberlândia, Brazil
Abstract
Objectives: To correlate the texture analysis (TA) parameters of temporomandibular joint (TMJ) articular disc images with the clinical and imaging characteristics of patients with temporomandibular disorder (TMD).
Methods: A total of 110 Magnetic Resonance Imaging (MRI) of the TMJ were selected from patients with a history of TMD. TA of the articular disc was performed using the Mazda software, and the findings were correlated with the clinical characteristics of the patients and the morphology of the articular disc. The data were subjected to binary logistic regression, and the ROC curve was used to analyze the sensitivity and specificity of each significant variable.
Results: TA parameters were significantly altered in patients with TMD with clinical symptoms of muscle pain and clicking and with imaging changes in signal alteration and effusion. The click is the clinical condition with the most altered TA parameters.
Conclusions: TA can improve the accuracy of TMD diagnosis by distinguishing between the clinical and imaging characteristics, helping in the decision-making process for the treatment of patients with TMD.
Keywords: Temporomandibular Joint Disc; Magnetic Resonance Imaging; Temporomandibular Joint Disorders; Radiomics; Diagnostic imaging.
Introduction
The temporomandibular joint (TMJ) is among the most complex joints in the human body.This joint may eventually develop disorders that involve musculoskeletal changes and/or masticatory muscles, known as temporomandibular disorders (TMDs) [1], which, according to the Diagnostic Criteria for TMD (DC/TMD), are divided into Axis I, for physical diagnoses; and Axis II, for assessment of psychosocial status and pain-related disability [2,3].These are orofacial pain most common chronic diseases, affecting 31% of adults and 11% of children and adolescents in the general population [3,4].
Currently, several TMJ image capture modalities are used, among which conventional computed tomography, cone beam computed tomography and Magnetic Resonance Imaging (MRI) stand out. MRI produces images with excellent resolution, high contrast and good dynamics [5]. It is currently considered the reference method for imaging the soft tissue structures of the TMJ (articular disc, synovial membrane and lateral pterygoid muscle) and has been identified as the best imaging modality for the diagnosis of disc displacements [5-8]. In addition, it can detect the initial signs of TMJ dysfunction, such as thickening of the anterior or posterior band, rupture of the retrodiscal tissue, changes in the shape of the disc and joint effusion [9].
Because images obtained by MRI provide more information than the human eye can capture [10], the quantitative characteristics of the images have been associated with the patient’s clinical data and outcomes by analyzing the shape, size, volume and texture of an image to determine whether it represents a normal or pathological structure.
Texture analysis (TA) is a mathematical method for processing and analyzing digital images that consists of extracting descriptors related to the distribution of grey levels that can quantify the texture in the Region of Interest (ROI) of an image and identify the spatial pattern of pixels [11]. Furthermore, it has been used to extract useful parameters generally ignored by the human eye, such as the detection of incipient histopathological changes such as increased vasodilation, presence of edema and increased microcirculation hydrostatic pressure [12].
In 1996, the Mazda software was developed at the Institute of Electronics of the Technical University of Lodz, Poland, for the texture analysis of mammograms [13].The statistical parameters calculated by the initial version of the software were derived from the co-occurrence matrix, which is a useful tool for performing quantitative analyses of the texture of MR images such as those of the TMJ articular disc. Currently, almost 300 parameters can be calculated using MaZda for each ROI for a given image normalization and quantization option.
Therefore, the objective of this study was to relate the MRI texture analysis parameters of the TMJ articular disc, analysis using Mazda software, with clinical and imaging characteristics obtained by MRI of patients with TMD.
Materials and Methods
This study followed the STROBE guidelines, was submitted to and approved by the Ceuma University Research Ethics Committee (Opinion Number: 4776213). An informed consent form was signed by those who agreed to participate. Clinical and demographic data were collected from the digital records of patients with TMD treated at Hospital São Domingos, located in the city of São Luiz, Maranhão, Brazil.
Inclusion criteria
The established inclusion criteria were as follows: patients aged 18 years or older, both sexes, with an MRI examination with good visualization of the structures of interest and a previous history of TMD diagnosed considering clinical characteristics, such as the presence of joint pain, muscle pain (masseter), presence of clicking and bone changes, and imaging characteristics, such as signal change, effusion, condyle excursion, and disc displacement with and without reduction.
MRI examinations were performed from 2019 to 2023, and the images were acquired using an integrated 1.5 Tesla MRI system (Philips Achieva; Best Noetherlands) with 47 mm micro pumps specifically for use in ATMs. Images were obtained with the patient in the open-mouth and closed-mouth positions so that the entire articular disc was visible in the anteroposterior direction.
A convenience sample of 110 bilateral TMJ images from 55 patients (75% female and 25% male) was selected, with a mean age of 36.36 years.
Texture analysis
For texture analysis, proton density (PD) MR images were selected with a more central sagittal section in which all structures of the articular disc were visible in the anteroposterior direction. Subsequently, the image selected in the DICOM format was converted to the BMP format using the Carestream Vue Pacs software version 11.3.4 (Carestream Health, Inc., Rochester, USA).
Segmentation and texture analyses were performed using the Mazda version 3.30 software (Institute of Electronics, Technical University of Lodz, Poland). The AT was performed at four equidistant points along the disc (Figure 1). To select the points, the brightness, contrast and magnifying glass tools were used to help with the anatomical visualization of the disc.
For TA, a co-occurrence matrix (MCO) biomarker was used, which consisted of a tabulation of the number of different combinations of pixel intensity values ??(grey levels) in an image and a comparison between the grey levels present in certain areas (ROIs) [14-16].
TAs were performed by two examiners who were blinded to the patient’s previous clinical situation. The examiners performed a reading calibration process that consisted of evaluating 30 images and obtaining an intraclass correlation coefficient of 0.927, reflecting an excellent degree of agreement.
The following AT parameters described in a previous study [10], were analysis: contrast, inverse difference moment, secondary angular moment, correlation, sum of squares, entropy, mean of the sum, variance of the sum, entropy of the sum, variance of difference: The clinical and imaging variables of the evaluated TMJs are shown in Table 1.
Statistical analysis
Logistic regression was performed using the Enter method to relate the clinical and imaging characteristics with the parameters of the texture analysis (Table 1). In significant cases, the ROC curve was used to analyze the sensitivity and specificity of the variables, in addition to determining the area under the curve (AUC) of significant parameters. The Youden index was used to determine the best cut-off value of the Mazda software parameters to correctly classify cases with clinical symptoms and imaging characteristics.
The significance level adopted was 5%. SPSS for Windows 26.0 (IBM, Armonk, NY, USA) was used for statistical analysis.
Table 1
Table 1: Clinical and imaging variables in TMJ MRI and texture analysis parameters analyzed using the Mazda software.
Table 2
Table 2: Result of the analysis of clinical and imaging variables and their respective texture analysis variables with their appropriate p-values.
* p≤0.05, significant association between clinical and imaging findings with texture analysis parameters.
Table 3
Table 3: Significant texture analysis parameters used to differentiate the clinical and imaging characteristics from their respective values ??of area under the ROC curve (AUC), cut-off value, sensitivity, and specificity.
Figure 1
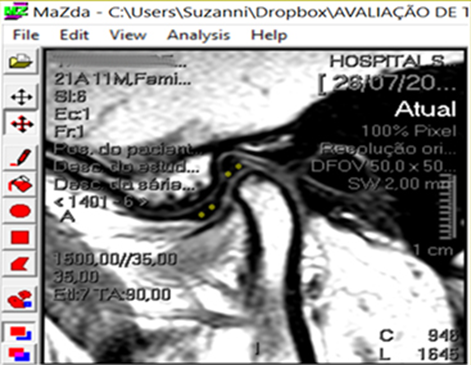
Figure 1: Sagittal sections with the selection of four points subjected to texture analysis
Results
AT parameters were significantly altered in patients with clinical symptoms of muscle pain and clicking and with imaging changes in signal change and effusion (Table 2).
The TA parameters that were significant for clinical and imaging characteristics, as well as the respective sensitivity, specificity, area under the ROC curve (AUC) values and cutoff values are presented in Table 3.
Discussion
Bone biomarker co-occurrence matrix (MCO) imaging tabulates the number of different combinations of pixel intensity values ??(grey levels) in an image. This matrix compares the grey levels present in certain areas that are demarcated using delimitation tools available in image software [14-16]. Using this marker, Bianchi et al. [19], detected condylar bone degeneration. The same matrix type was used in this study.
Sensitivity, specificity, AUC and cutoff values ??were calculated for each AT parameter that was significant for differentiating clinical and imaging characteristics. Sensitivity demonstrated the ability of the AT parameter to correctly diagnose individuals with certain clinical or imaging characteristics, whereas specificity displayed the ability of the same parameter to detect truly negative individuals, that is, to correctly diagnose individuals who do not have certain clinical or imaging characteristics.
The relationship between sensitivity and specificity was expressed through the ROC curve, but more precisely through the AUC, which represents the accuracy of the test and provides an estimate of the probability of correct classification of a subject by chance. An AUC equal to 0.5 corresponds to a test unable to make the correct diagnosis, whereas an AUC equal to 1 corresponds to a test capable of making the correct diagnosis in all cases, that is, a perfect test [20]. Furthermore, a cutoff value was presented as the best value for a given AT parameter that could better classify the presence of clinical or imaging characteristics.
Table 3 depicts the AT parameters that could distinguish the presence or absence of clinical or imaging characteristics, including sensitivity, specificity, AUC, and cutoff values.
Most AT parameters that were significant had higher specificity values ??than sensitivity values; that is, they were more efficient in correctly diagnosing patients who did not have certain clinical or imaging characteristics. Furthermore, the majority (75%) of the AUC values ??were greater than 0.70. This means that these parameters have at least a 70% chance of correctly classifying a clinical or imaging characteristic based on AT parameter values.
The AT parameters inverse difference moment and difference of variance were able to differentiate cases of patients with clinical characteristics of muscle pain, with cutoff values ??293.03 and 75.28, respectively. This means that patients who presented values ??below 293.03 of inverse difference moment are more likely to not have muscle pain. In contrast, results greater than or equal to 293.22 are more likely for the patient to have muscle pain. As for the difference of variance, values ??lower than 75.28 are more likely for the patient to not have muscle pain, whereas values ??greater than or equal to 75.28 are more likely to have muscle pain. Similar interpretations were made for the other parameters listed in Table 3.
Clinical characteristics of TMD include clenching, locking of the jaw and clicking [21].The click was the clinical characteristic variable classified by a greater number of AT parameters. Changes were found in the angular second moment, correlation, sum of squares, sum of averages, sum of variance, sum of entropy, and differences in entropy. However, the best parameters for differentiating patients with clinical clicking symptoms were the sum of squares and the sum of the averages, with AUC values ??of 0.815 and 0.786, respectively.
The imaging characteristics of signal change measure the homogeneity of the grey-level distribution of the image in MRI examinations [7,17], and the results demonstrated that the AT parameters, sum of squares and difference of variance can be used to classify the signal change.
Joint effusion refers to the accumulation of fluid in a joint. The most common is an increase in the joint fluid itself due to an inflammatory response, which changes the amount of local variation in the grey levels. This term is used to designate a hyperintense signal (brightness) on the T2 sequence observed within a joint on MRI [22]. AT contrast was the only parameter capable of diagnosing stroke in the joints of patients with TMD.
The association of certain AT parameters with clinical and MR data showed that AT can accurately diagnose TMJ. With the evolution of software systems that use artificial intelligence, it will be possible, in the near future, to use the predictive capacity of AT to help professionals make decisions regarding the treatment of TMDs.
Conclusions, Limitations & Recommendations
The results suggest that articular disc texture analysis improves the accuracy of TMD diagnosis and distinguishes clinical and imaging characteristics.
Among the limitations of this study, we can highlight that texture analysis was performed only on a single section, which may not have involved the most characteristic section of the articular disc change. Furthermore, to perform texture analysis using the Mazda software, images in the DICOM format were converted to BMP, thereby decreasing the resolution. However, there is abundant information that in this format is not perceptible in the visual analysis (which distinguishes approximately 64 grey levels) [23]. Future studies should be conducted to validate our findings and clearly demonstrate which AT parameters are associated with the clinical and imaging characteristics of the TMJ in patients with TMD.


