Can we identify a Surface Phenotype and Prediction Model for Obstructive Sleep Apnoea? A case-Control Study
- . Centre for Oral Bioengineering, Institute of Dentistry, Queen Mary University of London, London, United Kingdom
Summary
Obstructive Sleep Apnoea (OSA) remains relatively underdiagnosed and associated with significant comorbidity. The present study aimed to explore the existence of a surface facial-cervical phenotype, prediction model and the presence of a surface marker for adults with OSA. A hospital-based prospective case-control study design was adopted, with 118 middle-aged Caucasian males (56 controls and 62 OSA subjects) recruited. Each subject underwent a clinical examination and overnight sleep study to confirm their grouping. Stereophotography provided a reliable 3-dimensional surface facial-cervical measurement technique, with multilevel statistical analysis performed. A surface facial-cervical & clinical phenotype was identified for OSA, with the predominant characteristics being: a short and enlarged neck circumference (p < 0.001), large mandibular width (p < 0.001), forward head posture (p < 0.001), increased lower facial height [P < 0.002]; increased sleep apnoea clinical scores; high BMI and aggregated Mallampati score (class 3 and 4; p < 0.001).The regression model of surface and clinical variables optimally predicted (area under receiver operator curve, AUC = 0.82), with a high positive likelihood ratio (LR + 6.02). The surface model not only successfully identified OSA subjects from controls (AUC = 0.77) but also presented as a marker. A surface phenotypic pattern, predictive model and marker for OSA in Caucasian men, was identified.
Keywords
Sleep Apnoea; Facial Phenotype; Prediction
Introduction
Obstructive Sleep Apnoea (OSA) is considered a major healthcare problem in the UK, being the 3rd most common respiratory breathing disorder. It is a significantly underdiagnosed and treated sleep disorder with health economic impacts, with an estimated 330,000 OSA adults presently treated out of a potential 1.5 million sufferers in the UK, with an estimated 4-10% of middle-aged men affected [1]. Furthermore, the prevalence of OSA is increasing as the frequency and severity of obesity is increasing in advanced countries [2,3]. More recently, the predictive prevalence for OSA in the UK has been estimated in relation to the frequently associated risk factors: male gender, age, obesity, diabetes, and hypertension, with areas of relatively high predicted prevalence estimates being Wales, the North East and large parts of East Anglia and Lincolnshire [4]. The consequences of untreated OSA are daytime sleepiness, increased cardiovascular morbidity and mortality, motor vehicle accidents and reduced quality of life [5,6].
To date, overnight Polysomnography (PSG) has been regarded as the ‘gold standard’ diagnostic method for OSA. However, the total number of identified sleep units in the UK is 289, with only 50 centres offering polysomnography, which is equivalent to one centre for every 1.25 million citizens. Hence, there remains a need for a practical low-cost clinical utility to aid clinicians in addressing the significant under diagnosis. The overall aims of the proposed current study were therefore to identify any markers which could offer such a pre-screening tool for identification of OSA and facilitate initial evaluation of suspected OSA subjects.
Based on the available systematic reviews [7,8], surface and skeletal phenotypes exist. However, the strength of these findings was limited by the heterogeneity of the studies precluding the identification of a clear phenotype. The present case-control study design was adopted to address the current limitations and to identify the existence of a surface facial-cervical phenotype in adults with OSA. The current study therefore aimed to explore the following objectives:
1. To identify OSA subjects from their surface facial-cervical morphology (phenotype).
2. To predict the presence of OSA from clinical and surface facial-cervical features.
3. To explore the presence of a surface facial marker for OSA.
Materials and Methods
Ethical approval (Ref: 16/LO/0554) and written informed consent was obtained. A Hospital-based case-control study design was conducted with 118 middle-aged Caucasian males (56 controls and 62 OSA subjects) based on confirmed absence or presence of OSA (AHI cut off value of 5 events/hour), were recruited between September 2016 and April 2018. A sample size estimation, based on surface parameters, was performed, utilising data extracted from a previous study [9]. It was not appropriate to involve patients or the public in the design, or conduct of our research but we do plan to involve them in the dissemination of the findings through patient Trusts involved in sleep apnoea.
Pre-Screening Questionnaires and Anthropometric Measurements
All subjects were invited to complete a pre-screening questionnaire and underwent clinical examination, which included: Epworth sleepiness scale [10], sleep apnoea clinical score [11,12], body mass index, neck circumference and Mallampati airway classification [13,14]. These were assessed against the confirmed diagnosis of OSA (AHI ≥ 5) to evaluate the predictive capacity of any developed clinical markers.
Home-Based Overnight Sleep Study
Rather unique to the present study, all control subjects underwent a limited overnight sleep study (Grey Flash MASIMO SET®, Stowood Scientific Instruments Ltd, Oxford, UK) at home, over two consecutive nights, quantifying the presence or absence of OSA (AHI < 5 events/hours). Each sleep study was independently verified and scored by a qualified sleep technician (SW).
Stereophotogrammetry
All subjects underwent 3-dimensional surface stereophotogrammetry, using a novel technique for the registration of head position during image acquisition [15]. The surface structures were assessed using 3dMDvultus software (Figure 1). In total, 36 surface variables were analysed including linear, angular measurements and proportions.
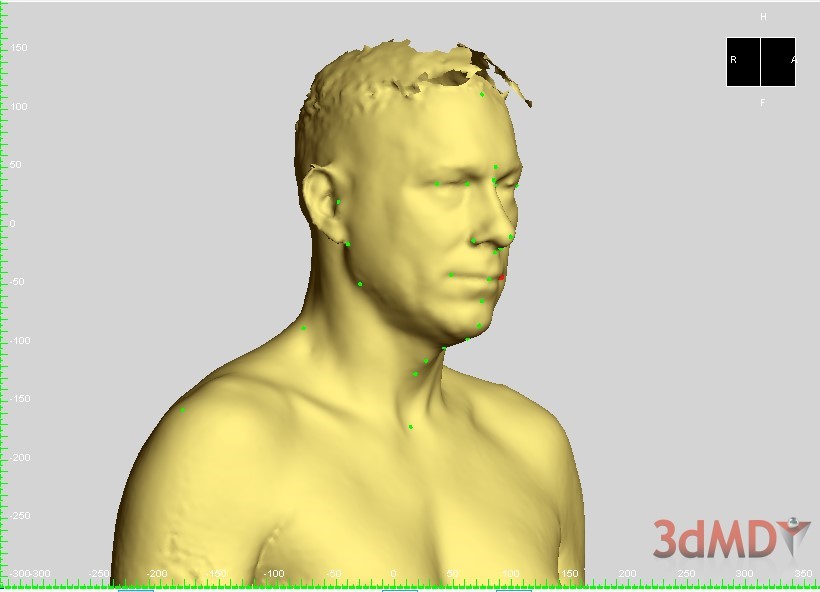
Figure 1: Stereophotogrammetry (3dMdtorso).
Statistical Analysis Plan
The data was collected at three different regions including face, neck and body. The principle interest was to assess each variable separately and its relationship with the dependent variable (OSA). The statistical analysis was performed using JMP®, Version 11 (SAS Institute Inc.). To avoid the 5% probability of type I error to accumulate repeatedly, the significant criteria for surface variables were corrected, using Bonferroni correction criteria (dividing the critical p value by the number of comparisons). (Figure 2) presents the main milestones of the analysis plan.
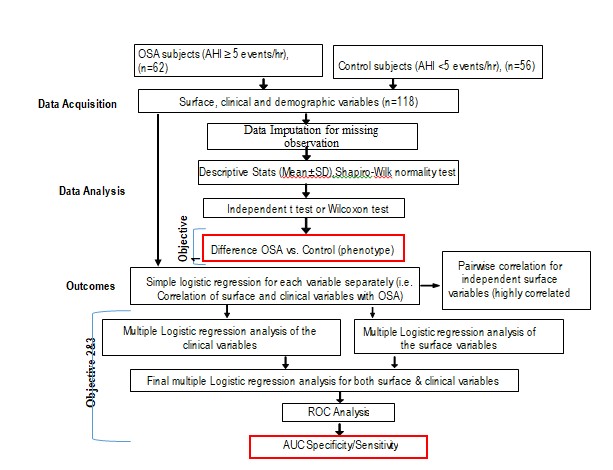
Figure 2: Statistical analytic path for case-control study. ROC, receiver operating characteristic curve; AUC, area under the ROC (AUC).
Results
A total of 151 subjects were screened for suitability of inclusion, with 132 enrolling in the current case-control study. The percentage of dropout (n = 10) and missing data (n = 4) was 10.6%. A further 2 participants demonstrated imaging artefacts and were excluded from the analyses. Therefore, the final sample size was 118 subjects, of which 56 were controls and 62 OSA subjects.
Clinical Phenotype
A significant difference was observed between the OSA and control groups in terms of both demographic and clinical characteristics. All apart from height, ESS, overjet, overbite, and number of missing teeth, were reported to be significant. The OSA group was found to be older, with a higher BMI, weight and SACS scores than the control group (Table 1). In addition, there was a significant difference (p < 0.001) in the Mallampati Airway Classification (MAC) between OSA and control groups, having higher classification scores in the OSA group (class 3, 48.39%; class 4, 40.32%). As class 1 and 2 were small and homogenous and different from class 3 and 4, the MAC was subsequently collapsed into two categories .The aggregated scores (class 3 and 4) for MAC was found to be significantly higher in the OSA group, when compared to the control group (Table 2).
Table 1: Comparison between the demographic and clinical variables of the OSA (n = 62) and controls (n = 56) subjects.
|
Variables |
Group |
N |
Mean |
SD |
S.E Mean |
P > |t| |
W |
P < W |
χ2 |
P > χ2 |
||||
|
Age (years) |
OSA |
62 |
53.57 |
7.74 |
0.98 |
Difference |
3.37 |
t Ratio |
2.53 |
0.013 |
0.97 |
0.020 |
4.93 |
0.03 |
|
Control |
56 |
50.21 |
6.68 |
0.89 |
Std Err Dif |
1.33 |
DF |
115.77 |
|
|
||||
|
Height (cm) |
OSA |
62 |
177.87 |
6.69 |
0.85 |
Difference |
0.31 |
t Ratio |
0.25 |
0.804 |
0.99 |
0.730 |
|
|
|
Control |
56 |
177.56 |
6.81 |
0.91 |
Std Err Dif |
1.24 |
DF |
114.33 |
|
|
||||
|
Weight (kg) |
OSA |
62 |
97.39 |
17.83 |
2.26 |
Difference |
11.65 |
t Ratio |
4.27 |
< 0.001 |
0.95 |
< 0.001 |
14.15 |
< 0.001 |
|
Control |
56 |
85.74 |
11.35 |
1.52 |
Std Err Dif |
2.73 |
DF |
104.67 |
|
|
||||
|
BMI |
OSA |
62 |
30.71 |
4.77 |
0.61 |
Difference |
3.68 |
t Ratio |
5.14 |
< 0.001 |
0.95 |
< 0.001 |
20.94 |
< 0.001 |
|
Control |
56 |
27.04 |
2.85 |
0.38 |
Std Err Dif |
0.72 |
DF |
101.19 |
|
|
||||
|
ESS |
OSA |
62 |
8.85 |
5.69 |
0.72 |
Difference |
1.46 |
t Ratio |
1.58 |
0.116 |
0.97 |
0.004 |
1.46 |
0.23 |
|
Control |
56 |
7.39 |
4.30 |
0.57 |
Std Err Dif |
0.92 |
DF |
112.58 |
|
|
||||
|
SACS |
OSA |
62 |
17.18 |
10.91 |
1.39 |
Difference |
9.01 |
t Ratio |
5.52 |
< 0.001 |
0.89 |
< 0.001 |
29.88 |
< 0.001 |
|
Control |
55 |
8.16 |
6.41 |
0.86 |
Std Err Dif |
1.63 |
DF |
100.48 |
|
|
MI, Body Mass Index; ESS, Epworth sleepiness scale ranges from 0 to 24; SACS, sleep apnoea clinical score ranges from 0 to 110; OJ, overjet; OB, overbite; t, T-test; W, Shapiro-Wilk Test; χ2, Wilcoxon rank-sum test; MD, mean difference; Std Err Dif, Standard error of the difference; cm, centimetre; kg, kilogram.
Table 2: Differences between the aggregated Mallampati airway classification (MAC) for OSA (n = 62) and controls (n = 56) subjects.
|
N |
Class 1and 2 |
Class 3 and 4 |
N |
|
Row % |
|||
|
OSA |
7 |
55 |
62 |
|
11.29 |
88.71 |
||
|
Control |
29 |
27 |
56 |
|
51.79 |
48.21 |
||
|
N |
36 |
82 |
118 |
|
DF |
Χ2 |
Prob > Χ2 |
|
|
118 |
1 |
22.76 |
< 0.001 |
Surface Phenotype
As 36 surface variables were estimated separately using the t test, the Bonferroni correction was considered (Bonferroni, 1936), to avoid the 5% probability of type I error to accumulate repeatedly. Therefore, the highly significant criteria for surface variables were corrected, dividing the critical p value by the number of comparisons (0.05/36 = 0.0013). From the 36 surface variables, only seven were considered significant predictors. Neck circumference differed most significantly between the OSA and control groups, followed by neck height/circumference ratio, mandibular width, mandibular width ratio and C7-midtragus and neck height (p < 0.001), (Table 3).
Table 3: Comparison between significant surface variables for OSA (n = 62) and controls (n = 56) subjects.
|
Variables |
Group |
N |
Mean |
SD |
S.E Mean |
P > |t| |
W |
P < W |
χ2 |
P > χ2 |
||||
|
Age (years) |
OSA |
62 |
53.57 |
7.74 |
0.98 |
Difference |
3.37 |
t Ratio |
2.53 |
0.013 |
0.97 |
0.020 |
4.93 |
0.03 |
|
Control |
56 |
50.21 |
6.68 |
0.89 |
Std Err Dif |
1.33 |
DF |
115.77 |
|
|
||||
|
Height (cm) |
OSA |
62 |
177.87 |
6.69 |
0.85 |
Difference |
0.31 |
t Ratio |
0.25 |
0.804 |
0.99 |
0.730 |
|
|
|
Control |
56 |
177.56 |
6.81 |
0.91 |
Std Err Dif |
1.24 |
DF |
114.33 |
|
|
||||
|
Weight (kg) |
OSA |
62 |
97.39 |
17.83 |
2.26 |
Difference |
11.65 |
t Ratio |
4.27 |
< 0.001 |
0.95 |
< 0.001 |
14.15 |
< 0.001 |
|
Control |
56 |
85.74 |
11.35 |
1.52 |
Std Err Dif |
2.73 |
DF |
104.67 |
|
|
||||
|
BMI |
OSA |
62 |
30.71 |
4.77 |
0.61 |
Difference |
3.68 |
t Ratio |
5.14 |
< 0.001 |
0.95 |
< 0.001 |
20.94 |
< 0.001 |
|
Control |
56 |
27.04 |
2.85 |
0.38 |
Std Err Dif |
0.72 |
DF |
101.19 |
|
|
||||
|
ESS |
OSA |
62 |
8.85 |
5.69 |
0.72 |
Difference |
1.46 |
t Ratio |
1.58 |
0.116 |
0.97 |
0.004 |
1.46 |
0.23 |
|
Control |
56 |
7.39 |
4.30 |
0.57 |
Std Err Dif |
0.92 |
DF |
112.58 |
|
|
||||
|
SACS |
OSA |
62 |
17.18 |
10.91 |
1.39 |
Difference |
9.01 |
t Ratio |
5.52 |
< 0.001 |
0.89 |
< 0.001 |
29.88 |
< 0.001 |
|
Control |
55 |
8.16 |
6.41 |
0.86 |
Std Err Dif |
1.63 |
DF |
100.48 |
|
|
Surface Facial-Cervical Predictors
The above surface risk factors (phenotype) were critically and bi-directionally analysed. The multivariate analysis of the surface predictors of OSA, applying multiple logistic regression modelling, confirmed the role of surface variables alone in OSA prediction. Under the assumption of equal consequences (cost) for false predictions, the area under the receiver operating characteristic curves (AUC), sensitivity and specificity were 77%, 56% and 88%, respectively (Model 1, Table 4). Nevertheless, a combination model of clinical and surface variables (Model 3, Table 4) showed that both clinical and surface variables were good predictors and could be an alternative or interchangeable measure in OSA prediction (AUC = 82%, sensitivity = 65% and specificity = 89%, Figure 3). The prior probability (odds) of OSA in the current study was 53% (1.1). The surface and clinical model (model 3) had the largest positive likelihood ratio (LR+; 6.02), which indicates a 6-fold increase in the odds of having OSA condition in a patient with a positive test result. In contrast, the smaller the negative likelihood ratio (LR–), the more significantly reduced was the probability of OSA. For example, clinical model (model 1) had the lowest LR– (0.23), which decreased in the odds of having OSA condition in a patient with a negative test.
Discussion
The current case-controlled study includes OSA and control groups, of the same gender and ethnicity, being male and Caucasian (100%), and represents the first attempt to minimise any morphological variations in relation to the gender and ethnicity. The study identified a strong predictive model and marker for OSA in Caucasian men, using a surface 3D-imaging modality importantly, no previous investigation has ruled out the possibility of OSA (AHI < 5/hr) using an objective tool (overnight sleep studies) for two consecutive nights within the control group, relying on self-reports only. Hence, the results are more likely to be representative of a male Caucasian population.
In the current study, only the Mallampati Airway Classification (MAC) and Sleep Apnoea Clinical Score (SACS) were found to be significant clinical predictors for OSA, with no contribution from BMI and age in the model prediction. This is probably because the SACS tool included three important risk factors: witnessed apnoea, hypertension and neck circumference. In addition, a high classification of MAC score would reflect the large size of the tongue or presence of pharyngeal crowding. In accordance with our findings, Prasad, et al. [16] found SACS had the highest positive likelihood ratio (LR+, 5.6) and positive predictive value (PPV, 95.2%) among the most frequently used sleep questionnaires. Unsurprisingly, aggregated scores for the MAC (class 3 and 4) were found to be significantly higher in OSA group, when compared to control group. This finding is in accordance with a recent digital morphometric study by Schwab, et al. [17,18], who found a high Mallampati score (score 4) to be strongly associated with severe OSA, with or without controlling for age, race, gender or BMI. In the current study, the OSA group was phenotypically distinguishable from the control group in the following surface variables: neck circumference and neck height/circumference ratio, mandibular width, mandibular width ratio, C7-midtragus and neck height. A systematic review by Agha and Johal [7] found both neck circumference and mandibular width were larger in the OSA group, when compared to controls. However, the higher value of the body mass index presented in the current study could have confounded the actual relationship between them and OSA.
Similarly, Perri, et al. [9] found a larger mandibular and facial width in the OSA group (p < 0.01). In addition, the present study also found neck height to be significantly shorter in the OSA group, although there is no current data suggesting a short neck might predict OSA. Punati, et al. [19] found a non-significant association between laryngeal height and AHI (p = 0.69). However, laryngeal height was measured directly instead of actual neck height, which reflects the distance between thyroid cartilage and suprasternal notch. Moreover, the dichotomous classification of neck circumference and laryngeal length, with a cut off of 40 cm and 4 cm respectively, made the size of the sample very small. Therefore, the authors’ suggestion for not considering the short neck as a predictor for OSA should be interpreted with caution [19]. Concerning vertical facial relations, in the current case-control study, an increased lower facial height was found in OSA subjects, when compared with controls. This finding is in accordance with previous studies [8-20]. Lee, et al. [21] found a photographic model classified 76.1% of the subjects correctly with Positive Predictive Value (PPV) and Negative Predictive Value (NPV) of 78.4% and 70.9% respectively. Similarly, the surface model in the current study discriminated 71% of the subjects successfully with positive predictive value and negative predictive value of 83% and 64%, respectively [22].
Table 4: Comparison of the performance of the logistic regression model (numbers 1-3) for prediction of OSA [AHI ≥ 5].
|
Logistic regression models |
n |
|
AUC |
Pb cut |
Sv% |
SP% |
AC% |
PPV % |
NPV % |
FPR % |
FNR % |
LR+ |
LR – |
|
Model 1 – Clinical |
2 |
|
0.82 |
0.52 |
84 |
70 |
77 |
75 |
80 |
30 |
16 |
2.76 |
0.23 |
|
Model 2 – Surface |
3 |
|
0.77 |
0.62 |
56 |
88 |
71 |
83 |
64 |
13 |
44 |
4.52 |
0.50 |
|
Model 3 – Surface and clinical |
2 |
|
0.82 |
0.67 |
65 |
89 |
76 |
87 |
69 |
11 |
35 |
6.02 |
0.40 |
N: Number of predictors; AUC: Area Under The Curve of the Receiver Operating curve; Pb cut: Probability cut off ; Sv, Sensitivity (true positive/true positive plus false negative); SP, Specificity (true negative/true negative plus false positive); AC: Accuracy, correct classification ([true positive+true negative]/total number of the sample).; PPV: Positive Predictive Value (true positive/[true positive+false positive]); NPV: Negative Predictive Value [negative+false negative]); FPR: False Positive Rate or Fall Out (1-specificity); FNR: False Negative Rate or Miss Out (1-sensitivity); LR+: Positive Likelihood Ratio (sensitivity/1-specificity); LR–: Negative Likelihood Ratio (1-sensitivity/ specificity).
(a) (b)
![Figure 3: Prediction of OSA by surface & clinical variables a) Receiver operating characteristic [ROC] curve for backward logistic regression [model 3] for surface and clinical variables with area under the curve [AUC] of 0.82. b) Box plot showing logistic regression model score for OSA subjects and controls. A cut-off value of 0.67 (red line, b) produced 65% sensitivity and 89% specificity for identification of OSA patients with an AHI?5 events/hour. Prediction formula; Prob [OSA] = 1 / (1 + Exp (- ((-7.88) + 0.23 * BMI + 1.88 * MAC))).](https://www.jscimedcentral.com/public/assets/images/uploads/image-1732780596-1.jpg)
![Figure 3: Prediction of OSA by surface & clinical variables a) Receiver operating characteristic [ROC] curve for backward logistic regression [model 3] for surface and clinical variables with area under the curve [AUC] of 0.82. b) Box plot showing logistic regression model score for OSA subjects and controls. A cut-off value of 0.67 (red line, b) produced 65% sensitivity and 89% specificity for identification of OSA patients with an AHI?5 events/hour. Prediction formula; Prob [OSA] = 1 / (1 + Exp (- ((-7.88) + 0.23 * BMI + 1.88 * MAC))).](https://www.jscimedcentral.com/public/assets/images/uploads/image-1732780618-1.jpg)
The surface model alone successfully identified controls from OSA subjects (AUC = 0.77) and presented as a valuable clinical marker (neck height and circumference). However, the combined model of surface and clinical predictors was able to identify true positive subjects. Of note was the fact that surface measurements were absent in the final backward model. This would suggest that the clinical and surface measurements could simply act as alternatives or substitutes, such as BMI and neck circumference. On the other hand, general obesity may conceal the facial surface features in OSA subjects. Furthermore, only linear and angular measurements and ratios were included in the current study. Therefore, alternative measurements could be included in future evaluations, such as mandibular and submandibular areas, mean of the average face and arc length.
Conclusion
This case-controlled study demonstrated the existence of a surface phenotypic pattern, identified a strong predictive model and marker for OSA in Caucasian men, using a surface 3D-imaging modality. Subject classification improved when we take account of both the clinical and surface anatomical feature.
Acknowledgements
The authors wish to acknowledge The Respiratory team for their support with patient recruitment and Mr Stephen Williams for his assistance with the scoring and verification of the overnight sleep studies.
References
- Rejón-Parrilla JC, Garau M, Sussex J. Obstructive Sleep Apnoea Health Economics Report. 2014.
- Young T, Palta M, Dempsey J, Skatrud J, Weber S, Badr S. The occurrence of sleep-disordered breathing among middle-aged adults. N Engl J Med. 1993; 328: 1230-1235. doi: 10.1056/NEJM199304293281704. PMID: 8464434.
- Peppard PE, Young T, Barnet JH, Palta M, Hagen EW, Hla KM. Increased prevalence of sleep-disordered breathing in adults. Am J Epidemiol. 2013; 177: 1006-1014. doi: 10.1093/aje/kws342. Epub 2013 Apr 14. PMID: 23589584; PMCID: PMC3639722.
- Steier J, Martin A, Harris J, Jarrold I, Pugh D, Williams A. Predicted relative prevalence estimates for obstructive sleep apnoea and the associated healthcare provision across the UK. Thorax. 2014; 69: 390-392. doi: 10.1136/thoraxjnl-2013-203887. Epub 2013 Sep 23. PMID: 24062427.
- Caples SM, Kara T, Somers VK. Cardiopulmonary consequences of obstructive sleep apnea. Semin Respir Crit Care Med. 2005; 26: 25-32. doi: 10.1055/s-2005-864208. PMID: 16052415.
- Young JW, McDonald JP. An investigation into the relationship between the severity of obstructive sleep apnoea/hypopnoea syndrome and the vertical position of the hyoid bone. Surgeon. 2004; 2: 145-151. doi: 10.1016/s1479-666x(04)80075-1. PMID: 15570816.
- Agha B, Johal A. Facial phenotype in obstructive sleep apnea-hypopnea syndrome: a systematic review and meta-analysis. J Sleep Res. 2017; 26: 122-131. doi: 10.1111/jsr.12485. Epub 2016 Dec 26. PMID: 28019049.
- Neelapu BC, Kharbanda OP, Sardana HK, Balachandran R, Sardana V, Kapoor P, et al. Craniofacial and upper airway morphology in adult obstructive sleep apnea patients: A systematic review and meta-analysis of cephalometric studies. Sleep Med Rev. 2017; 31: 79-90. doi: 10.1016/j.smrv.2016.01.007. Epub 2016 Jan 30. PMID: 27039222.
- Perri RA, Kairaitis K, Cistulli P, Wheatley JR, Amis TC. Surface cephalometric and anthropometric variables in OSA patients: statistical models for the OSA phenotype. Sleep Breath. 2014; 18: 39-52. doi: 10.1007/s11325-013-0845-0. Epub 2013 Apr 13. PMID: 23584845.
- Johns MW. A new method for measuring daytime sleepiness: the Epworth sleepiness scale. Sleep. 1991; 14: 540-545. doi: 10.1093/sleep/14.6.540. PMID: 1798888.
- Flemons WW, Whitelaw WA, Brant R, Remmers JE. Likelihood ratios for a sleep apnea clinical prediction rule. Am J Respir Crit Care Med. 1994; 150: 1279-1285. doi: 10.1164/ajrccm.150.5.7952553. PMID: 7952553.
- Hora F, Nápolis LM, Daltro C, Kodaira SK, Tufik S, Togeiro SM, et al. Clinical, anthropometric and upper airway anatomic characteristics of obese patients with obstructive sleep apnea syndrome. Respiration. 2007; 74: 517-524. doi: 10.1159/000097790. Epub 2006 Dec 5. PMID: 17148934.
- Mallampati SR, Gatt SP, Gugino LD, Desai SP, Waraksa B, Freiberger D, et al . A clinical sign to predict difficult tracheal intubation: a prospective study. Can Anaesth Soc J. 1985; 32: 429-434. doi: 10.1007/BF03011357. PMID: 4027773.
- McMillan A, Bratton DJ, Faria R, Laskawiec-Szkonter M, Griffin S, Davies RJ, et al. A multicentre randomised controlled trial and economic evaluation of continuous positive airway pressure for the treatment of obstructive sleep apnoea syndrome in older people: PREDICT. Health Technol Assess. 2015; 19: 1-188. doi: 10.3310/hta19400. PMID: 26063688; PMCID: PMC4780948.
- Agha, B., Zou, L. and Johal, A. Three-dimensional Evaluation of Head and Body Posture in Adults with Sleep Apnoea: A Methodological Study. International Association for Dental Research (IADR) 2019, Vancouver Convention Centre, June 19-22, 2019, Conference abstract No. 0117.
- Prasad KT, Sehgal IS, Agarwal R, Nath Aggarwal A, Behera D, Dhooria S. Assessing the likelihood of obstructive sleep apnea: a comparison of nine screening questionnaires. Sleep Breath. 2017; 21: 909-917. doi: 10.1007/s11325-017-1495-4. Epub 2017 Apr 1. PMID: 28365841.
- Schwab RJ, Leinwand SE, Bearn CB, Maislin G, Rao RB, Nagaraja A, et al. Digital Morphometrics: A New Upper Airway Phenotyping Paradigm in OSA. Chest. 2017; 152: 330-342. doi: 10.1016/j.chest.2017.05.005. Epub 2017 May 17. PMID: 28526655; PMCID: PMC5577353.
- Senaratna CV, Perret JL, Lodge CJ, Lowe AJ, Campbell BE, Matheson MC, et al. Prevalence of obstructive sleep apnea in the general population: A systematic review. Sleep Med Rev. 2017; 34: 70-81. doi: 10.1016/j.smrv.2016.07.002. Epub 2016 Jul 18. PMID: 27568340.
- Punati M, Saxena M, Daskalakis SD, Mangione M, Grewal M, Ritu, G. Does A Short, Thick Neck Predict Obstructive Sleep Apnea?: The Role of Physical Examination in OSA Screening. 2016.
- Lowe AA, Fleetham JA, Adachi S, Ryan CF. Cephalometric and computed tomographic predictors of obstructive sleep apnea severity. Am J Orthod Dentofacial Orthop. 1995; 107: 589-595. doi: 10.1016/s0889-5406(95)70101-x. PMID: 7771363.
- Lee RW, Petocz P, Prvan T, Chan AS, Grunstein RR, Cistulli PA. Prediction of obstructive sleep apnea with craniofacial photographic analysis. Sleep. 2009; 32: 46-52. PMID: 19189778; PMCID: PMC2625323.
- Young JW, McDonald JP. An investigation into the relationship between the severity of obstructive sleep apnoea/hypopnoea syndrome and the vertical position of the hyoid bone. Surgeon. 2004; 2: 145-151. doi: 10.1016/s1479-666x(04)80075-1. PMID: 15570816.


