Transient Pressure Field of Ho:YAG Laser Pulse for Lithotripsy
- 1. Stanford University, Stanford, USA
- 2. Boston Scientific Corporation, USA
Abstract
For almost 25 years, the lamp-pumped Chromium (Cr3+), Thulium (Tm3+), Holmium (Ho3+) tripledoped yttrium aluminum garnet (CTH:YAG or Ho:YAG) laser has been commercialized for ureteroscopic laser lithotripsy (URSL). However, the transient pressure field profile of the vapor bubbles that arise from laser pulses has not been reported. The transient pressure field of different laser pulses provides further insight into understanding stone ablation and retropulsion. The objective of this study is to measure the transient pressure field profile of the vapor bubbles of standard and custom laser modes of a prototype CTH: YAG laser. The transient pressure field is measured by a hydrophone, and the measurements are taken at various locations from the laser fiber tip. The transient pressure field profiles were successfully measured and constructed with mechanical hydrophones. The maximum transient pressure reached 5.4 MPa for the reference laser and 2.9 MPa for the prototype laser. The transient pressure of the prototype laser’s Standard mode has the highest value, followed by the Fragmenting mode and then the Dusting mode. The study demonstrated that the optical hydrophone is not adequate for measuring laser-induced transient pressure in water because of its lower sensitivity and distorted signal caused by the laser-generated vapor bubble. The transient pressure field profiles were successfully measured and constructed with mechanical hydrophones. The maximum transient pressure reached 5.4 MPa for the reference laser and 2.9 MPa for the prototype laser (Disclaimers: Bench Test results may not necessarily be indicative of clinical performance. The testing was performed by or on behalf of BSC. Data on file. Concept evice or technology. Not available for sale)
Keywords
Transient Pressure Field ; Hydrophone; Laser Lithotripsy; Ho:YAG; Vapor Bubble; Stone Ablation; Stone Retropulsion
Cite this article
Multani GP, Zhang JJ (2022) Transient Pressure Field of Ho:YAG Laser Pulse for Lithotripsy. J Urol Res 9(2): 1134
INTRODUCTION
The Ho:YAG laser has been the favored lithotripter for the treatment of urinary calculus since shortly after its introduction in the 1990s [1-2], because it can fragment all calculus compositions and produces less calculus migration (retropulsion) during treatment than the short-pulsed lasers [3]. Although the lamp-pumped Ho:YAG laser has been commercialized for ureteroscopic laser lithotripsy (URS) for almost 25 years, a commercially available Ho:YAG laser delivers large energy and short pulses that generate omnidirectional vapor bubbles, wasting a significant percentage of the input energy [4-8]. The Smart Modes of the prototype laser generate narrowly focused vapor bubbles that travel forward greater distances and deliver more energy to the target calculus. This may allow for improved ablation efficiency and minimal retropulsion.
The objective of this study was to construct the transient pressure field profiles of the vapor bubbles that are produced by the standard and smart modes of the prototype laser as well as the standard pulse of a commercially available Ho:YAG laser. In particular, we aim to further understand the influence of bubble dynamics (i.e., bubble shape, rate of energy injection, and bubble collapse) on stone ablation and retropulsion.
METHOD AND SETUP
Samples
A single sample fiber was used for the duration of this study in order to control for fiber performance. Note that the fiber tip was reconditioned between each laser test setting according to the protocol detailed in section 2.2. See Table 1 for test sample information. (Table 1)
Table 1: Test Sample Summary
| Part number | Name | Lot | Sample Count |
| R-LLF365 | SUREFLEX 365 LITHOTRIPSY REUSABLE FIBER | R-365-449A | 1 |
Sample Preparation and Conditioning
The sample fiber was manually cleaved at a minimum before and after each measurement cycle. The fiber performance was verified using a power meter. After ≥ 50 pulses, the average energy read by the power meter must fall within ± 20% of the set energy, 200mJ. If the statistic lies outside of this range, the fiber must be re-cleaved and measured again.
Measurement Equipment & Setup
The measurement equipment is listed below. See Figure 1 for the measurement setup. (Figure 1)
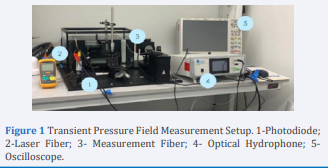
Figure 1: Transient Pressure Field Measurement Setup. 1-Photodiode; 2-Laser Fiber; 3- Measurement Fiber; 4- Optical Hydrophone; 5- Oscilloscope.
The large breadboard was set on the working bench, and the 5-gallon fish tank was placed into position defined by the clamps on the board. A smaller baseplate was set at the bottom of the fish tank for safety purposes, and the tank was subsequently filled with 4 gallons of distilled water. Both the laser fiber and the measurement fiber were secured in fiber holders on the baseplate and submerged in the tank. The photodiode was secured beside the tank, and the laser fiber was passed alongside the photodiode face and attached to the laser console.
The position of the laser fiber remained fixed throughout the data acquisition period. The measurement fiber was mounted on a 3D adjustable stage so its position could be calibrated according to the desired orientation for data acquisition. Three types of hydrophones were tested:
1) First measurement iteration: Onda HFO-690 Fiber Optic Hydrophone (pictured above).
2) Second measurement iteration: Onda HNS Needle Hydrophone, also known as the Müller- Platte probe.
3) Third measurement iteration: Onda HNR-0500 Series Hydrophone
Measurement Protocol
Before measurements could be taken, all four laser cavities were warmed up at ST 0.2J, 20Hz for 5 minutes.
Since an ellipse is fully defined by its major and minor axes, two measurement orientations were studied: perpendicular and parallel. In both instances, the fiber and sensor tips were placed 10mm apart (see Figure 2). This distance minimized damage to the sensor tip from the incident shockwave and aligned the sensor pointing at the action center of the vapor bubble collapse, which typically occurs ~ 0.5 mm away from the laser fiber tip. (Figure 2).
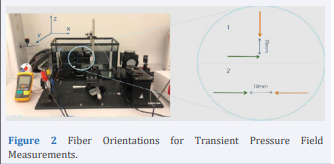
Figure 2: Fiber Orientations for Transient Pressure Field Measurements.
The 3D adjustable stage was used for alignment according to the following procedure:
1) For both orientations, the measurement sensor tip was misaligned with the laser fiber tip along the y-axis
2) The measurement sensor tip was positioned flush with the laser fiber tip along the z-axis (90°) or x-axis (0°)
3) Note that the sensor tip must not contact with the laser fiber to avoid damage
4) The reading along the z-axis (90°) or x-axis (0°) was taken, and 10mm (0.3937 inches) was added to the number
5) The measurement sensor was positioned to the desired location
6) The y- and z/x-axes were adjusted accordingly to align the aiming beam centering on the sensor face
All three modes of the prototype laser were tested with the default pulse width at the energies indicated in Table 2.
Table 2: Prototype Laser Settings
| Mode | 0.5 J | 1 J | 2 J | 3J |
| Standard-short | ||||
| Dusting | - | |||
| Fragmenting | - |
In total, each trial accumulated ~ 40 pulses, and the maximum voltage was recorded. A 1-sample t-test was performed using the maximum standard deviation amongst the data collected with the mechanical hydrophones. This difference was assumed to be 31%. At a significance level of α = 0.05, the required sample size was calculated to be n = 15 for the power of ~95%. Each laser pulse could generate more than one transient pressure spike, as shown in Figure 3. We record the maximum voltage spike for each of the 40 pulses and report the average of the Max as well. (Figure 3).
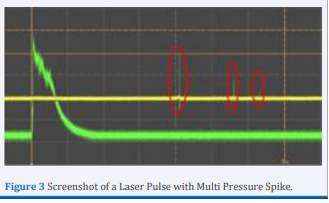
Figure 3: Screenshot of a Laser Pulse with Multi Pressure Spike
RESULTS
The measurement process went through several iterations to maximize the control environment and limit all confounding variables.
Fiber Optic Hydrophone
The low sensitivity of the fiber optic hydrophone (8.37 mV/MPa) presented several challenges. First, the fiber optic hydrophone sensor relies on the optical reflection feedback of the probe beam from the action center, but the laser pulse generated bubble is opaque to the visible detection beam, which can alter the probe beam feedback and interfere with the detection. Second, the sensor reached a detection limit as the transient pressure dropped below 1MPa. This was especially critical for the smart modes where the vapor bubble collapse is extended with much lower transient pressure. Third, the resulting waveforms confirmed a low signal-to-noise ratio despite the 10MHz low pass filter. The noise became even more excessive when the fibers were oriented parallel to one another since the sensor was now positioned in line with the incident beam. Fourth, there was high variation in the maximum voltages recorded between measurements trials, particularly those conducted on different days. Such inconsistency and lack of repeatability prompted the use of mechanical hydrophones with increased sensitivity.
Mechanical Hydrophones
The increased nominal sensitivities of the HNS needle (10 mV/ MPa) and the HNR-0500 (126 mV/MPa) hydrophones allowed for remarkable improvement in the signal-to-noise ratio. The resulting oscilloscope waveforms showed discernable transient pressure spikes, particularly at higher energies. As expected, the ambient noise was more prevalent in the parallel orientation. Since the HNS needle hydrophone has obvious tip wear and tear, we used the HNR-0500 hydrophone for all the transient pressure spikes measurements.
The Fourier Transform Analysis indicates that most of the spectral content is expected to lie within 1MHz. We can use the peak spectrum value for the sensitivity calibration of the hydrophone. Tables 3 and 4 are the measurement results in terms of MPa. Figure 4 includes examples of the Transient Pressure Field Ellipsoids. (Table 3 and 4) (Figure 4)
Table 3: Measurement Results of PROTOTYPE in Terms of MPa.
| Mode | Setting | Max-Max [MPa] | Min-Min [MPa] | Avg-Avg [MPa] | |||
| 0-deg | 90-deg | 0-deg | 90-deg | 0-deg | 90-deg | ||
| Prototype Standard | 0.5J | 2.2 | 2.9 | 0.3 | 0.2 | 0.8 | 1.0 |
| 1J | 1.9 | 1.3 | 0.0 | 0.1 | 0.4 | 0.3 | |
| 2J | 2.7 | 0.9 | 0.1 | 0.1 | 0.8 | 0.3 | |
| 3J | 1.4 | 1.1 | 0.0 | 0.0 | 0.3 | 0.2 | |
| Prototype Fragmenting | 1J | 0.8 | 0.7 | 0.0 | 0.0 | 0.2 | 0.1 |
| 2J | 1.6 | 1.2 | 0.1 | 0.1 | 0.4 | 0.3 | |
| 3J | 2.1 | 1.3 | 0.1 | 0.1 | 0.5 | 0.4 | |
| 1J | 0.8 | 0.6 | 0.0 | 0.1 | 0.1 | 0.2 | |
| Prototype Dusting | 2J | 0.5 | 0.6 | 0.0 | 0.0 | 0.1 | 0.1 |
| 3J | 0.9 | 0.8 | 0.0 | 0.1 | 0.2 | 0.2 | |
Table 4: Measurement Results of REFERENCE in Terms of MPa
| Mode | Setting | Max-Max [MPa] | Min-Min [MPa] | Avg-Avg [MPa] | |||
| 0-deg | 90-deg | 0-deg | 90-deg | 0-deg | 90-deg | ||
| Reference laser | 0.5J | 2.1 | 1.6 | 0.6 | 0.5 | 1.2 | 1.0. |
| 1J | 3.2 | 2.9 | 0.5 | 0.6 | 1.5 | 1.6 | |
| 2J | 3.7 | 5.2 | 0.7 | 0.6 | 1.6 | 2.2 | |
| 3J | 3.6 | 5.4 | 0.6 | 0.8 | 1.5 | 1.7 | |
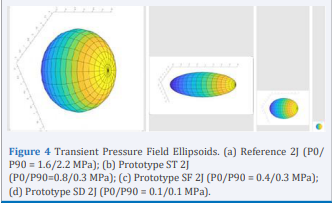
Figure 4: Transient Pressure Field Ellipsoids. (a) Reference 2J (P0/ P90 = 1.6/2.2 MPa); (b) Prototype ST 2J (P0/P90=0.8/0.3 MPa); (c) Prototype SF 2J (P0/P90 = 0.4/0.3 MPa); (d) Prototype SD 2J (P0/P90 = 0.1/0.1 MPa).
DISCUSSION
Peak power has a higher impact coefficient for stone retropulsion [9]. To minimize retropulsion while still reaching the ablation threshold, we must minimize the transient pressure by reducing the peak power. This is already achieved in part by the pulse modulation of the prototype Smart Modes
Bubble dynamics furthers our understanding of the dynamical laser-stone interaction during a surgical procedure. The bubble dynamics, including bubble shape, bubble size, and energy delivery distance of a commercial Ho:YAG laser was previously compared to the prototype laser. A summary of the data is provided in Table 5.
Table 5: Data Summary of Vapor Bubbles
| Energy (J) | 0.5 | 1 | 2 | 3 |
| Reference Length (mm) | 4.4 | 6.1 | 7.9 | 9.0 |
| References Height (mm) | 3.7 | 5.3 | 6.4 | 6.8 |
| Stardard Length (mm) | 4.5 | 5.3 | 8.0 | 8.6 |
| Standard Height (mm) | 3.5 | 3.6 | 4.8 | 4.7 |
| Fragmenting Length (mm) | 2.9 | 5.0 | 5.8 | |
| Fragmenting Height (mm) | 2.2 | 3.1 | 4.3 | |
| Dusting Length (mm) | 2.8 | 4.8 | 4.5 | |
| Dusting Height (mm) | 1.9 | 2.8 | 2.9 |
The laser pulse packet width controls the speed of the laser energy injection. The prototype laser- generated bubble tends to have an elongated shape (except the 0.5J pulse) with a much smaller size in the vertical direction (height) compared to that of the reference laser [10]. The smaller height at 3J compared to 2J can explain the lower transient pressure measurement result.
The transient pressure of the prototype standard mode at 0.5J has a higher value than at 1 J to 3 J pulses; this can be explained by the spherical nature of the 0.5J bubble. Its omnidirectional shape generates a high transient pressure peak at the collapse of the bubble. The elongated/elliptical/rod shape of the vapor bubble at 1 J to 3 J (because of pulse modulation) distorts the symmetryof the bubble and reduces the peak transient pressure at the collapse.
Figure 5 is a summary of all the bubble sizes. The prototype laser-generated bubbles all resemble elliptical/rod shapes, with much smaller dimensions compared to the reference lasergenerated bubbles, which can explain why the transient pressure value of the prototype laser is much lower. (Figure5)
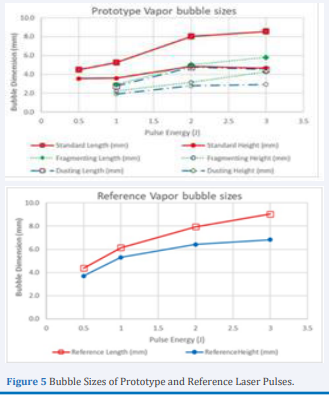
Figure 5: Bubble Sizes of Prototype and Reference Laser Pulses.
A commercial Ho:YAG laser delivers large energy pulses and high peak power that generates correspondingly large vapor bubbles. Since the vapor bubbles are omnidirectional, much of the injected energy is wasted and not directed towards stone ablation. The Smart Modes of the prototype laser generate increasingly focused vapor bubbles with longer water penetration tunnels. Dusting with a narrow and elongated vapor bubble delivers the laser pulse the furthest and therefore has the potential to improve efficiency within non-contact laser lithotripsy procedures.
CONCLUSION
The study demonstrated that the optical hydrophone is not adequate for measuring laser-induced transient pressure in water because of its lower sensitivity and distorted signal caused by the laser-generated vapor bubble. The transient pressure field profiles were successfully measured and constructed with mechanical hydrophones. The maximum transient pressure reached 5.4 MPa for the reference laser (Table 6) and 2.9 MPa for the prototype laser (Table 7).
Table 6: Maximum Transient Pressure of Reference Laser Mode.
| Laser mode | Max of Max (MPa) | Max of Avg (MPa) |
| Reference | 3.4 | 2.2 |
Table 7: Maximum Transient Pressure of Prototype Laser Modes.
| Laser mode | Max of Max (MPa) | Max of Avg (MPa) |
| Standard | 2.9 | 1.0 |
| Fragmenting | 2.1 | 0.6 |
| Dusting | 0.9 | 0.2 |
The transient pressure of the prototype laser’s Standard mode has the highest value, followed by the Fragmenting mode and then the Dusting mode.
DISCLAIMERS
Bench Test results may not necessarily be indicative of clinical performance. The testing was performed by or on behalf of BSC. Data on file. Concept device or technology. Not available for sale.
ACKNOWLEDGMENT
The authors thank Caroline Brial, Manjula Patel, John Goncalves, John Subasic, Jim Sarna, and Manuel Teixeira of BSC for laser experimental data collection, and Sam Howard of Onda Corp. for setup and calibration of the hydrophones. This study was previously presented at a conference in SPIE 2022 Photonics West BIOS [11].
REFERENCES
5. Peng S, Hasenberg T, Harrah T, Zhang JJ, Chai Dl, Kang HW. Numerical simulations of bubble dynamics in laser lithotripsy. Paper. 2020; 11212-14.
11.Gitanjali P Multani, Zhang JJ. Transient pressure field measurement of Ho:YAG laser pulse for lithotripsy. Presented at SPIE 11958, Optical Interactions with Tissue and Cells XXXIII and Advanced Photonics in Urology (2022)


