Equine Gait Analysis: New Techniques, Trials and Thinking
- 1. University of Copenhagen, PAS, Section for Physiology, Dept for Veterinary and Animal Sciences (IVH), Faculty of Health & Medical Sciences, Dyrlægevej 100, 1870 Frederiksberg C, Denmark; adh@sund.ku.dk
- 2. Equine Vet Practice, Livermore, CA, USA; isbelldvm@comcast.net
- 3. East Lansing, MI, & Corona Vista Equine Center, Michigan State University, East Lansing, USA; rmbphd@gmail.com
Abstract
Veterinary science has benefitted from technological advancements in the past and will hopefully continue to do so, especially in the field of equine gait analysis. There is a need for rapid and easy to use technology that is accurate and portable, but at the same time is also readily interpretable. This manuscript presents two new approaches to equine gait analysis, both of which are commercial devices. The use of Acoustic MyoGraphy (AMG) has been proven in the field of muscle function and performance as well as ligament health, but it can also provide details concerning gait when placed on the wall of the hoof of a horse. The TendibootTM system is a limb focused unit that can be easily attached, activated and used in a Veterinary clinic setting, rapidly providing gait details for equine diagnostic purposes. In conclusion this manuscript provides an insight into gait parameters from recent research trials that are novel and challenge current thinking.
KEYWORDS
- Horse; Acoustic Myography; Frog; Lameness; Foot
CITATION
Harrison A, Isbell D, Bowker R (2024) Equine Gait Analysis: New Techniques, Trials and Thinking. J Vet Med Res 11(3): 1275.
INTRODUCTION
The diverse gaits observed in equids have been described many times and are deemed to be a complex field of study [1]. Nevertheless, it is a particularly important field owing to the high occurrence of lameness in horses, which has been described by Mike Ross as “simply a clinical sign, a manifestation of pain or a mechanical defect, that results in a gait abnormality characterized by limping“ cited in Dyson [2]. Yet, whilst some prefer to highlight potential limitations of technology [Dyson 2014], others are of the opinion that technology has a place in the diagnosis of lameness, with the potential to improve a Veterinarian’s subjective evaluation of gait. Indeed, science has approached the topic of gait and lameness over the years with an array of techniques [3,4] attempting to dissect the complexities of joint range of motion, ground reaction force and adjustments through proprioception [5], all with a view to improving the gait assessment made by Veterinarians.
Motion analysis techniques have been used for at least the past 120 years, initially capturing moving images in 2 dimensions [6], but more recently measuring forces and motion in 3 dimensions along with other aspects of equine locomotion [4].
Pressure plates have also been used as a stand-alone means of measuring absolute stance time and relative peak vertical forces offering equine Veterinarians a mobile, cost-efficient and quick gait evaluation method for routine clinical use [7].
Whilst some approaches remain relatively superficial and subjective, others are more profound and derived, seeking to examine the underlying cause of locomotion and gait, to which end equine surface electro myography has been tried and tested in order to improve the sensitivity for identifying differences in muscle function associated with biomechanical changes during equine gait [8].
Some of the issues currently faced by modern innovative technology include ‘normal day-to-day variation’, conformational asymmetry and the often-limited number of quantified parameters [9]. Whilst each of the aforementioned approaches has added to our understanding of equine gait and biomechanics in some way, there remains a need for simple, non-invasive, sensitive yet reliable, readily useable and cost-effective techniques in the equine veterinary clinic. The aim of this paper has therefore been to present and assess two new technologies that may address some of these issues, as well as begin to infer potential physiological responses and events without invasion of the animal’s well-being.
MATERIALS AND METHODS
Animals
The measurements presented in this manuscript were carried out in accordance with the Helsinki Declaration. The owners of the horses used, gave their informed consent prior to the start of this study. In addition, this study was entirely non-invasive in its nature, and full ethical approval was gained from Copenhagen University Department of Patho- biological Sciences, Faculty of Health & Medical Sciences before the start of the trial. Subjects were recruited for the present study (Diane Isbell DVM; Livermore, USA, or Karoline Riis DVM; Hørsholm DK). The inclusion criteria were that horses were healthy and free of pain. All the horses were evaluated through manual palpation as well as a complete physical evaluation by a qualified and experienced veterinarian (DI; KR) and any horses exhibiting any pain responses were excluded from the study. Any observable lameness response was assessed in accordance with the published grimace scale [10].
Acoustic MyoGraphy
Acoustic myography (AMG) is a biomechanical method capable of recording energy waves generated in the equine limb as the result of foot impact [11-13]. AMG recordings were carried out with a CURO unit and CURO sensors (CURO-Diagnostics ApS, Denmark) and followed in real time on an iPad Air (Apple Inc, Cupertino, CA, USA) via the App “CURO Equine” and a dedicated data recording system that is freely available (https://www. curo-diagnostics.com/) and the details of which have been published [11,14,15]. Using this setup, it was possible for us to see the actual recordings while the horses were physically active. We used 20 mm sensors with a frequency recording range of 0.5 - 20 ± 0.5 kHz, and the sampling rate was 2 kHz. Recorded data was stored in the CURO unit and after completion of measurements transferred to the CURO software (https://app.myodynamik. com) for analysis.
Ultrasound-gel coated sensors were placed centrally on the dorsal hoof wall, as well as the sole of the foot (frog) the equine right fore-limb. The sensors on the sole of the foot were protected from surface damage by a thin layer of foam and a thin layer of leather which were taped into place (Figure 3). Horses were walked for approximately 5 minutes on a hard surface. Connecting cables from the sensors were connected to the CURO unit which was placed in a pouch mounted on a surcingle fastened to the horse. The sensors and the wires from the sensors were secured with a flexible adhesive bandage (Snøgg; Norway) (Figure 1).
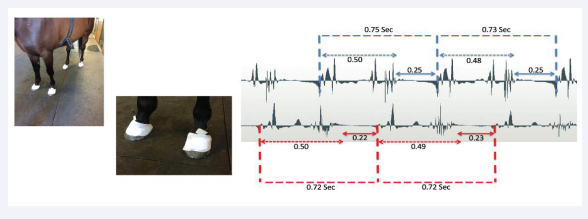
Figure 1: AMG hoof analysis. Left image; sensors on all four hoof walls. Middle image; close up of sensors held in place by the flexible adhesive bandage (Snøgg). Right image; AMG signal trace showing stride length and both stance as well as swing phases for the fore limbs. The values represent time in seconds.
It should be noted that whereas the shock wave of the GRF in the hoof wall and signals from the sole of the foot were recorded using the CURO sensors, they were not in any way quantified as to the degree of force to which they had been exposed, unlike the TendibootsTM system explained below, in which recordings of ground reaction forces for eachlimb, measured in Newtons, were accurately achieved.
TendibootsTM (Ekico)
The TendibootsTM were attached to the horses’ legs as per the manufacturer´s instructions (Ekico, France: https://youtu. be/1KlNZI qKU). They are held in place firmly by elastic straps and then connected by a Bluetooth link to a dedicated App on a smart device. The App setup page is shown (Figure 2; panel B).
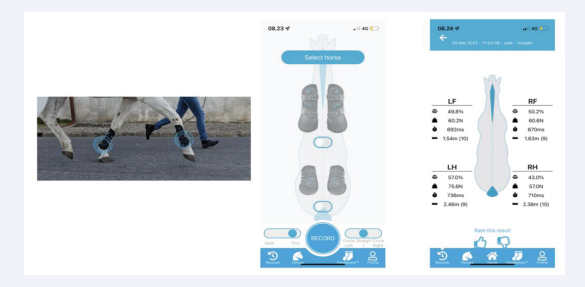
Figure 2: TendibootTM recordings using all four limb devices. Left image; TendibootTM sensors on the fore limbs of a horse as it is being exercised in a stright line and measured. Middle image; the App enables you to attach fore or hind limb, or all four limb TendibootTM sensors and connect to them using Bluetooth. Right image; A typical TendibootTM sensor results page revealing data about each limb with regards to force (Newtons), the stance phase (mSec), the stride length (meters) as well as providing an overall (left versus right) balance evaluation (%).
Analysis
The AMG data was analysed using the CURO data handling programme (CURO-Diagnostics ApS, Bagsværd, DK), giving the ESTiTM-score with its individual components Efficiency/ coordination (E-score) and fibre recruitment including both Temporal (T-score) and Spatial (S-score) summation, which are all mean values over a defined time interval [11,12]. The E-score measures the periods of activity relative to an overall recording period, hence it can be seen as representing efficiency or the degree of coordination [11,12]. The score value for each parameter is between 10 to 0, where a high score is considered optimal. The S- and T-scores were analysed to identify any changes that might occur with activity. This analysis examined the ratio between the S- (spatial summation) and T- (temporal summation) scores.
Statistical analysis
The data are presented as actual values in the figures. Since individual cases are presented in this manuscript rather than a cohort of subjects, there has been no statistical analysis performed.
RESULTS
AMG measurements of equine gait via the foot wall Using AMG sensors securely attached to the hoof wall with an adhesive bandage (Snögg, Norway), and with a thin layer of acoustic gel (thick ultrasound gel) between the sensor and the hoof wall, it was possible to detect the pressure waves generated by GRF upon impact of the foot with a hard surface (Figure 1). Detailed analysis of the data generated by the horse in the photograph (Figure 1) revealed that not only could stride length (sec) be determined, but it was also possible to ascertain the stance and swing phases. It was evident that whilst the horse had very similar stride lengths, lasting some 0.72-0.75 seconds in duration for a slow trot, and very similar stance phase times (0.48-0.50 seconds),the right front limb exhibited a slightly shorter swing phase (on average 0.22 versus 0.25 seconds; right versus left respectively). The cause of this slightly reduced swing phase for the right front limb was an earlier injury to the right side m.trapezius which mechanically affected protraction of that limb, resulting in the horse being retired from competition riding.
TendibootTM measurements of equine gait Whilst the AMG system can be used for gait analysis, there is a commercial system already on the market (TendibootsTM by Ekico, France). These accelerometer units are attached securely to the limbs of a horse and algorithms developed exclusively for this technology provide details to an App about the vertical ground reaction forces for each limb (Newtons), the stance phase (mSec) and the stride length (meters) as well as providing an overall (left versus right) balance evaluation (%). Thus for the horse presented (Figure 2) there is an example of how you set the App up but also data for a horse walking on a hard surface in a straight line. Note that the front limbs are very well balanced both in terms of GRF (60 Newtons) and both the stance phase (mSec) and stride length (meters). However, this technique revealed an imbalance in the hind limbs, where 57% of the weight is being distributed onto the left hind limb with a GRF of 75 Newtons, a longer stance time and stride length compared with the right hind limb. Such a measurement would suggest that this horse has an issue with its right hind limb, and is prefering to load the left hind whilst protecting the right hind-compensation for pain or injury.
AMG measurements of the hoof wall and frog More recently, a combined study of the use of AMG on the hoof wall and the sole of the foot was attempted in order to try and better understand equine gait at the level of foot dynamics. An AMG sensor (20mm) was placed on the wall of the hoof, equidistant from the coronary band and the hoof tip, as well as on the sole of the foot at the position of the frog (Figure 3).
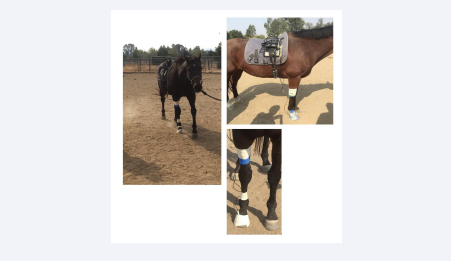
Figure 3: Test of AMG measurements simultaneously from the hoof wall and frog. Left image; a horse equiped with AMG sensors walking whilst being recorded. Upper right image; the CURO MkI setup with WiFi unit on the girth and cables to the sensors. Lower right image; a close up on the limb being measured showing the use of tape and Snøgg to hold the cables and sensors in place during recordings.
The horse was then walked on ahardsurfaceandmeasurementsmade in real- time. The results show a clear pattern for the sensor on the hoof wall; stride time (1270mSec: 800mSec stance phase and 470mSec swing phase) with initiation of the swing phase being denoted by a slight signal from the extensor tendon. These results proved to be not only repeatable, but also very consistent (Figure 4).
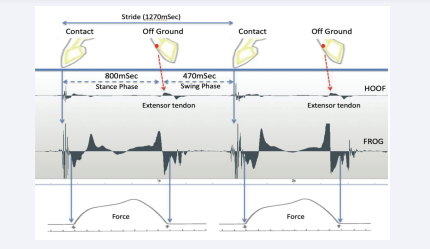
Figure 4: AMG measurement trace with sesnors on the hoof wall and frog. The stride length for this horse is given at the top of the figure, whilst times for the stance phase and swing phase are given in the image. The actual recordings for the hoof wall and the frog are indicated and presented alongside typical pressure loading graphs at the bottom of the figure.
The measurements taken from the sole (frog) showed not only the GRF signal but also signals that correspond with published values for the time taken for loading (force measurements), interupted by a swing phase that also matched the signal from the hoof wall (Figure 4).
A more detailed analysis of the Ground Reaction Forces (GRF) and loading signals from the sole of the foot (frog) can be found in Figure 5.
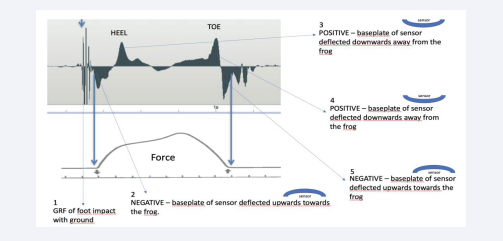
Figure 5: Detailed AMG frog analysis with interpretation as we understand it (see text for additional details). The heel and toe text indicates the points in time at which pressure is loaded onto the foot through the heel, when it is transferred to the toe and then relieved as the foot enters swing phase.
The AMG sensors incorporate a flexible brass baseplate that is deformed in an upwards as well as a downwards direction, depending upon how the foot is loaded. In addition, though, during initial foot strikes of the heel (and sole) and its loading through to toe and lift off, an overall negative pressure is created by the fascial sheets and their attachments in tension within the digital cushion (DC). These events define the overall status of the frog’s and DC’s physiological roles during movements of the horse by illustrating the importance of fluid flow through their microvasculatures. We believe the long duration of a negative pressure within the DC during this time facilitates an internal environment that permits a greater ease of continuous fluid flow through the vasculature, especially the smallest of resistance microvessels (RzMV) (3-4 microns up to 20 microns in diameter) that are present within the DC and the frog (and solar tubules). These small diameter RzMV are concentrated in the DC between the fascial sheets which enclose the microvasculature for functional purposes of limb support and energy dissipation of impact vibrations, in accordance with Poiseuille’s Law.
During ground contact, the hoof wall moves a small distance in an upward direction, while the internal foot tissues move towards the ground as the bony limb column simultaneously descends and is supported within the hoof. During foot impact events, vibratory energy waves are generated as GRF, which traverse the foot’s tissues and must be dissipated for a foot to remain healthy (Figure 5; point 1). As the frog (and solar surface) initially engage the sensor taped to the ventral foot, a negative wave is created (Figure 5; point 1); during this time arterial blood flows through the RzMV lining each of the tubules of the frog (and sole) (Figure 5; point 2). During this initial period of the foot being loaded, blood enters and courses through the resistant microvessels of the frog, giving it a temporary stiffness for support and then exits the tubules to pass through the venous sinusoids within the DC. This flow through the tubules and venous sinusoids of the DC simultaneously dissipates energy; in addition, though, it serves as important sources of blood to the “hydraulic microvasculatures” within the DC to replenish this intravascular fluid and to enhance the support and energy dissipating capabilities provided by the RzMV within the DC (Bowker, unpublished observations, 2023). During this passage of blood from the frog tubules to the venous sinusoids that then empty into the RzMV of the DC, the graph becomes positive as the DC tissues support the bony column and dissipate energy through the entire mid-stance of the step cycle (Figure 5; point 3). With the second positive peak seen in the figure above (Figure 5; point 4), and as the heel begins to leave the ground, blood is still flowing through the venous sinusoids to re-fill the resistance microvessels. All of this replenishment of the RzMV of the DC occurs because blood flowing through the RzMV eventually leaves the fascial spaces of the DC to enter the inner venous plexus within the lateral cartilage as it leaves the foot and returns to the heart. It is our belief that the change in waveforms seen above is therefore a combination of the change in fluid flow and vessel pressures due to their filling in the foot, at a time of loading; in this way, the frog and DC fascia should perhaps be seen as “variable stiffness structures” rather than as more passive “cushion-“ or “pillow”-like structures. Peak bony column loading occurs at the zenith of the force curve (Figure 5, lower panel) and occurs in parallel with blood flow through the small resistance microvessels, which serve to stiffen the DC between the deep digital flexor tendon and the frog. As mentioned above, a nearly continuous blood flow through these structures and the RzMV appear to be due to a negative pressure in the palmar foot. Finally, we see a negative signal as the baseplate of the sensor is deflected upwards towards the frog, as the heel and toe are being raised off the ground. As a consequence, the artery of the frog re-fills the tubules and then the sinusoids as blood flow passes from these tissues and then to the small resistance microvessels through the DC to repeat the cycle (Figure5; Point 5).
DISCUSSION
Whilst some prefer to highlight the limitations of technology, and cling on to current established ways of thinking, the future is always to be found through exploration of new techniques and technology combined with hard work and research. The past 120 years have shown the use of camera imaging, force plates, electromyography, inertial motion units and many other approaches all directed towards a better understanding of the gait of equids, and with them the possibility and increasing accuracy of being able to diagnose lameness and gait related issues.
It is essential that such new and exploratory techniques as those described in this manuscript be i) quick and easy to use ii) accurate and iii) portable. Whilst stationary techniques are important, it is really vital when assessing lameness and gait that an animal be able to move freely and not be restrained by the technology itself. To these criteria one should also add ease of information dissemination, since a diagnosis needs to be explained to the trainer, owner or other equine professional in such a way that recovery is optimized, and a repeat referral is minimized if not avoided.
Gait is in itself a complex field, but knowing which limb is lame or has an abnormal movement pattern is in many ways only the start of a Veterinarian’s work. There follows usually, an array of other tests and techniques to try and establish the reason for the change in gait, whether this be damage to muscle, ligament, joint etc. To this end, whilst AMG sensors on the wall of the hoof can provide details about gait abnormalities, and can do so quickly, easily, accurately and in a very portable manner, they still do not provide much needed data concerning the underlying cause of the ailment. In order to be of more use, AMG sensors would need to be applied to ligaments [11] and or muscles [13] whilst measuring gait, or subsequently, so as to better understand the underlying cause of the disturbance. Indeed, it is for this reason that it is recommended that AMG ligament measurements be performed in conjunction with a muscle measurement from the same limb.
The TendibootTM (Ekico) system meets many of these aforementioned requirements too. It is quick and easy to apply, it is portable and the algorithms applied make it very accurate, at least when horses are exercised in a straight line. When movement is in a circular motion (left- or right-hand lunge) then this equipment has been found to be less accurate [16], most likely the result of lateral loss of the GRF signals. However, in a straight line, and on a firm surface this technology is a wonderful diagnostic tool, providing very rapid information for the front and hind limbs about GRF (Newtons), stance phase (mSec), stride length (meters) as well as providing an overall balance evaluation (left versus right) (%). Of course identification in this way of an affected leg or legs still poses a question of interpretation for any Veterinarian. It is well known that horses, just like ourselves, tend to compensate for regions that are painful, preferring to redistribute their weight onto healthy limbs and relieve painful ones by protecting them from full load bearing [17,18]. Nor can this technique determine where in an affected limb the problem is located, only that gait has been affected in that limb. So, Veterinarians may choose to use this form of technology for a quick assessment of an animal´s gait, but will then need to rely on a more detailed examination to establish the underlying cause of the lameness or gait disturbance. There is now a movement towards more holistic assessment of animals, and this has been driven to some extent by the discovery of myofascial kinetic lines [19,20], so called links between one active muscle group and another, forming connected lines throughout the body. Knowledge of these lines and their interconnectivity can be invaluable in gait assessment, especially when combined with a measurement of muscle and tendon/ligament functional health [18], and this approach is now being increasingly adopted by Veterinarians the World over.
However, whilst the aforementioned techniques are useful tools for gait analysis, there is still a great need for a more detailed biomechanical analysis of the equine foot and how they relate to the detailed physiology of the vasculature and the neural systems needed for sensory detection and perception. To this, can be added a considerable need for information on the effects of trimming, shoeing and shoe design. To date there is limited knowledge of the functional structure of the equine foot, its adaptation to load bearing and even the possibility to measure and monitor such changes in real-time [21-23]. The use of AMG sensors placed on the frog and the wall of the hoof has therefore provided a much-needed non-invasive insight into this poorly understood aspect of equine gait. The preliminary traces and interpretation of AMG sensors on the frog and wall of the hoof shown in this manuscript are exciting and in much need of further study. They reveal a pattern that not only makes sense from a functional point of view, but also opens a window of opportunity for diagnosis and a deeper, more informative analysis of gait disturbances where the causal factor is confined to the equine foot. However, as a technique this approach is easy to use and portable, it also seems to be accurate, but remains a little time consuming and currently lends itself more to research than to the veterinary clinic
CONCLUSIONS
It is concluded that both Acoustic MyoGraphy (AMG) and the TendibootTM system are of use in a Veterinary clinic setting, rapidly providing details of equine gait for diagnostic purposes. It is likewise concluded that gait analysis data alone can rarely provide a total insight into the cause of a gait abnormality. It is for this reason that techniques that are capable of measuring more than just one parameter related to equine gait should be sought and tested.
Patents
The CURO system is patented (US010610735B2; EU3229679; China ZL201580067689.2; Australia 2015359341) and the ESTi analysis system if trademarked.
Author Contributions
Conceptualization, A.H., D.I., R.B.; methodology, A.H.; software, A.H.; validation, D.I., R.B.; formal analysis, A.H. and R.B.; investigation, A.H., D.I., R.B.; resources, A.H.; data curation,A.H. and R.B.; writing—original draft preparation, A.H., D.I., R.B.; writing—review and editing, A.H., D.I., R.B. All authors have read and agreed to the published version of the manuscript.
Institutional Review Board Statement
This research was non-invasive in its nature and for this reason did not require ethical approval.
Informed Consent Statement
Informed consent was obtained from all horse owners involved in the study.
Data Availability Statement
We are happy to share data and to collaborate with those who find this research of interest.
ACKNOWLEDGMENTS
The authors are indebted to the horse owners for enabling us to undertake these novel recordings.
Conflicts of Interest
AH is in the process of establishing a company to produce and market the Acoustic MyoGraphy system (CURO-Diagnostics ApS)
REFERENCES
- Braganc?a FMS, Broome? S, Rhodin M, Björnsdo?ttir S, Gunnarsson V, Voskamp JP, et al. Improving gait classification in horses by using inertial measurement unit (IMU) generated data and machine learning. Sci Rep. 2020; 10: 17785.
- Dyson S. Recognition of lameness: Man versus machine. Vet J. 2014; 201: 245-8.
- Barrey E. Methods, Applications and Limitations of Gait Analysis in Horses. Vet J. 1999; 157: 7–22.
- Hobbs SJ, Levine D, Richards J, Clayton H, Tate J, Walker R. Motion analysis and its use in equine practice and research. Wien Tierärztl Mschr.Vet Med Austria. 2010; 97: 55-64.
- Bajcar E, Calvert D, Thomason J. Analysis of Equine Gaitprint and Other Gait Characteristics using Self-organizing Maps (SOM). IEEE International Joint Conference on Neural Networks 2004; 10: 1109.
- Torres-Pe?rez Y, Go?mez-Pacho?n EY, Cuenca-Jime?nez, Francisco. Horse’s gait motion analysis system based on videometry. Ciencia y Agricultura, 2016; 13: 83-94.
- Oosterlinck M, Pille F, Huppes T, Gasthuys F, Back W. Comparison of pressure plate and force plate gait kinetics in sound Warmbloods at walk and trot. Vet J. 2010; 186: 347–51.
- George St L, Roy SH, Richards J, Sinclair J, Hobbs SJ. Surface EMG signal normalisation and filtering improves sensitivity of equine gait analysis. Comparative Exercise Physiology. 2019; 15: 173-185.
- Pfau T. Sensor-based equine gait analysis: more than meets the eye?. UK-Vet Equine. 2019; 3: 102-112.
- Dyson S, Berger J, Ellis AD, Mullard J. Development of an Ethogram for a Pain Scoring System in Ridden Horses and Its Application to Determine the Presence of Musculoskeletal Pain. Journal of Veterinary Behavior. 2018; 23: 47-57.
- Chavers JC, Allen AK, Ahmed W, Fuglsang-Damgaard LH, Harrison A. The Equine Hindlimb Proximal Suspensory Ligament: An Assessment of Health and Function by Means of Its Damping Harmonic Oscillator Properties, Measured Using an Acoustic Myography System: A New Modality Study. Journal of Equine Veterinary Science. 2018; 71: 21- 26.
- Harrison AP. A More Precise, Repeatable and Diagnostic Alternative to Surface Electromyography-An Appraisal of the Clinical Utility of Acoustic Myography. Clin Physiol Funct Imaging. 2018; 38: 312-325.
- Jensen AM, Ahmed W, Elbrønd VS, Harrison AP. The Efficacy of Intermittent Long-Term Bell Boot Application for the Correction of Muscle Asymmetry in Equine Subjects. J Equine Vet Sci. 2018; 68: 73- 80.
- Ahmed W, Elbrønd VS, Harrison AP, Hart JO, Williams RE. An Investigation into the Short-Term Effects of Photobiomodulation on the Mechanical Nociceptive Thresholds of M. Longissimus and M. Gluteus Medius, in Relation to Muscle Firing Rate in Horses at Three Different Gaits. J Equine Vet Sci. 2021; 98: Article ID: 103363.
- Isbell D, Laguna S, Harrison A. A Static Bioimpedance and Dynamic Acoustic Myography Preliminary Assessment of Low Frequency Therapeutic Ultrasound Treatment of the Shoulder Muscle Trapezius: An Equine Study. Open Journal of Veterinary Medicine. 2021; 11: 125-135.
- Friis M, Okkels A. Objective measurements of the horse´s compensatory locomotion by naturally occurring frontlimb lameness and subjective evaluation of contracted myofascial kinetic lines. MSc thesis in Veterinary Medicine. Copenhagen University, Denmark. 2022.
- Nowotny-Czupryna O, Czupryna K, Nowotny, J, Brz?k A. Some possibilities of correction and compensation in body posture regulation among children and adolescents with low degree scoliosis. Ortop Traumatol Rehabil. 2012; 14: 525-35.
- Weishaupt MA, Wiestner T, Hogg HP, Jordan P, Auer JA. Compensatory load redistribution of horses with induced weight-bearing forelimb lameness trotting on a treadmill.Vet J. 2006; 171: 135-46.
- Elbrønd VS, Schultz RM, Myofascia - the unexplored tissue: myofascial kinetic lines in horses, a model for describing locomotion using comparative dissection studies derived from human lines. Medical Research Archives. 2015; 3: 1–22.
- Ahmed W, Kulikowska M, Ahlmann T, Berg LC, Harrison AP, Elbrønd VS. A comparative multi-site and whole-body assessment of fascia in the horse and dog: a detailed histological investigation. J Anat. 2019; 235: 1065-1077.
- Lancaster LS, Bowker R.M, Mauer WA. Equine hoof wall tubule density and morphology. J Vet Med Sci. 2013; 75: 773-8.
- Bowker R, Isbell D, Lancaster L. Preliminary findings from a pilot study on equine foot blood flow in response to acupuncture. American Academy of Veterinary Acupuncture Annual Conference. 2015.
- Bowker R, Lancaster LS, Isbell D. Morphological evaluation of Merkel cells and small lamellated sensory receptors in the equine foot. Am J Vet Res. 2017; 78: 659-667.


