Kynurenine Aminotransferases in Cat Saliva
- 1. Karl Landsteiner Research Institute for Neurochemistry, Neuropharmacology, Neurorehabilitation and Pain Treatment Mauer, Mauer-Amstetten, Austria
- 2. Faculty for Biology, University of Würzburg, Germany
- 3. Department of Biomedical Sciences, University of Veterinary Medicine Vienna, Austria
Abstract
Background/Aims: Human body fluids such as serum, cerebrospinal fluid and saliva contain a variety of proteins. Since kynurenic acid (KYNA) has been detected in human saliva, we wondered whether KYNA could be produced in cat saliva by KYNA-synthesising enzymes, namely kynurenine aminotransferases KAT I, KAT II and KAT III.
Methods: Saliva was collected from domestic cats. KAT activity was measured by enzymatic method and KYNA produced was determined by high performance liquid chromatography.
Results: Cat saliva is capable of producing KYNA by the action of KAT I, KAT II and KAT III. KAT activities were measured between 500 and 2500 fmol/ µl saliva/h. Interestingly, diluted cat saliva showed a significantly higher capacity to synthesise KYNA, suggesting the presence of endogenous inhibitors. This effect was particularly evident for KAT III and KAT II and to a lesser extent for KAT I. Cat saliva contains KYNA in the nM range.
Conclusion: Our data demonstrate for the first time the presence of KAT I, KAT II and KAT III proteins in feline saliva. Furthermore, our data suggest the presence of compounds/factors in cat saliva that may be involved in the modulation of the biochemical machinery of the kynurenine pathway, such as the synthesis of KYNA. The endogenous modulation of KYNA formation in the feline mouth may play a pivotal role in various physiological and pathological events.
Keywords
• Saliva; Kynurenine aminotransferase; Cat; KAT inhibition; Glia depressing factor
CITATION
Baran H, Kronsteiner C, Kepplinger B (2024) Kynurenine Aminotransferases in Cat Saliva. J Vet Med Res 11(2): 1266.
ABBREVIATIONS
ANOVA: Analysis of Variance; CSF Cerebrospinal Fluid; HPLC: High-Performance Liquid Chromatography; GDF: Glia Depressing Factor; KAT: Kynurenine Aminotransferase; KYNA Kynurenic Acid; L-KYN: L-kynurenine; N: Number of Sampels; SEM: Standard Error of the Mean
INTRODUCTION
Recently, we reported that human saliva is capable of forming kynurenic acid (KYNA) through the action of the kynurenine aminotransferase enzymes, i.e. KAT I, KAT II and KAT III [1]. Studies by Chiappelli et al [2, 3] have shown that salivary levels of KYNA are increased following psychological stress. KYNA, a tryptophan metabolite along the kynurenine pathway [Figure 1],
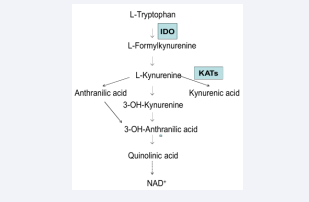
Figure 1: Tryptophan metabolism, Tryptophan degradation along kynurenine pathway
is a known endogenous antagonist of glutamate ionotropic excitatory amino acid receptors [4, 5] and nicotinic acetylcholinergic subtype alpha-7 receptors [6, 7].
Importantly, in an experimental animal model, elevated levels of KYNA impaired memory [8], whereas reduced levels of KYNA improved cognitive function [9]. Similarly, elevated levels of KYNA have been found in several neuropsychiatric and immunological disorders, as well as during the aging process and in age-related diseases, and a role for KYNA in memory and cognitive impairment has been suggested [10-18]. KYNA is present in several human fluids including cerebrospinal fluid (CSF), serum and saliva [10,12,16,18,19].
Saliva is continuously secreted by the buccal glands and the three pairs of salivary glands, the parotid, submandibular and sublingual glands [20]. Salivation is entirely under nervous control, with parasympathetic stimulation keeping the mucous membranes moist and sympathetic stimulation causing a feeling of dryness [20]. Food stimulates the glands to produce large amounts of saliva, but the smell, sight, touch and even sound of food increase salivation. These stimuli constitute psychological activation and involve learned behaviour that is stored in the cerebral cortex [21].
KYNA synthesis is regulated by a large number of pyridoxal 5-phosphate-dependent enzymes, termed kynurenine aminotransferase(s) (KATs), which catalyse the conversion of L-kynurenine to KYNA in the mammalian CNS and periphery [5, 21, 22]. Several KATs have been identified and characterised in mammalian brain and peripheral tissues [23-26]. KAT I, KAT II and KAT III have different catalytic properties with respect to the optimum pH: 9.6 for KAT I, 8.0 for KAT III and 7.4 for KAT II [23, 24, 26]. Our aim was to investigate the ability of cat saliva to synthesise KYNA.
MATERIALS AND METHODS
Chemicals used
L-kynurenine, KYNA and pyridoxal-5-phosphate were purchased from Sigma-Aldrich Handels GmbH Vienna, Austria. All other chemicals used were of the highest commercial purity.
Animals
Saliva was collected from a 10-year-old male cat with no teeth but otherwise in excellent health [Figure 2].
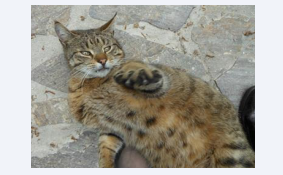
Figure 2: A domestic cat, a Stritzi. Cat with some beautiful characteristic markings on its body and on its coat
The cat produced increased amounts of saliva only when it felt comfortable and its head and back were massaged,but not as a rule, or sometimes when its food was being prepared; the saliva was collected and immediately frozen for use in our research. Eight saliva samples were collected from the cat in the morning over a period of 8 weeks (i.e. one sample per week). The cat had 4 teeth, which it had lost for religious or other reasons.
In Figure 2, the cat had only 2 teeth. The cat had no teeth at the time of saliva collection. In our experience, collecting saliva from cats is difficult and time consuming
Methods used
Measurement of KAT I, KAT II and KAT III activity: KAT I, KAT II and KAT III activity in saliva was measured using an enzymatic assay described by Baran et al [12] with minor modifications. Briefly, the reaction mixture contained various amounts of saliva, 2 µM or 100 µM L-kynurenine, 1 mM pyruvate, 70 µM pyridoxal-5-phosphate and 150 mM 2-amino-2-methyl- l-propranol buffer pH 9.6 for KAT I, 150 mM Tris-acetate buffer pH 7.4 for KAT II or 150 mM Tris-acetate buffer pH 8.0 for KAT III in a total volume of 200 µl. After incubation at 37°C for 1 h, the reaction was stopped by the addition of 14 µl of 50% trichloroacetic acid and 1 ml of 0.1 M HCl. Denatured proteins were removed by centrifugation (30 min at 11,000 rpm) and the synthesised KYNA was quantified by high-performance liquid chromatography (HPLC). Blanks were prepared by adding 14 µl of 50% trichloroacetic acid to the reaction mixture prior to incubation. Measurement of KAT activity in saliva was linear, at least in humans [1].
KYNA measurement: KYNA was measured according to Swartz et al. [27], with modifications described by Baran et al. [12]. KYNA was quantified by HPLC coupled to fluorescence detection. If necessary, KYNA samples were purified on a Dowex 50-W cation exchange column as described by Turski et al. [28], before injection into the HPLC system.
EXPERIMENTS
Measurement of KAT I, KAT II and KAT III activity and KYNA content in feline saliva samples
KAT I, KAT II and KAT III activities were measured in cat saliva samples according to Materials and Methods. KYNA content was measured according to Materials and Methods.
DATA ANALYSES
All data are presented as the mean the standard error of the mean (SEM). Each sample was examined in duplicate. One-way analysis of variance (ANOVA) and Student’s t-test were used to determine statistical significance. The level for statistical significance was set at p < 0.05.
RESULTS
Data on KAT I, KAT II and KAT III activities are shown in Figure 3.
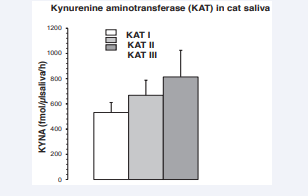
Figure 3: Kynurenine aminotransferase I, II, III (KAT I, KAT II, KAT III) activity in cat saliva. All data are presented as the mean ± SEM, and N = 8. Abbreviations: N: Number of Saliva Samples.
The higher values were for KAT III, followed by KAT II and KAT I. There were no significant differences between the KATs. The average enzyme concentrations were approximately between 500 and 800 fmol/µl saliva/h.
As different amounts of cat saliva were used in the assay, the relationship between the amount of saliva used in the incubation mixture and the activities of KAT I, KAT II and KAT III enzymes was evaluated. The data are presented in Figure 4.
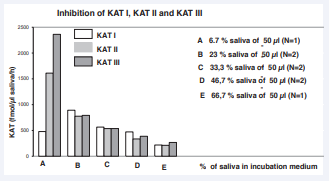
Figure 4: Effect of saliva dilution on KAT I, KAT II and KAT III activity in the assay according to Materials and Methods. Abbreviation: N: Number of Diluted Saliva’s.
For KAT I, the dilution procedure resulted in significantly higher activity values. One- way ANOVA analysis of KAT I levels between 5 dilution patterns (A, B, C, D and E) revealed significant differences, F = 17798.87, P = 6.83763E-7. One-way ANOVA analysis of KAT I levels between B and C showed significant differences, F = 5755.32, P = 000839; T-test was t = -75.86383, p= 0.00839. One-way ANOVA analysis of KAT I values between C and D showed significant differences, F = 1274, P = 7.84006E-4; T-test was t = -35.69314, p = 7.84006E-4.
Between A and B and D and E the correlation and t could not be calculated because the difference of the standard error is 0. However, at the 0.05 level the two means of both are significantly different.
For KAT II, the dilution procedure resulted in significantly higher activity values. One- way ANOVA analysis of KAT II levels between 5 dilution patterns (A, B, C, D and E) showed significant differences (F = 188.70109, P = 6.21231E-4). One-way ANOVA analysis of KAT II levels between B and C showed no significant differences, F = 6.4372 P = 0.23902; T-test was not significant, t = -2.53716, p = 0.23902. One-way ANOVA analysis of KAT II levels between C and D showed no significant differences, F = 13.73641, P = 0.06571; T-test was t = -3.70627, p = 0.06571. One-way ANOVA analysis of KAT II levels between D and E showed significant differences, F = 29768, P = 3.35914E-5; T-test was significant at 0.05 level.
For KAT III, the dilution procedure resulted in significantly higher activity values. One- way ANOVA analysis of KAT III levels between 5 dilution patterns (A, B, C, D and E) showed significant differences, F = 3924.88174, P = 6.60112E-6. One-way ANOVA analysis of KAT III levels between B and C showed no significant differences, F = 67.42387, P = 0.07715; T-test was not significant, t = -8.2112, p = 0.07715. One-way ANOVA analysis of KAT III levels between C and D showed significant differences, F = 68.92907, P = 0.0142; T-test was t = -8.30235, p = 0.0142.
One-way ANOVA analysis of KAT III levels between D and E revealed significant differences, F = 28800, P = 3.47204E-5; T-test was significant at 0.05 level.
We found that dilution of saliva resulted in higher activities for KAT III, KAT II and KAT I. In a sample with the highest dilution, the activities of the KATs were visibly different and the values were higher [Figure 4]. These data suggest the presence of an endogenous inhibitor and require further investigation. The measurement of KAT activity in saliva was linear, at least in humans [1]. The endogenous KYNA content was 455 ± 56 fmol/ µl (N=8) in cat saliva.
DISCUSSION
The present study is the first to demonstrate the presence of KAT I, KAT II and KAT III in cat saliva in the range of approximately 500 to 2500 fmol/µl saliva/h. We have previously demonstrated KAT activities in human saliva [1] and the present data suggest the general presence of KATs in mammalian saliva. Furthermore, KYNA is present in cat saliva at low concentrations (nM), similar to human saliva [19].
In particular, we observed that cat saliva contains compounds/factors that block the activity of KAT I, KAT II and KAT III. The presence of KATs has previously been described in human fluids such as cerebrospinal fluid and serum [16]. Interestingly, all these fluids have an inhibitory effect on KAT activity [16], similar to what we observed in feline saliva. We postulated the presence of a glia-depressing factor (GDF), and its involvement in pathological conditions such as multiple sclerosis has been suggested [29].
Recently, our data also suggested the presence of such factor(s) in the snail Helix pomatia, as snail mucus could also affect rat liver by blocking KAT I, II and III activities [30]. It remains questionable whether these factor(s) have a similar role and effect on KYNA synthesis in the CNS and periphery of different species under physiological and pathological conditions, including the ageing process.
Cats use saliva for grooming and cleansing. KYNA has strong antioxidant properties, stronger than vitamin E (Baran observation), and this may contribute to faster wound healing. The presence of KYNA synthesis in cat saliva suggests that peripheral and CNS organs are also capable of producing KYNA and that its biochemical machinery and physiological role may be similar to that discovered in other species.
The cat used in this study is tiger-like, the cat had very nice coat colours and patterns [Figure 5A].
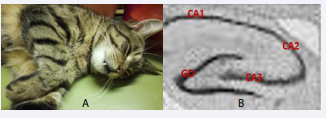
Figure 5: Coat colour and pattern around the eyes in the cat (Figure 5A). Comparison with hippocampal subregions CA1, CA2, CA3 and GD (Figure 5B). Abbreviations: CA: Cornu Ammonis; GD: Dendate Gyrus
We were very impressed by the patterns when the eyes were closed. Strongly remained part of subregions of the hippocampus consisting of the Cornu Ammonis (CA), CA1, CA2 and CA3, a strip of pyramidal neurons and the dendate gyrus (DG); seen in the dorsal hippocampus [Figure 5B].
In particular, the two hippocampal subregions GD and CA3 can be seen in most tiger cats. These biological events of distribution are present on different platforms, in the brain and also outside on the body. This could be a wonderful distribution of the genetic memory programme, at least in cats/tigers.
Salivation is a very important physiological event involved in various steadystate processes, but can change dramatically under pathological conditions, for example hypersalivation or hyposalivation [31]. The saliva used in our study was produced by a very happy cat, which can have a significant effect on saliva content and quality compared to control values [2,3].
CONCLUSION
The present data indicate that cat saliva is capable of forming KYNA by the enzymes KATs in saliva. Furthermore, we suggest the presence of endogenous compound(s) in cat saliva that cause the blockade of KATs activities. This observation supports our previous finding of the involvement of GFD in many biochemical processes in other species, including humans.
ACKNOWLEDGEMENTS
I would like to express my sincere gratitude and appreciation to the staff of the Karl Landsteiner Research Institute Mauer for their generous support of this study.
Authors’ contributions
H. Baran designed the study. H. Baran and C. Kronsteiner performed the analysis and B. Kepplinger contributed to the analysis. H. Baran analysed the data and drafted the first draft of the manuscript. The authors approved the final version of the manuscript.
Disclosure statement
The authors declare that they have no competing interests
REFERENCES
- Baran H, Kronsteiner C and Kepplinger B. Kynurenine aminotransferases I, II and III are present in saliva. Neurosignals. 2020; 28:1-13.
- Chiappelli J, Pocivavsek A, Nugent KL, Notarangelo FM, Kochunov P,Rowland LM, et al. Stress-induced increase in kynurenic acid as a potential biomarker for patients with schizophrenia and distress intolerance. JAMA Psychiatry.2014; 71: 761-768.
- Chiappelli J, Rowland LM, Notarangelo FM, Wijtenburg SA, Thomas MAR, Pocivavsek A, et al. Salivary kynurenic acid response to psychological stress: inverse relationshipto cortical glutamate in schizophrenia. Neuropsychopharmacology. 2018; 43: 1706-1711.
- Birch PJ, Grossman CJ, Hayes AG. Kynurenic acid antagonises responses to NMDA via an action at the strychnine-insensitive glycine receptor. Eur J Pharmacology.1988; 154: 85-87.
- Stone TW. Neuropharmacology of quinolinic and kynurenic acids. Pharmacol Rev.1993; 45: 309-379.
- Hilmas C, Pereira EF, Alkondon M, Rassoulpour A, Schwarcz R, Albuquerque EX. The brain metabolite kynurenic acid inhibits alpha7 nicotinic receptor activity and increases non-alpha7 nicotinic receptor expression. Physiopathological implications. J Neurosci. 2001; 21: 7463-7473.
- Albuquerque EX, Pereira EF, Alkondom M, Rogers SW. Mammalian nicotinic receptors: from structure to function. Physiol Rev.2009; 89: 73-120.
- Chess AC, Simoni MK, Alling TE, Bucci DJ. Elevations of endogenous kynurenic acid produce spatial working memory deficits. Schizophr Bull. 33: 797-804.
- Kozak R, Campbell BM, Strick CA, Horner W, Hoffmann WE, Kiss T, et al. Reduction of brain kynurenic acid improves cognitive function. J Neurosci 2014; 34: 10592-10602.
- Heyes MP, Saito K, Crowley JS, Davis LE, Demitrack MA, Der M. Quinolinic acid and kynurenine pathway metabolism in inflammatory and non-inflammatory neurological disease. Brain.1992; 115: 1249- 1273.
- Baran H, Jellinger K. (1997) Does increased kynurenic acid levels in the braincontribute to the impairment of memory in Alzheimer’s disease? SecondInternational Oxidative Stress and Brain Damage Symposium, 1997 Abstractbook, Chicago, Illinois, USA.
- Baran H, Jellinger K, Deecke L. Kynurenine metabolism in Alzheimer’sdisease. J Neural Transm.1999; 106: 165-181.
- Baran H, Hainfellner JA, Kepplinger B, Mazal PR, Schmid H, Budka H. Kynurenic acid metabolism in the brain of HIV-1 infected patients. J NeuralTransm. 2000; 107: 1127-1138.
- Schwarcz R, Rassoulpour A, Wu H-Q, Medoff D, Tamminga CA, Robert RC. Increased cortical kynurenate content in schizophrenia. Biol Psychiatry. 2001; 50: 521-530.
- Erhardt S, Schwieler L, Engberg G. Kynurenic acid and schizophrenia. Adv Exp Med Biol. 2003; 527: 155-165.
- Kepplinger B, Baran H, Kainz A, Ferraz-Leite H, Newcombe J and Kalina P. Age-related increase of kynurenic acid in human cerebrospinal fluid-IgG and beta2-microglobulin changes. Neurosignals. 2005; 14: 126-135.
- Schwarcz R, Bruno JP, Muchowski PJ and Wu H-Q. Kynurenines in themammalian brain: when physiology meets pathology. Nat Rev Neurosci.2012; 13: 465-477.
- Kepplinger B, Baran H, Kronsteiner C, Reuss J. Increased levels of kynurenic acid in the cerebrospinal fluid in patients with hydrocephalus. Neurosignals. 2019; 27: 1-11.
- Kuc D, Rahnama M, Tomaszewski T, Rzeski W, Wejksza K, Urbanik- Sypniewska T,et al. Kynurenic acid in human saliva -- does it influence oral microflora?. Pharmacol Rep. 2006; 58: 393-398.
- Tortora GJ, Anagnostakos NP. Principles of anatomy and physiology. Fifth Edition 1987 Harper & Row, Publishers, New York. ISBN 0-06- 350729-3.
- Brown RR. Biochemistry and pathology of tryptophan metabolism and its regulation by amino acids, vitamin B6, and steroid hormones. Am J Clin Nutr. 1971; 24: 243-247.
- Bender DA, McCreanor GM. The preferred route of kynurenine metabolism in the rat. Biochim Biophys Acta. 1982; 717: 56-60.
- Okuno E, Nakamura M, Schwarcz R. Two kynurenine aminotransferases in human brain. Brain Res. 1991; 542: 307-312.
- Baran H, Okuno E, Kido R, Schwarcz R. Purification and characterisation of kynurenine aminotransferase I from human brain. J Neurochem. 1994; 62: 730-738.
- Tamburin M, Mostardini M, Benatti L. Kynurenine aminotransferase I (KAT I) isoform gene expression in the rat brain: an in situ hybridization study. NeuroReport. 1999; 10: 61-65.
- Han Q, Cai T, Tagle DA, Li J. Structure, expression, and function of kynurenine aminotransferases in human and rodent brains. Cell Mol Life Sci. 2010; 67: 353-368.
- Swartz KJ, Matson WR, MacGarvey U, Ryan EA, Beal MF. Measurement of kynurenic acid in mammalian brain extracts and cerebrospinal fluid by high-performance liquid chromatography with fluorometric and coulometric electrode assay detection. Anal Biochem. 1990; 85: 363-376.
- Turski WA, Gramsbergen JB, Traitler H, Schwarcz R. Rat brain slices produce and liberate kynurenic acid upon expose to L-kynurenine. J Neurochem. 1989; 52: 1629-1636.
- Baran H, Kepplinger B, Draxler M. Endogenous Kynurenine aminotransferases inhibitor is proposed to act as “Glia Depressing Factor”(GDF). Int J Tryptophan Res. 2010; 3: 13-22.
- Kronsteiner C, Baran H, Kepplinger B. Kynurenic acid and kynurenine aminotransferase I, II and III activities in ganglia, heart, and liver of snail Helix pomatia. Cell Physiol Biochem. 2023; 57: 279-297.
- Hollinger H. Hypersalivation in cats – Signs, Causes, Diagnosis,Treat ment,Recovery,Management, Costs. Wag; 1-14.


