Coordinated Multi-Lineage Immune Activation of Immune Cells and Cytokines induced by Hydrazine with Chemotherapy prolong Survival of Lung Cancer Patients
- 1. TaiMeiBaofa Cancer hospital, Dongping, Shandong Province, China
- 2. Jinan Baofa Cancer hospital, Jinan, Shandong Province, China
- 3. Beijing Baofa Cancer Hospital, Beijing, China
- 4. Immune Oncology Systems, Inc, San Diego, CA, USA
- 5. South Hospital of Shenzhen University, Shenzhen, Guangdong, China
Abstract
Objective: Lung cancer remains the leading cause of cancer death; metastatic non-small cell lung cancer is clinically difficult to treat and immunotherapy is a novel treatment of lung cancer like PD1 or PD-l1 immune checkpoint inhibitors (ICIs). However, it still needs an approach for killing tumor cell and active of immune cell like tumor lysates vaccine thorough hapten (hydrazine) enhance intratumoral chemotherapy (HEIC.
Method: scRNA-Seq and Olink proteomics were employed to study the initiation of immune response at the cell level of untreated and the treated major tumor after HEIC, also analyzed cytokines of expression of genes following the initiation of immune response.
Result: The immunity reaction was activated like MPs, mature DC cells and T and NK cells including CD8+ effector T cells, CD8Trm, NK cells, also awaking memory T cells, CD8+ effector T cells, CD8Trm and Naive T increased in untreated tumor after the major tumor treated. It confirmed that HEIC can kill tumor and modify associate tumor antigens (ATAs) to be neo ATAs for initiation of immune response. It resulted in 30 % high expression over 92 genes detecting for longer survival group with 2.5 years than short survival group with less 1.5 years.
Conclusion: We have demonstrated that immune response can be induced by hapten associated therapy of HEIC with up to 30% expression of genes in long survival group. This significant difference may be related to the heterogeneity of immune cell individuals and tumor environment between the long and short survival groups.
Keywords
• Local drug delivery
• Immune response with local therapy
• Hapten enhanced intratumroal therapy
• Hydrazine as hapten
• scRNA-Seq; Olink Proteomics
Citation
Yu B, Gao F, Jing P, Zheng G, Zhou S (2026) Coordinated Multi-Lineage Immune Activation of Immune Cells and Cytokines induced by Hy drazine with Chemotherapy prolong Survival of Lung Cancer Patients. J Autoimmun Res 7(1): 1033.
INTRODUCTION
Advanced lung cancer remains the leading cause of cancer death in the United Statesand worldwide [1]. Patients with metastatic non-small cell lung cancer (mNSCLCare clinically difficult to treat, and immune checkpoint inhibitors (ICIs), specific antibodies against programmed death (PD-1) receptors, and programmed death ligand 1 (PD-L1) can extend survival in some patients in first or second-line treatment strategies [2]. Unlike current chemotherapy, radiotherapy, or targeted therapies targeting tumor cells that also harm immune cells, PD-1 or PD-l1 directly restores the host anti-tumor immune response to tumor-mediated depletion. In this case, the survival benefit of immunotherapy is that only one-third of patients are alive and disease-free at 5 years [3]. Clinically, when most patients receive standard treatment of synchronous chemotherapy or radiotherapy (CCRT), the immune system of patients was in the state of weaker and sicker condition and the internal environment of their tumors different or more heterogeneous has been destroyed to poor extent of immune cells function, and ICIs treatment cannot enhance the function of weaker or sicker T cells to fight tumor cells. Improving the poor condition of T cells is crucial for clinical benefit. In clinical practice, in order to avoiding higher doses of chemotherapy or radiotherapy for CCRT patients, we are trying to find a way to awaken the fighting immune cells of primary mNSCLC patients through hapten-enhanced local chemotherapy (HELC). HEIC likes the tumor lysate vaccine to induce immune response, especially the whole cancer cells or cancer cell lysates, it is a very promising approach associated with T cell immunity. Sensitize the patient’s immune system to tumor cells and prepare the patient’s immune system for ICIs treatment [4,5]. Here we have selected hydrazine instead of penicillin as a hapten, which like penicillin can induce some adverse reactions, has the ability to reactivate tumor suppressor gene expression, and is currently being evaluated, together with histone deacetylase inhibitors alone or as an adjunct to chemotherapy and radiotherapy. Drug adverse reactions, such as drug-induced lupus, often involve active intermediates, and the oxidation of hydrazine leads to covalent binding of active intermediates to proteins, which may be related to hydrazine induced lupus. We use haptenization of hydrazine with tumor-associated antigens (TAAs), and through covalent binding to TAAs proteins to convert TAAs to neo TAAs [6-10].
Intratumoral injection of hapten plus cytotoxic drugs into lung tumors has successfully extended the survival time of patients. Haptens play a role of immune modification, modify the TAAs released by the dead tumor cells and lysate after HELC, and turn TAAs to neo TAAs as a vacine to produce immune response, thus prolonging the survival time of tumor patients [4,5].These results indicated that the enhanced immune response may be related to hapten induced the abscopal effects and prolonged survival [11].
Advanced single-cell RNA sequencing (scRNA-SEQ) and Olink proteomics technology provides a new way to explore genomic and functional heterogeneity of complex biological systems at the cellular level with molecular resolution, while evaluating tens of thousands of cells and revealing regulation, communication, and interactions between cells [12-14].
scRNA-seq was applied to measure the activation of tumor immunity at sing cells level and Olink proteomics was employed to observe the result of immune response like cytokines before and after primary lung cancer treated with HEIC. Through comparative analysis between two samples and subsets of lung cancer by scRNA-Seq to confirm the initiation of immune response, we comprehensively described the expression characteristics of malignant epitheliums and immune cells including myeloid cells and platelets, as well as the dynamic changes of cell percentages, and the heterogeneity of cell subtypes,then we compared expression of cytokines in blood with long survival and short survival groups [15,16].
The outcomes of these proposed aims may provide the detailed understanding of immune cell awakened at molecular base in fighting the lung cancer treated by HELC and the difference survival group may during to the heterogeneity of cancer patients and may develop a more reliable, hydrazine as hapten enhanced sensitization immunotherapy for lung cancer patients.
MATERIALS AND METHODS
Patient Treatment and Clinical Specimens: Two groups of 28 pancreatic cancer patients were retrospectively selected, one group of survived 2.5 years (A) and one group of survived less than 1.5 years (B) with pathology diagnosis for adenocarcinoma of lung cancer. Those patients had a clinical diagnosis with pathological diagnosis as adenocarcinoma of the lung cancer at 5 years ago and 10 new patients for treatment with scRNA-seq study, and met the indications for HELC treatment (Table 1), signed the informed consent form, and this experiment was approved by the Ethics Committee Board of Shandong Baofa Cancer Institute (TMBF 0010, 2015) and all method for experiments were performed in accordance with relevant guidelines and regulations.
The treatment was performed at Taimei Cancer Hospital by HELC to the lung tumor site by the spine needle under CT guiding [4-11]. Surgical biopsy samples were collected from lung tumor before treatment and a second surgical biopsy were performed one weeks later following the first treatment, it was immediately stored in sCelLiVE® Tissue Preservation Solution (Singleron) and taken back to the laboratory for further processing. After therapy, all old patient’s blood samples were continuously collected since 5 years ago and stored in EDTA, plasma was obtained by centrifugation (3,000rpm for 15min at 4oC) and stored at −80oC, it is ready for Olink Proteomics now [15,16].
scRNA-Seq and Sequencing data processing and quality control
The fresh samples of blood stored in SCelLiVeR tissue preservation solution in GEXSCOPER (Singleron) till molecular testing [5]. Original gene expression matrix data were generated using the CeleScopeR (https://github. com/singleron-RD/CeleScope) software. CeleScopeR is a single-cell data processing software developed by Singleron quality control and filter the data was carried [11]. Reads were compared with the reference genome GRCh38 with ensemble version 93. Gene annotation was used STAR (version 2.6.1b) [13,14].
Differentially expressed genes (DEGs) analysis (Scanpy): Identify differentially expressed genes (DEGs) was studied by using the scanpy.tl.rank_genes_groups function based on the Wilcoxon rank sum test with default parameters and selected the genes expressed in more than 10% of the cells with an average log (Fold Change) value greater than one as DEGs [14].
Cell type annotation: Cell type identity in each cluster was determined by the expression of canonical markers found in the DEGs using the SynEcSys database (Singleron Biotechnologies) [14].
Subtyping of major cell types, CNV detection based on scRNA-seq and pathway: To investigate the potential functions of DEGs between clusters, the Gene Ontology (GO) and Kyoto Encyclopedia of Genes and Genomes (KEGG) analysis with the “ClusterProfiler” R package 3.16.1. [6] Gene set variation analysis (GSVA) pathway enrichment analysis [14].
UCell gene set scoring: Gene set scoring was performed using the R package UCell v 1.1.0. [12]. UCell scores based on the Mann-Whitney U statistic by ranking query genes in the order of their expression levels in individual cells.
Trajectory analysis: We used the R package monocle (version 2.18.0) [10], to carry out single-cell trajectory analysis, and the dimensionality reduction method was DDRTree [14],
Transcription factor regulatory network analysis (pySCENIC): The transcription factor network was constructed by pySCENIC (v0.11.0) (19) using the scRNA expression matrix and transcription factors in AnimalTFDB. AUCell [14].
Cell-cell interaction analysis: Cell-cell interactions (CCI) between different cell types were predicted based on known ligand-receptor pairs by Cellphone DB v2.1.0. [16]. Predicted interaction pairs with p-value < 0.05 and average log expression > 0.1 were considered significant. Differentially activated ligand-receptor pairs between groups were visualized by dot plot in ggplot2. [12-14].
Olink Proteomics Assay
Plasma cytokines markers were assessed using the commercially available Olink® Target 96 Inflammation panels from Olink (Uppsala, Sweden). In brief, the target protein binds to the double oligonucleotide labeled antibody probe with high specificity, and then the microfluidic real-time PCR amplification of the oligonucleotide sequence is used to quantitatively detect the resulting DNA sequence. Using internal and external controls, the resulting 1 https: //olink.com Bao et al. [15,16].
DEP analysis
The R package “Olink®Analyze” was used to identify the sets of DEPs between the two groups. Proteins with a p-value of <0.05 were considered to be differentially expressed. The visualization of DEPs including volcano plots and heatmaps was performed using the standard R package “ggplot2.” A higher AUC value reflected the greater performance of the classifier. The AUC value of 1.0 represented a perfect assignment, whereas an AUC of 0.5 represented an unreliable test (gray line) [14].
Go enrichment analysis and pathway enrichment analysis
All GO terms that were significantly enriched in DEPs compared to the genome background are provided by GO enrichment analysis. The “ggplot2” R tool was used to visualize the findings of GO and KEGG enrichment analysis, and the top 20 GO terms and KEGG pathways were shown as a bubble chart [14].
Correlation analysis
Pearson’s correlation analysis was used to determine the correlation between the expression levels of two DEPs, and the scatterplots illustrated the strongest correlation. Pearson correlation tests were also employed to analyze the correlation between the DEPs and clinical features of patients. The significance of correlation coefficients was calculated using the p-value calculator for correlation coefficients [14]
Statistical analysis
All statistical analyses were performed using the R software “Olink®Analyze” (V.2.0.0). A value of p of less than 0.05 was considered statistically significant [15,16].
RESULT
Clinical Benefit Characteristics
Follow-up of the patient after treatment every four weeks, the patient was asked to physical examination and CT, divided the long survival group with 2.5 years as A group and 1.5 years as B group was significantly different (P<0.003). The up of expression of cytokines genes is compared between long and short group (Table 1 and Figure 1).
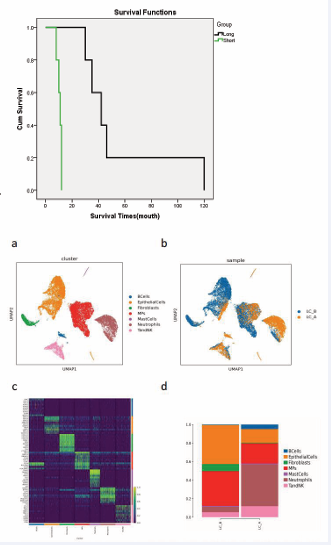
Figure 1: A group of Long survival time is significantly longer than B group of short survival time. Global transcriptome landscape of lung cancer before and after lung cancer treated with hapten hanced intratumoral injection with cyctooxic drug plus hapten with total cell in 20925 a: The UMAP cell cluster was formed by dimensional-reduction clustering, and a total of 7 cell types were obtained, including B cells, Epithelial cells, Fibroblasts, Mononuclear phagocytes, Mast cells, Neutrophils, T and NK cells. Different colors represent different cell types b: The distribution of various cell types before and after treatment, with blue representing before treatment and yellow representing after treatment c: Heat map of marker genes of top 10 genes in each cell type d: Histogram of the proportion of various cell types before and after treatment and showed the lung cancer cell and Neutrophils dramatic drop, B cells and Neutrophils, T and NK cells significantly increased
ScRNA-Seq
Resulted in a total of 20925 cells, these include B cells,Epithelial cells, Fibroblasts, Mononuclear Phagocytes (MPs), Mast cells, Neutrophils, T and NK cells, the proportion of Epithelial cells, MPs and Fibroblasts decreased in LC_A sample compared with LC_B sample, while the proportion of Neutrophils, T and NK cells and B cells was higher (Figure 2 a, b, d).
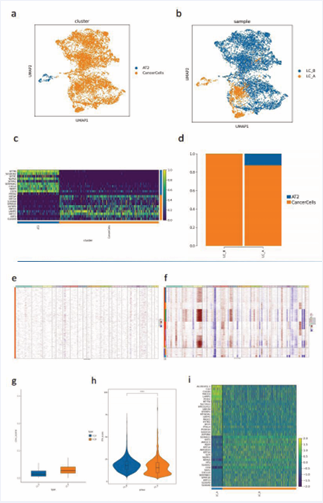
Figure 2: Changes of tumor cell composition in patients with lung cancer before and after treatment. a: Colored UMAP by cell type: Comments on Epithelial cells segmentation Two subtypes, including Alveolar type II (AT2), cancer cells were obtained with a total of 6929 cells. b: Colored UMAP according to samples: LC_A samples with AT2 cell sub population are more than LC_B samples. c: Heat map of top 10 differential genes; d: Histogram of cell proportion: cancer cell in LC_B sample was higher than LC_A sample; the proportion of cancer cells in LC_A sample decreased while the proportion of AT2 cells increased; e: Conducted CNV analysis with reference to T and NK cell; f: Heat map for cancer cell inferCNV: LC_B Chromosome increase or deletion is more obvious compared with LC_A sample; g: Analysis of cancer cell CNV score: LC_A sample has a lower CNV score, which indicates that compared with LC_B sample, the malignant degree of LC_A samples is low; h: Analysis of tumor heterogeneity in cancer cell ITH compared with LC_B, the ITH score of LC_A sample is lower, and the data show that the malignant degree of LC_A samples was low compared with LC_B sample, In Fig. I, gene difference analysis of cancer cell showed that LC_B sample was higher than LC_A sample S100A11, S100A8 and S100A9 are highly expressed.
20925 cells’ RNA transcription profiles with 7 cell populations were identified (Figure 1). Using canonical cell-type markers, we annotated the obtained cell populations into three major categories: B cells, Epithelial cells, Fibroblasts, Mononuclear Phagocytes, Mast cells, Neutrophils, T and NK cells; (Figure 3 a, b, c, d), The cell types were annotated according to the top 10 marker gene of each cell (Figure 1c, Figure 2c). Tumor copy number variation analysis (CNV) showed obvious copy number variation in epithelial cells with Conducted CNV analysis with reference to T and NK cell, such as increased number of insertions on chromosome, and large number of fragment deletions on chromosome (Figure 3 e, f). Therefore, epithelial cells were identified as malignant cells in sample of LC_B, and AT2 cells appears excepted epithelial cells in sample of LC_A. The score of lung cancer cell malignancy showed that the cell malignancy was relatively low after treatment (Figure 3 g, i).
There were 6603 MPs cells in total, and two subtypes were obtained, including conventional type 2 dendritic cells, macrophages. Macrophages consist of 6554 cells. T cell activation, MHCII signaling pathway and phagosome signaling are up-regulated in Macrophages_FCN1; Macrophages_HSPA6 involves the up-regulation of ribosome, RNA transcription, antigen processing and presentation signals (Figures 3 f to k).

Figure 3: Changes of MPs groups in patients with lung cancer before and after treatment; a: UMAP colored by cell type: MPs totaled 6603 cells, subdivision notes obtained two different subtypes, including Conventional type 2 dendritic cells, Macrophages; b: bar chart of cell proportion: LC_A and LC_B samples were all Macrophages dominate; c: map: Macrophages a total of 6554 cells, the unsupervised cluster was divided into 7 heterogeneous subgroups, i.e Macrophages_NUPR1, Macrophages_IL1B, Macroph ages_C1QB, Macrophages_HSPA6, Macrophages_MKI67, Macrophages_FCN1, Macrophages_MMP7; d: Violin diagram of top 3 Differential Genes; e: Histogram of cell proportion: compared with LC_B sample, LC_A sample with the cells of Macrophages_HSPA6 and Macrophages_FCN1 were obvious high, The proportion of Macrophages_NUPR1 is obviously increased, while macrophages_nupr1 showed a downward trend; f, g: GO/KEGG enrichment analysis: Macrophages_NUPR1 finds T cell activation, MHC? signaling pathway down-regulated, and antigen processing and presentation signal down-regulated; h,i: GO/KEGG enrichment analysis: T cell activation, MHC? signaling pathway and phagosome signaling are up-regulated in Macrophages_FCN1; j,k: GO/KEGG enrichment analysis: Macrophages_HSPA6 involves the up-regulation of ribosome, RNA transcription, antigen processing and presentation signals.
Different neutrophils subtypes were obtained by subdivision annotation in a total of 3315 cells, including Neutrophils1, Neutrophils2, Neutrophils3, Neutrophils4 (Figures 4 a, b, c). The proportion of Neutrophils1, Neutrophils3 and Neutrophils4 cells increased and Neutrophils2 cells decreased (Figure 4d); comparatively, Neutrophils2 is pre differentiated, the posterior end of Neutrophils1, 3 and 4 was differentiated;
The neutrophils2 of LC_A sample decreased compared with that of LC_B sample, and the neutrophilS2 of LC_A sample decreased in LC_B sample, Neutrophils were more at the end of differentiation (Figures 4 e, f, g, h, i). Here, hapten interaction with tumor antigens, it was found that T and NK cells from total 1384 cells included, subdivided notes yielded 5 distinct subtypes, including CD8+ effector T cells (CD8TEFF, CD8+ tissue-resident memory T cells (CD8Trm), natural killer cells (NK), naive T cells, regulatory T cells (Tregs); (Figures 5 a, b, c), CD8+ effector T cells, CD8Trm and Naive T, increased while Treg decreased (Figures 5 a, b, d).

Figure 4 Changes of neutrophil groups in patients with lung cancer before and after treatment; a: Colored UMAP by cell type: 4 different subtypes were obtained by subdivision annotation.
A total of 3315 cells, including Neutrophils 1, Neutrophils 2, Neutrophils 3, Neutrophils 4; b:Violin diagram of top3 differential genes; c: Cell proportion bar chart: LC_A sample compared with LC_B sample, the proportion of Neutrophils1, Neutrophils3 and Neutrophils4 cells increased. The proportion of Neutrophils 2 cells decreased; d: Pseudo-sequential sequencing of all cells; e & f showed pseudo-temporal analysis according to cell type coloring diagram: relative Neutrophils 2 is predifferentiated; The posterior end of Neutrophils1, 3 and 4 was differentiated; The Neutrophils 2 of LC_A sample decreased compared with that of LC_B sample, and the neutrophilS2 of LC_A sample decreased. In LC_B sample, Neutrophils were more at the end of differentiation; g,h,i: GO enrichment analysis: inter-group GO enrichment of Neutrophils1, 3, and 4 was performed Set, LC_A samples were compared with LC_B samples, Neutrophils1, 3 and 4 Neutrophil activation and neutrophil mediated immunity were up-regulated in subpopulations
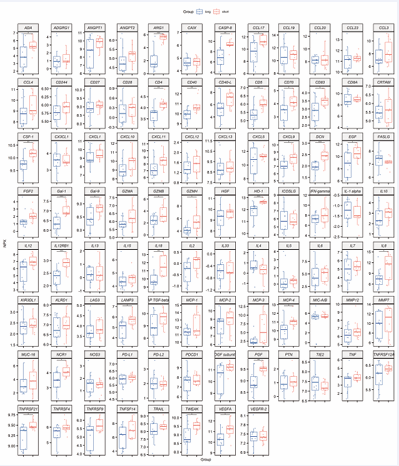
Figure 5 Note: The horizontal coordinates of the box diagram are different groups, and the vertical coordinates are NPX values.
Those results has confirmed that initiation of immune response at the cell level of Phagocytes (MPs), Mast cells,Neutrophils, T and NK cells, CD8TEFF at the top 10 marker gene of each cell.
Olink Proteomics
Quantitative analysis of protein expression Olink project standardized processing of protein NPX data for quantitative analysis of protein expression: ggpubr package was used to draw box plots for the expression levels of each protein in different groups, and the significance was marked based on subsequent statistical analysis (Figure 6).
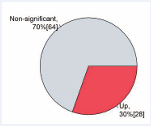
Figure 6 Note: Red represents significantly up-regulated differential protein proportion; Blue is significantly down-regulated differential protein proportion; Gray is the proportion of non-significant difference protein
The degree and significance of differences in NPX expression values of the same protein under different experimental conditions could be clearly found through the results. The following is the box diagram of the expression levels of 92 proteins, and the high-definition picture is attached (“ /backup/QPE/Olink_box_sig_anova_backup. pdf “).
Differential protein analysis between groups: The proportion of differential protein and non-differential protein in Olink project was analyzed (Figure 7).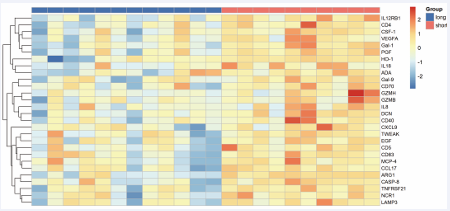
Figure 7 Note: The horizontal coordinate of Panel differential protein clustering heat map is the sample name, the vertical coordinate is Panel differential protein, and the legend annotation Group is different groups.
Cluster heat map of different proteins between groups. Based on the NPX value of the protein significantly up-regulated or down-regulated obtained by the above statistical analysis, the cluster heat map is drawn after z-score processing. When there is only or less than one protein with significant difference, the cluster heat map of protein expression with significant difference is not drawn. For high-definition images (Figure 8), (“ /backup/Diff_pro/Olink_volcano_*_ sig_gene_heatmap.pdf “).

Figure 8 Note: All differential proteins (genes) were labeled according to significance threshold (p-value < 0.05) segmentation. The horizontal coordinate is the difference between groups. Since NPX is the value after log2 processing, fold change is log2foldchange; The ordinate uses -log10 (p-value) to represent the negative logarithm of the p-value of the significance of the T-test. The horizontal dotted line is p-value = 0.05, and the vertical dotted line is foldchange=0. The red dots represent significantly up-regulated differential genes, the blue dots represent significantly down-regulated differential genes, and the gray dots represent non significant differential genes
Based on the above statistical analysis results, ggplot2 was used to draw a volcano map, which could well show the degree of up-regulated and down-regulated differential protein distribution. The diagram shows a volcanic map of the difference analysis between the two sets of data (Figure 9). Detailed results can be found in the annex (“ /result/04.Diff_pro/Olink_*_ volcano. * “).

Figure 9 A: Significance difference GO bar chart, B: Significant difference GO drum chart
Differential protein functional enrichment analysis: The general functional databases that provide annotations in this study mainly include GO, KEGG, COG, etc. Functional annotation of the identified proteins was conducted using these databases to understand the functional properties of different proteins, and biological functional enrichment Analysis was performed on the differential proteins through GO (Gene Ontology Analysis) and KEGG (KEGG Pathway Analysis). Enrichment fractions of differential proteins in each biological pathway and process were obtained, and enrichment bar charts and bubble charts were drawn (Figures 10 a, b).

Figure 10 A: kegg bar chart of significance difference; B: kegg drum chart of significant difference
KEGG Pathway Analysis: The annotation results of the pathway of differentially expressed proteins are shown in the following figure. The whole pathway is composed of complex biochemical reactions catalyzed by multiple enzymes. The enzymes related to differential expressed genes in this pathway map are marked with different colors. For the enzyme number down-regulated,the specific sequence information and biological function information of the enzyme can be queried in the KEGG database online website (Figures 11 a, b).
Those result has confirmed that the cytokines were induce by HEIC which including Gal-1, Ho-1, IL12RB1, DCN, PGF, CD4, CD4,CSF-1,NCR1, CD40,IL-18, CASP-8, ARG1,TNFSF21, TWEAK, LAMP3,VEGFA, MCP-4, Gal-9, CD70, CAMPB, CXL-9, GZMH, CCL17,CD83, GZMB, ADA, EGF, IL8.
DISCUSSION
Lung cancer is one of the leading causes of cancer death in the United States. Scientific treatment of non-small cell lung cancer (NSCLC) has made significant progress over the past decade. The lung cancer screening trial found that screening high-risk individuals using low-dose chest computed tomography reduced lung cancer mortality by 20 percent and mortality by 6.7 percent. With the application of several tyrosine kinase inhibitors in patients with EGFR, ALK, ROS1, and NTRK mutations, treatment options for lung cancer have also been developed. Similarly, and more interestingly, immune checkpoint inhibitors (ICIs) have dramatically changed the treatment landscape for non small cell lung cancer [17]. However, despite the success of ICIs, resistance to these drugs limits the number of patients who can achieve a lasting response. Therefore, there is a need to better understand the requirements for an effective and safe anti-tumor immune response after ICIs treatment. Weather it is related to the heterogeneity of the tumor and what treatment the tumor has received in the past [18-20].
Hapten is an immune modulator to modified the epitope of tumor antigens from death tumor cells killed by cytotoxic drug and became to a neo tumor associate antigens [5,6]. Hydrazine is instead of penicillin as a hapten, which can induce some adverse reactions, such as drug-induced lupus, often involve active intermediates, and the oxidation of hydrazine leads to covalent binding of active intermediates to proteins, tumor-associated antigens (TAAs), and through covalent binding to TAAs proteins to convert TAAs to neo TAAs [6-10].
scRNA-seq has showed that immunity reaction started and active in the body after HEIC, MPs, mature DC cells present a higher capacity of antigen presentation by MHC II signaling pathway, active T and NK cells including CD8+ effector T cells, CD8Trm, NK cells, naive T cells, regulatory T cells; memory T cells, CD8+ effector T cells, CD8Trm and Naive T increased in LC_A sample, while Treg decreased in LC_B sample.
Above initiating an immune response has showed the inflammation is a special inflammation, like vaccine manufacturer to produce the D8+ effector T cells, CD8Trm, natural killer cells, naive T cells. It confirmed the initiation of immunity reaction by hydrazine with chemotherapy in tumor.
Coordination of multiple cytokines has produced a better therapeutic effect. The results of Olink proteomics compared with the long survival and the short survival group of lung cancer patients with significantly improved (P<0.003), it was found that up 30% from box chart of expression of 92 proteins in long survival group of patients, which including Gal-1, Ho-1, IL12RB1, DCN, PGF, CD4, CD4,CSF-1,NCR1, CD40,IL-18, CASP-8, ARG1,TNFSF21, TWEAK, LAMP3,VEGFA, MCP-4, Gal-9, CD70, CAMPB, CXL 9, GZMH, CCL17,CD83, GZMB, ADA, EGF, IL8, another 70 genes with no-significantly changes in the box chart of 92 proteins (Figures 5-8), which all work together played a comprehensive and cooperative role in control tumor growth and resulted in longer survival group than short survival group. Interleukins and cytokines induced by hydrazine with chemotherapy in HEIC may serve as means of communication for innate and adaptive immune cells as well as non-immune cells and tissues. These properties of interleukins and cytokines can be used to improve immunotherapy to increase efficacy and limit side effects [21-24].
We have demonstrated that immune response was initiated by hydrazine with chemotherapy with same regimens for lung cancer patients in similar stages, it was found that the longer survival group has up 30% expression of genes. These significant differences may be related to the heterogeneity of immune cell individuals and tumor environment between the two groups, and lung cancer has been reported to be a highly heterogeneous disease at the single-cell level [20]. The high expression of 28 genes in long surviving group has indicated the combined effect of these gene products all worked together. At the perspective of immunological drugs, it is difficult to have so many immunological regimens or bio products to give patients at same time, however, it is possible to induce a multi factorial immunotherapy thorough locally tumor injection of hapten with chemo drugs, or new mRNA vaccine related genes.
Finally, further detailed studies with different haptens for enhanced intratumoral injections are needed to overcame a comprehensive heterogeneity of immune cells individual and tumor environment through multiple injections of different hapten combinations of cytotoxic drugs into primary pancreatic tumor site.
Authors Statement
Baofa, Yu, MD conceived the concept and provided overall supervision of all experiments and write.
Jian Zhang, MD, manage the data and analysis
Yan Han, help to manage the data and analysis
Feng Gao, MD, helped the clinical sample collection
Peng Jing, MD, He helped the clinical data collection.
Guoqin Zheng, MS, conducted and communicated with single cell company and data analysis.
Shengjun Zhou, MD, help to collected the clinical samples
Ethical Statement
All procedures and protocols in the study have been reviewed and approved by Ethical Committee of the Beijing Baofa Cancer Hospital (TMBF 0010, 2015). All informed consent forms from patients have been signed prior to the start of the study. Ethical Approval: approved by the Ethical Committee of the Beijing Baofa Cancer Hospital (TMBF 0010, 2015). Funding Sources:
Data Availability Statement
The data that support the findings of this study are available from [third party name] but restrictions apply to the availability of these data, which were used under license for the current study, and so are not publicly available. Data are however available from the authors upon reasonable request and with permission of [third party name].
Financial Support
This study was sponsored in part by Tai Mei Baofa Cancer Hospital, Dongping, Shandong Province, China 271500.
REFERENCES
- Oliver A l. Lung Cancer: Epidemiology and Screening. Surg Clin North Am. 2022; 102: 335-344.
- Shetal A Patel, Jared Weiss. Advances in the Treatment of Non-Small Cell Lung Cancer: Immunotherapy. Clin Chest Med. 2024; 2: 237-247
- Cortiula F, Reymen B, Peters S. Immunotherapy in unresectable stage III non-small-cell lung cancer: state of the art and novel therapeutic approaches. Ann Oncol. 2022; 9: 893-908.
- Yu B, Lu L, Gao F. Hapten-enhanced therapeutic effect in advanced stages of lung cancer by ultra-minimum incision personalized intratumoral chemoimmunotherapy therapy. Lung Cancer (Auckl). 2015; 6: 1-11.
- Jing P, Liu J, Li J. Hapten improved overall survival benefit in late stages of non-small cell lung cancer (NSCLC) by ultra-minimum incision personalized intratumoral chemo immunotherapy (UMIPIC) therapy with and without radiation therapy. J Cancer Prev Curr Res. 2016; 4: 119-122.
- Arce C, Segura-Pacheco B, Enrique Perez-Cardenas E. Hydralazine target: from blood vessels to the epigenome. J Transl Med. 2006; 28: 4-10.
- Mitchell JA, Gillam EM, Stanley LA. Immunotoxic side-effects of drug therapy. Drug Saf. 1990; 3:168-178.
- Sim E. Drug-induced immune-complex disease. Complement Inflamm. 1989; 6:119-26.
- Hofstra AH, Uetrecht JP. Reactive intermediates in the oxidation of hydralazine by HOCl: the major oxidant generated by neutrophils. Chem Biol Interact. 1993; 89:183-196.
- Yu B, Han Y, Zhang J. Acute Tumor Infammation with CD4/8+ and CD11+ Prolong the Survival Effect Induced by Intratumral Injection Optimum Combination of Chemotherapy Drugs with Hydralazine as Hapten in Animal Model. Japanese J Gastroenterology and Hepatology. 2022; V8: 1-7
- Yu B, Fu Q, Han Y. An Acute Inflammation with Special Expression of CD11 & CD4 Produces Abscopal Effect by Intramoral Injection Chemotherapy Drug with Hapten in Animal Model. J Immunological Sci. 2022; 6: 1-9
- Kechin A, Boyarskikh U, Kel A. cutPrimers: A New Tool for Accurate Cutting of Primers from Reads of Targeted Next Generation Sequencing. J Comput Biol. 2017; 24: 1138-1143.
- Yu B, Gao F, Jing P. Cancer Immunotherapy Preparation and Immune Cells Activation through Hapten-Enhanced Chemotherapy in Primary Lung Cancer. J Basic Clin Pharma. 2023; 14:10-16.
- Dobin A, Davis CA, Schlesinger F. STAR: ultrafast universal RNA-seq aligner. Bioinformatics. 2013; 29: 15-21
- Ding Z, Wang N, Ji N. Proteomics technologies for cancer liquid biopsies. Mol Cancer. 2022; 2: 53.
- Bao XH, Chen BF, Liu J. Olink proteomics profiling platform reveals non-invasive inflammatory related protein biomarkers in autism spectrum disorder. Front Mol Neurosci. 2023; 24: 1185-2021.
- Efremova M, Vento-Tormo M, Sarah A. “CellPhoneDB: inferring cell-cell communication from combined expression of multi-subunit ligand-receptor complexes.” Nature protocols. 2020: 1484-1506.
- Quinn WJ, Jiao J, TeSlaa T. Lactate Limits T Cell Proliferation via the NAD(H) Redox State. Cell Rep. 2020; 33: 108500.
- Duma N, Santana-Davila R, Molina JR. Non-Small Cell Lung Cancer: Epidemiology, Screening, Diagnosis, and Treatment. Mayo Clin Proc. 2019; 94: 1623-1640.
- Bagchi S, Yuan R, Engleman EG. Annu Rev Pathol. Immune Checkpoint Inhibitors for the Treatment of Cancer: Clinical Impact and Mechanisms of Response and Resistance. 2021; 16: 223-249.
- Cagnoni AJ, Giribaldi ML, Blidner AG. Galectin-1 fosters an immunosuppressive microenvironment in colorectal cancer by reprogramming CD8+ regulatory T cells. Proc Natl Acad Sci U S A. 2021; 25: e2102950118.
- Nitti M, Piras S, Marinari UM. HO-1 Induction in Cancer Progression: A Matter of Cell Adaptation. Antioxidants (Basel). 2017; 6: 29.
- Dranoff G. Cytokines in cancer pathogenesis and cancer therapy. Nat Rev Cancer. 2004; 4: 11-22.
- Conlon KC, Miljkovic MD, Waldmann TA. Cytokines in the Treatment of Cancer J Interferon Cytokine Res. 2019; 39: 6-21.
- Wu F, Fan J, He Y. Single-cell profiling of tumor heterogeneity and the microenvironment in advanced non-small cell lung cancer. Nat Commun. 2021; 12: 25-40.