Artificial Neural Network based Quality Boosted Regional Drought Monitoring
- 1,2. Department of Statistics, COMSATS University, Pakistan
- 3. Department of Statistics, University of Okara, Pakistan
Abstract
This study uses the Standardized Precipitation Index (SPI) and machine learning model to monitor and forecast drought in arid and semi-arid regions. In the designated area drought phenomena are important for drinking water and agriculture. In particular, the study uses the SPI to forecast future instances of drought in the northern regions of Pakistan. We focused on enhancing the precision and quality of regional drought characterization while establishing a continuous monitoring process. A drought indicator termed the Artificial Neural Network based Quality Boosted Drought Index (ANN-QBDI) is introduced with the methodology involves assigning distinct weights to an ANN-based X-bar chart presenting it alongside regional precipitation aggregate data. Using the dataset of northern regions of Pakistan, applied the applications of ANN-QBDI. Through a pairwise comparison using the Pearson correlation coefficient, the study contrasts ANN-QBDI with the Regional Normalize Precipitation Index (RNPI). The ANN-QBDI exhibits more distinct regional characteristics in its correlations with other meteorological stations compared to RNPI along with a significantly lower Coefficient of Variation. These findings affirm ANN-QBDI as a valuable tool for regional drought analysis. The ANN-QBDI methodology introduces a unique approach to mitigating the impact of extreme values and outliers when aggregating regional precipitation data.
Keywords
• Drought Analysis; Artificial Neural Network; Machine Learning; Precipitation Index
Citation
Noor-ul-Amin M, Laiq M, Ahmad M (2025) Artificial Neural Network based Quality Boosted Regional Drought Monitoring. Ann Biom Biostat 8(1): 1042.
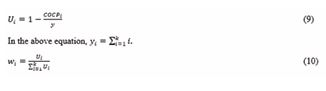
INTRODUCTION
Drought is universally recognized as a highly severe natural hazard that can manifest under various climatic conditions. Its distinctive feature lies in the unstructured implications that disperse across extensive geographical regions [1]. According to the Wilhite and Glantz [2], drought encompasses four categories: agricultural drought, meteorological drought, hydrological drought, and socio-economic drought. Drought indices play a pivotal role in monitoring and assessing droughts simplifying the intricate relationships between climate and related parameters [3]. Among these, our study specifically focuses on meteorological drought, which is characterized by a deficiency in precipitation over an extended period. This type of drought is particularly important for understanding and predicting drought conditions using climatic data. In order to improve the accuracy and reliability of drought assessments, Alizadeh and Nikoo [5], developed a fusion based methodology to predict meteorological drought using remote sensing data. Muthuvel et al. [5], investigates the impact of future global concurrent droughts on maize yield, highlighting the potential for significant reductions in maize production due to the increasing frequency and severity of simultaneous drought events worldwide. Gong et al. [6], focuses on mesoscale NDVI prediction models in the arid and semiarid regions of China, examining their performance under changing environmental conditions. This research underscores the importance of accurate vegetation monitoring to inform sustainable land management practices in these vulnerable areas. These indices are crucial for simplifying the complex interplay of various climate parameters during drought monitoring and assessment. To quantitatively evaluate climate anomalies in terms of intensity, duration, frequency and spatial extent, scientists rely on drought indices [7]. Numerous specialized indices have been proposed to quantify the four types of drought events. Precipitation being a pivotal variable for studying meteorological drought has been employed to develop various indices. Commonly used meteorological drought indices include discrete and cumulative precipitation anomalies the Z-score or Standardized Rainfall Anomalies, Rainfall deciles, the Palmer Drought Severity Index (PDSI), the Bhalme Mooley Drought Index (BMDI), the Rainfall Anomaly Index (RAI) and the Standardized Precipitation Index (SPI). The main goal of SPI was to develop a versatile index that could distinguish between different kinds of drought and the significant temporal responses to anomalies in rainfall across different hydrological subsystems. In order to do this, the rainfall deficit was quantified over a variety of time scales. The Standardized Precipitation Index (SPI) has been widely employed in prior research due to its simplicity in calculation and its effectiveness in identifying drought across various time scales of 3, 6, 9, 12, 24, and 48 months [8]. SPI focuses solely on precipitation and operates under two key assumptions: 1) that the variability in precipitation exceeds that of other factors like temperature and potential evapotranspiration (PET); and 2) that these other factors exhibit minimal temporal trends [9]. However, these assumptions face challenges in the context of climate change, marked by rising temperatures and increased atmospheric evaporative demand [10]. This study aims to explore the efficacy of a machine learning model in predicting meteorological drought indices across different geographical regions in Pakistan, which has experienced several drought incidents in recent decades [11]. The Artificial Neural Network (ANN) model is employed and evaluated for predicting precipitation-based drought indices, the SPI at a monthly time-scale. Historical data from 1981 to 2021 were utilized for developing and validating the model. This work provides a new framework for estimating mean precipitation by including regional temperature behavior and wind pressure. The mean precipitation estimates are computed with an artificial neural network. After that, we use the combined data of precipitation, temperature and wind to compute the standard errors. By utilizing the standard error of mean precipitation data, a control chart is generated to generate the Artificial Neural Network-Quality Boosted Drought Index (ANN-QBDI). For the analysis, time series data on monthly mean temperature and precipitation were obtained from six meteorological stations located in the northern regions of Pakistan. The 12-month Standardized Precipitation Index (SPI) time scale is part of this comparative analysis, which also includes mean, standard deviation, and Pearson correlation statistics. To address this concern, we have revised the introduction to explicitly highlight the innovation of our research. Our study innovatively employs an Artificial Neural Network (ANN) model to predict meteorological drought indices, specifically focusing on the SPI, across different geographical regions in Pakistan. Unlike previous studies, our research integrates regional temperature behavior and wind pressure data into the prediction model, enhancing the accuracy and reliability of drought forecasting. This novel approach not only advances the methodology for drought prediction but also contributes to a deeper understanding of the complex interactions between climate variables and drought dynamics. We believe that these enhancements effectively distinguish our study from existing literature and underscore its significance in the field of drought monitoring and assessment.
MATERIALS AND METHODS
In this section, we present a comprehensive methodology for enhancing regional precipitation estimates in the context of global warming scenarios. First, we described the case study. After that we use combined data of precipitation, temperature and wind, we use the standard error of ANN to make control charts are described and then the development of the ANN-QBDI is discussed.
Case study
Pakistan has a wide variety of climates, with dry and semi-dry climates dominating the majority of its area. Due to insufficient or erratic rainfall, these regions commonly experience periodic drought events that have a significant negative influence on the country’s natural resources and public health. For this study, six stations with extensive records and reflections of these climatic conditions were carefully selected. The locations of these selected stations, which are spread across the country, are displayed in Figure 1.
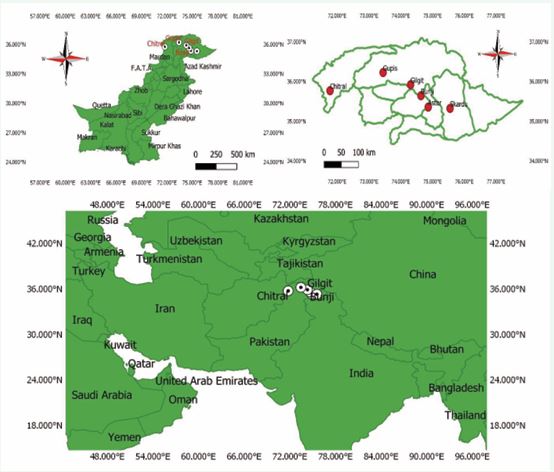
Figure 1 Selected Regions of Pakistan to assess the ANN-QBDI
Data
To conduct this research, meteorological data covering the years 1981–2021 was obtained from National Aeronautics and Space Administration (NASA). This dataset includes monthly measurements of rainfall, temperature, and wind speed, collected at a high spatial resolution of 0.25 degrees. Such a detailed resolution allows for a comprehensive regional analysis, capturing local variations in meteorological conditions that are crucial for accurate drought monitoring. The statistics of climatic parameters on the monthly scale at different study stations. The data retrieval involved downloading gridded datasets from NASA’s online data portals. Several pre processing steps were necessary to ensure the viability and reliability of the data for analysis. Initially, any missing or incomplete data points were identified and addressed through interpolation methods to maintain the integrity of the dataset. Figure 2 depicts the flowchart of the modeling process in this study.
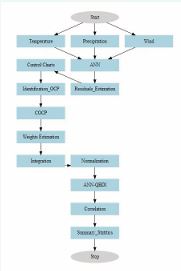
Figure 2 Flow chart of ANN-QBDI
To evaluate the accuracy of ANN-QBDI, this research conducts a comparative analysis using the mean-variance and coefficient of variation of the correlation coefficient between ANN-QBDI and the Regional Normalized Precipitation Index (RNPI) with the SPIs of individual meteorological stations. In this study, RNPI is calculated by standardizing the Simple Average Time Series Data (SATSD) for all stations. The standardization method for SATSD is identical to that used for WMTSD.
ARTIFICIAL NEURAL NETWORK
The Artificial Neural Network (ANN) is a computational approach that emulates the structure and functioning of the human brain. Originating in the 1940s and initially developed by McCulloch and Pitts [12], this methodology has steadily advanced with improvements in calibration techniques [13]. Possessing the capability to model relationships between sets of independent and dependent variables inputs and outputs to the network, ANNs can be tailored to diverse relationships given sufficient data and complexity [14]. An advantageous aspect of the ANN technique is its ability to operate without the modeler having to explicitly define the intermediate relationships/ physical processes between inputs and outputs [15]. This characteristic renders ANNs particularly well suited for analyzing intricate processes such as drought forecasting where understanding the relationships among a multitude of input variables and the output is essential. Despite the availability of various network types and training algorithms this study outputs for the Multi-Layer Perceptron (MLP) due to its widespread usage particularly in hydrological research [16]. For ANN model we use the drought data for six meteorological stations are Astor, Bunji, Chitral, Gilgit, Gupis and Skardu. In this model, the precipitation is independent variable, Temperature and Wind are dependent variable. Using the “neuralnet” package is RStudio version 4.3.1 to predict the values error. The hidden layers and output layers for ANN model are shown in Figure 3, for all meteorological stations
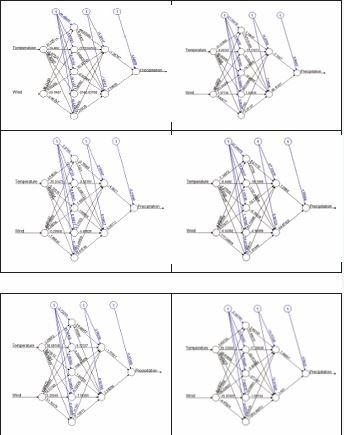
Figure 3 Layers of ANN Model
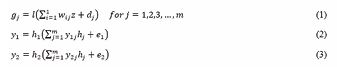
l represents the activation function for the hidden layer h1 and h2 shows the activation function for the output layer corresponding to temperature and wind. wij denotes the weights connecting the precipitation to the hidden layer. d j represents the bias for the hidden layer. y1j and y2j are the weights connecting the hidden layer to the output layer for the temperature and wind. e1 and e2 represents the biases for the output layer.
ANN based X-bar control chart
The Statistical Quality Control (SQC) in statistics presents the various control charts for tracking industrial and environmental processes. Numerous chart types have been created to track a range of activities since Shewhart first introduced the idea of a control chart in 1924. According to Noor ul Amin and Sarwar [17], Shewhart control charts are acknowledged to be memory-less, meaning that past data is not taken into consideration. The remarkable capacity of these charts to identify significant changes in the process has prompted numerous research endeavors aimed at enhancing their efficacy Noor ul Amin et al [18].

The x-bar control chart has the following mathematical structure:
Proposed drought index based on ANN
The Artificial Neural Network-Quality Boosted Drought Index (ANN-QBDI) is described in this section. ANN plays a significant role in drought monitoring, as stated in section 3. Using ANN, we forecast the standard error values in ANN-QBDI. Next, we generate the x-bar control chart using the standard error of ANN. In order to do this, we use the X-bar control chart to determine the Out-of-Control Point (OCP). Furthermore, the cumulative count of OCP (COCP) is used to integrate the weights for the aggregation of region data. Let X ∈ X1 , X2 , X3 ,… , Xk represent the precipitation time series data from various meteorological stations within a designated area. The primary goal in this case is to create weights for the aggregation X ∈ X1 , X2 , X3 ,… , Xk in a way that places stations with high COCPs at a lower weight than stations with low COCPs.
Incorporate of ANN based X-bar control chart: In the initial step of ANN-QBDI, we detect the OCP using X-bar control. By averaging the time series data from every meteorological station in a specific geographic area, the UCL and LCL in the X-bar control chart are calculated. The meteorological station mean time series data should be represented by Xi . The higher and lower control limits for Xi were built under the X-bar control chart. The (COCP1 , COCP2 , COCP3 ,…,COCPk ) displays the vector whose total values are outside of the UCL and LCL
Weights Estimation: In this stage of ANN-QBDI, weights are defined for the aggregation of time series data from multiple meteorological stations. In this case, the weight estimate derives from the COCP that is specific to every meteorological station. The following formulas ensure that observatories are given higher weights for comparably small COCP and lower weights for comparably bigger COCP.

Here, k denotes the number of meteorological stations.
Integration: The prediction weights for the regional precipitation data aggregation are allocated in this step of our process. There are several methods to compute the Weighted Time Series Data (WMTSD) quantitatively.

WMTSDi denotes the regional precipitation data in the equation above using the suggested weighting scheme, where Xij denotes the time series data from the jth meteorological station and the wij represents the estimated weights in the region.
Normalization: Normalization is the last stage of ANN-QBDI. Utilizing K-Component Gaussian Mixture Distribution (KCGMD) Ali et al. [19], we have modeled hydrological data. This step involves the spatiotemporal regional aggregation of precipitation time series data, followed by a fitting of the KCGMD’s Cumulative Distribution Function (CDF) to normalize the data. The following mathematical statement represents the CDF of the KCGMD:

This paper derives ANN-QBDI using the normalization approximation proposed by Abramowitz and Stegun [20]. The normalization approximation’s mathematical structure is provided by the equation that follows.
RESULTS AND DISCUSSION
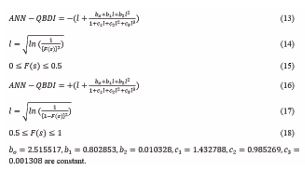
The results of the ANN based X-bar chart’s identification of Out-of-Control Points (OCPs) are shown and examined in this part. We divided and arranged the data monthly in order to increase the accuracy of attaining normality. UCLs and LCLs were estimated correspondingly for each month. The monthly data division and plotting for each area made it easier to determine the OCP (Figure 4).
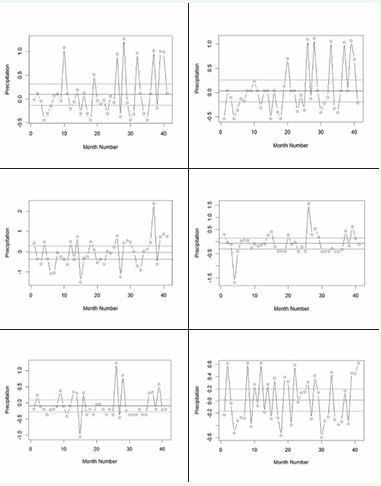
Figure 4 Control Chart for each Meteorological Stations
Table 1 shows the total number of OCP recorded for every station for every month. In January, 22 out Fiof the 41 observations at the Astor station were detected. On the other hand, the OCPs 21, 28, 23, 23 and 34 have been identified for Bunji, Chitral, Gupis, Gilgit, and Skardu. Table 1 displays that the monthly distribution of OCPs in the precipitation time series data for each of the chosen meteorological stations.
Table 1: COCP and weights for all Stations.
|
Month |
Astor |
Bunji |
Chitral |
Gilgit |
Gupis |
Skardu |
|
January |
22 |
21 |
28 |
23 |
23 |
34 |
|
Weights |
0.170861 |
0.172185 |
0.162914 |
0.169536 |
0.169536 |
0.154967 |
|
February |
21 |
16 |
24 |
19 |
29 |
33 |
|
Weights |
0.170423 |
0.177465 |
0.166197 |
0.173239 |
0.159155 |
0.153521 |
|
March |
34 |
16 |
32 |
19 |
25 |
27 |
|
Weights |
0.155556 |
0.179085 |
0.15817 |
0.175163 |
0.16732 |
0.164706 |
|
April |
14 |
10 |
27 |
24 |
38 |
28 |
|
Weights |
0.180142 |
0.185816 |
0.161702 |
0.165957 |
0.146099 |
0.160284 |
|
May |
34 |
17 |
26 |
24 |
19 |
36 |
|
Weights |
0.15641 |
0.178205 |
0.166667 |
0.169231 |
0.175641 |
0.153846 |
|
June |
36 |
30 |
28 |
29 |
21 |
23 |
|
Weights |
0.156886 |
0.164072 |
0.166467 |
0.165269 |
0.17485 |
0.172455 |
|
July |
34 |
26 |
23 |
33 |
19 |
28 |
|
Weights |
0.158282 |
0.168098 |
0.171779 |
0.159509 |
0.176687 |
0.165644 |
|
August |
33 |
26 |
27 |
23 |
17 |
27 |
|
Weights |
0.156863 |
0.166013 |
0.164706 |
0.169935 |
0.177778 |
0.164706 |
|
September |
29 |
23 |
25 |
32 |
16 |
32 |
|
Weights |
0.163057 |
0.170701 |
0.168153 |
0.159236 |
0.179618 |
0.159236 |
|
October |
21 |
25 |
26 |
27 |
21 |
29 |
|
Weights |
0.171812 |
0.166443 |
0.165101 |
0.163758 |
0.171812 |
0.161074 |
|
November |
32 |
26 |
28 |
31 |
17 |
31 |
|
Weights |
0.161212 |
0.168485 |
0.166061 |
0.162424 |
0.179394 |
0.162424 |
|
December |
22 |
24 |
25 |
23 |
23 |
34 |
|
Weights |
0.170861 |
0.168212 |
0.166887 |
0.169536 |
0.169536 |
0.154967 |
Weights Estimation
The degree of heterogeneity or homogeneity observed between stations in various months is used to estimate these weights. This section discusses and explains the results regarding the weights that are obtained from the suggested weighting method. By using this method, stations are assigned weights based on their COCP, those with lower COCP are assigned higher weights, and those with higher COCP are assigned lower weights. This is understandable given the established fact that stations with lower COCPs tend to match more closely with the regional data while those with higher COCPs tend to deviate more. Thus, the stations with lower COCP should to be assigned larger weights. Table 1 presents the monthly weight distribution using the suggested weighting method for each station. Each station’s significance varies from month to month, which is reflected in the spatiotemporal change of these weights.
The effectiveness of the ANN-QBDI can be assessed by using the Coefficient of Variation (CV) and Pearson correlation (r). To assess consistency, we compared the ANN-QBDI and RNPI correlations with the Standardized Precipitation Indices (SPIs) of particular meteorological stations. Figures 5a, 5b, and 5c illustrate the temporal and associative behavior of RNPI and ANN-QBDI. Table 2
Figure 5 Density Plot and SPI plots
Table 2: Correlation between ANN-QBDI, RNPI with SPI
|
Time scale |
Index |
SPI |
|||||
|
Astor |
Bunji |
Chitral |
Gilgit |
Gupis |
Skardu |
||
|
1 |
ANN-QBDI |
0.637 |
0.658 |
0.530 |
0.628 |
0.628 |
0.645 |
|
RNPI |
0.670 |
0.661 |
0.529 |
0.610 |
0.804 |
0.643 |
|
|
3 |
ANN-QBDI |
0.709 |
0.724 |
0.658 |
0.728 |
0.733 |
0.728 |
|
RNPI |
0.732 |
0.728 |
0.667 |
0.691 |
0.823 |
0.739 |
|
|
6 |
ANN-QBDI |
0.743 |
0.752 |
0.716 |
0.779 |
0.781 |
0.762 |
|
RNPI |
0.763 |
0.755 |
0.733 |
0.754 |
0.833 |
0.776 |
|
|
9 |
ANN-QBDI |
0.763 |
0.769 |
0.740 |
0.796 |
0.796 |
0.786 |
|
RNPI |
0.783 |
0.772 |
0.764 |
0.785 |
0.842 |
0.805 |
|
|
12 |
ANN-QBDI |
0.771 |
0.752 |
0.716 |
0.802 |
0.797 |
0.797 |
|
RNPI |
0.788 |
0.755 |
0.733 |
0.799 |
0.855 |
0.814 |
|
|
24 |
ANN-QBDI |
0.816 |
0.828 |
0.775 |
0.855 |
0.811 |
0.850 |
|
RNPI |
0.825 |
0.832 |
0.804 |
0.870 |
0.896 |
0.865 |
|
|
48 |
ANN-QBDI |
0.845 |
0.849 |
0.802 |
0.885 |
0.828 |
0.838 |
|
RNPI |
0.789 |
0.853 |
0.810 |
0.894 |
0.947 |
0.860 |
|
displays the correlations between the RNPI and ANN-QBDI and the data from specific meteorological stations-based SPIs over several significant time intervals. On a one-month time period, the Bunji station has the highest correlation value (0.657504) between ANN QBDI and SPI, while the Chitral station has the lowest correlation value (0.530048). The strongest and lowest RNPI correlations with SPI, therefore, are 0.80402 and 0.52879 for Gupis and Chitral respectively. Similar ranges between the highest and lowest correlation values are discovered for each other time scale (Table 2) and Figure 6. The SPIs of certain weather stations the disparities show that Ann-QBDI is more consistent than RNPI
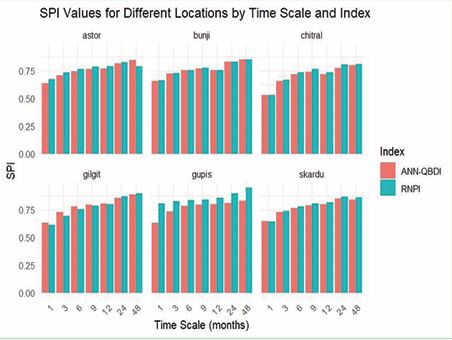
Figure 6 SPI values for different locations by time scale and index
The efficacy of ANN-QBDI in comparison to RNPI is evaluated after the consistency assessment. The RNPI and ANN-QBDI correlation coefficient statistics (mean, standard deviation, and coefficients of variation) are displayed and compared in Table 3. When compared to RNPI, the mean correlation between ANN-QBDI and specific meteorological stations is stronger over a month. It is implied that ANN-QBDI is more homogeneous than RNPI by the finding that the standard deviation of individual meteorological stations is low. Table 3 shows that ANN-QBDI is more consistent than RNPI due to its low correlation coefficient with the SPI of individual meteorological stations. The comprehensive outcomes indicate that ANN-QBDI has a stronger focus on regions than RNPI.
Table 3: Summary Statistics for all Time scales
|
Time scale |
Statistics |
ANN-QBDI |
RNPI |
|
1 |
Mean |
0.621 |
0.6527 |
|
Standard Deviation |
0.046 |
0.090 |
|
|
CV |
7.389 |
13.797 |
|
|
3 |
Mean |
0.713 |
0.730 |
|
Standard Deviation |
0.028 |
0.053 |
|
|
CV |
3.984 |
7.300 |
|
|
6 |
Mean |
0.755 |
0.769 |
|
Standard Deviation |
0.025 |
0.034 |
|
|
CV |
3.264 |
4.467 |
|
|
9 |
Mean |
0.775 |
0.792 |
|
Standard Deviation |
0.022 |
0.028 |
|
|
CV |
2.859 |
3.571 |
|
|
12 |
Mean |
0.772 |
0.791 |
|
Standard Deviation |
0.034 |
0.043 |
|
|
CV |
4.379 |
5.460 |
|
|
24 |
Mean |
0.823 |
0.849 |
|
Standard Deviation |
0.029 |
0.034 |
|
|
CV |
3.561 |
4.023 |
|
|
48 |
Mean |
0.841 |
0.859 |
|
Standard Deviation |
0.027 |
0.057 |
|
|
CV |
3.229 |
6.685 |
To contextualize our results, it is essential to compare them with findings from previous studies. For instance, Vicente-Serrano et al. [9], demonstrated that traditional drought indices like SPI often fail to capture the complexity of drought phenomena, particularly under varying climatic conditions. Our study corroborates this limitation, as SPI alone did not account for the variability introduced by additional climatic factors. In contrast, the ANN QBDI, which incorporates these factors, aligns with the findings of similar studies that advocate for multi-variable approaches in drought assessment.
CONCLUSION
The evaluation of extreme conditions in arid and semi arid regions holds significance in the management of water resources. Drought, among the most costly risks to global environments is particularly concerning in areas characterized by intricate climate patterns. Drought manifests as a spatial-temporal phenomenon occurring when precipitation levels dip below the average for a specified period reaching critically low levels. This study focuses on assessing an enhanced artificial neural network based quality boosted drought index (ANN-QBDI). In order to evaluate the effectiveness of ANN-QBDI, the study focuses on a number of meteorological stations in the northern region of Pakistan. For a comparison analysis, the coefficients of variation (CV) in the relationships between RNPI and ANN-QBDI with particular meteorological stations are examined. The numerical results demonstrate that the ANN-QBDI consistently displays more uniform correlation values across all important time scales when compared to the simpler RNPI. These results suggest that ANN-QBDI more accurately represents the entire region than RNPI. This study shows that ANN-QBDI-based drought monitoring is a practical technique for investigating localized drought characteristics. These results can be used to precisely characterize regional climatology by practitioners of drought management.
DATA AVAILABILITY STATEMENT
All data analyzed during this study is obtained from the website of NASA power Data Access Viewers (1981-2021) and the website link is https://power.larc.nasa.gov/data access-viewer/.
COMPETING INTERESTS
The authors declare that they have no known competing financial interests or personal relationships that could have appeared to influence the work reported in this paper
FUNDING
This research was conducted without any external funding.
AUTHOR CONTRIBUTION STATEMENT
Muhammad methodology Noor-ul-Amin: development, Conceptualization, manuscript writing, and project supervision. Muhammad Laiq: machine learning model implementation Maqsood Ahmad: Data collection, software, analysis, interpretation, manuscript writing.
ETHICAL STATEMENT
All authors have read, understood, and have complied as applicable with the statement on “Ethical responsibilities of Authors” as found in the Instructions for Authors.
REFERENCES
- Aiguo Dai. Drought under global warming: a review. WileyInterdisciplinary Reviews: Climate Change. 2011; 2: 45-65.
- Donald A. Wilhite, Michael H. Glantz. CHAPfER2 UNDERSTANDING THE DROUGHT PHENOMENON: THE ROLE OF DEFINITIONS. 1987.
- Michael Hayes, Mark Svoboda, Nicole Wall, Melissa Widhalm. The Lincoln declaration on drought indices: universal meteorological drought index recommended. Bulletin of the American Meteorological Society. 2011; 92: 485-488.
- Mohammad Reza Alizadeh, Mohammad Reza Nikoo. A fusion-based methodology for meteorological drought estimation using remote sensing data. Remote sensing of environment. 2018; 211: 229-247.
- Muthuvel D, Sivakumar B, Mahesha A. Future global concurrent droughts and their effects on maize yield. Sci Total Environ. 2023; 855: 158860.
- Xinglong Gong, Shuping Du, Fengyu Li, Yibo Ding. Study of mesoscale NDVI prediction models in arid and semiarid regions of China under changing environments. Ecological Indicators. 2021; 131: 108198.
- Donald A. Wilhite. Drought as a natural hazard: Concepts anddefinitions. 2000.
- Xiangyi Li, Yue Li, Anping Chen, Mengdi Gao, Ingrid J. Slette, Shilong Piao. The impact of the 2009/2010 drought on vegetation growth and terrestrial carbon balance in Southwest China. Agricultural and Forest Meteorology. 2019; 269: 239-248.
- Sergio M. Vicente-Serrano, Santiago Beguería, Juan I. López- Moreno. A multiscalar drought index sensitive to global warming: the standardized precipitation evapotranspiration index. J Climate. 2010; 23: 1696-1718.
- Milly P C D, Dunne K A. Potential evapotranspiration and continental drying. Nature Climate Change. 2016; 6: 946-949.
- Mohammed A Alshahrani, Muhammad Laiq, Muhammad Noor-ul- Amin, Uzma Yasmeen, Muhammad Nabi. A support vector machine based drought index for regional drought analysis. Scientific Reports. 2024; 14: 9849.
- Warren S McCulloch, Walter Pitts. A logical calculus of the ideas immanent in nervous activity. The bulletin of mathematical biophysics. 1943; 5: 115-133.
- Rumerhart DE. Learning internal representation by errorpropagation. Parallel distributed processing. 1986; 1: 318-362.
- Luk KC, Ball JE, Sharma A. A study of optimal model lag and spatial inputs to artificial neural network for rainfall forecasting. J Hydrology. 2000; 227: 56-65.
- Dawson CW, Abrahart RJ, Shamseldin AY, Wilby RL. Flood estimation at ungauged sites using artificial neural networks. J Hydrology. 2006; 319: 391-409.
- Holger R Maier, Graeme C Dandy. Neural networks for the prediction and forecasting of water resources variables: a review of modelling issues and applications. Environmental Modelling Software. 2000; 15: 101-124.
- Noor-Ul-Amin M, Sarwar MA, Emam W, Tashkandy Y, Yasmeen U, NabiM. Adaptive multivariate dispersion control chart with application tobimetal thermostat data. Sci Rep. 2023; 13: 18137.
- Muhammad Noor-ul-Amin, Muhammad Atif Sarwar. Design of anew adaptive MEWMA chart to monitor the mean. J StatisticalComputation and Simulation. 2023; 93: 1-18.
- Farman Ali, Bing-Zhao Li, Zulfiqar Ali. A new weighting scheme for diminishing the effect of extreme values in regional drought analysis. Water Resources Management. 2022; 36: 4099-4114.
- Milton Abramowitz, Irene A. Stegun. Handbook of mathematical functions with formulas, graphs, and mathematical tables. US Government printing office. 1948; 55.
- McKee T B, Doesken N J, Kleist J. Drought monitoring with multiple time scales. In Proceedings of 9th Conference on Applied Climatology. Boston, 1995; 233-236.


