Lord’s Paradox: A Commentary on Causal Inference
- 1. Department of Psychological and Brain Sciences, Indiana University, United States
Abstract
In 1967 Frederic Lord published a two page paper on weight changes over time by two groups. He asked what inferences should be drawn from the data shown. A scientist would surely conclude that the individuals in both groups were fluctuating in weight but not gaining or losing, as Lord himself concluded, yet Lord showed that an analysis of covariance would lead to a conclusion that the initially heavier group was gaining more than the initially lighter group. In the years since 1967 causal analyses by several respected statisticians and causal theorists questioned the inference of no average change, concluding that one cannot reach a valid conclusion, or concluding that the correct conclusion is more weight gain for the initially heavier group. These conclusions are based on abstract theoretical theories of the correct way to draw causal inference, but none of these authors have provided a simple, plausible, coherent model that would generate the data Lord displayed. This commentary discusses Lord’s paradox and causal inference. The author believe it provides a demonstration that drawing inference on the basis of abstract theory and principles, without such a generating model, can produce serious inferential error, even when the abstract theory seems well justified.
CITATION
Shiffrin RM (2020) Lord’s Paradox: A Commentary on Causal Inference. Ann Biom Biostat 5(1): 1034.
INTRODUCTION
In 2015 I helped organize a colloquium at the National Academy of Sciences titled “Drawing causal inference from Big Data” and helped edit the special issue of PNAS featuring papers by speakers at that colloquium. My take-home message was the extreme difficulty of extracting meaningful inferences concerning causality from large data bases, not only because such data exhibit untold numbers of correlations representing untold numbers of interacting factors, but also because causality is not a clearly defined concept: In the real world pretty much everything has some causal influence on everything else, to various degrees, through untold numbers of intermediate paths.
This commentary and that submitted article are meant to illustrate the difficulty in drawing causal inference even when the data is very small, and extremely simple. I try to make the case that the best we can do in drawing causal inference is production of a mathematical or computer simulation model that generates the data, even though all models are incomplete and approximations to anything resembling reality. I also argue that abstract general theories of the way to draw causal inference, even when based on what seem to be firm foundations, can lead to seriously wrong conclusions, if not coupled with a simple, coherent and plausible generating model.
The literature on Lord’s paradox makes a strong argument for these conclusions. In 1967 Lord published a two page article Lord [1] posing some simple hypothetical data about weight gain or lack thereof by two groups. Pretty much any scientist would draw a simple conclusion from the data shown: Individuals in both groups were fluctuating randomly about some personal mean weight, but no individual and in either group was systematically gaining or losing weight. Yet from the 1970s to the present day well known statisticians and causal theorists have been writing about the situation that Lord described, and some have reached quite different conclusions.
Lord’s graphical description is shown in Figure 1.
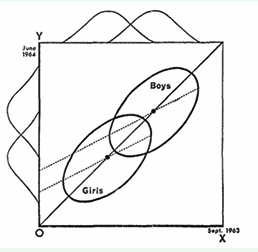
Figure 1: Hypothetical Scatterplots Showing initial and final weight for boys and for girls.
The situation is as follows: In Sept. 1963 a group of boys and a group of girls are weighed, with results shown on the horizontal axis. They are weighed again in June 1964, with results shown on the vertical axis. The ellipses indicate the joint distribution of the two groups. These are symmetrical about the diagonal that indicates equal weights at the two dates. Statistician 1 notes that the group means are on the diagonal, and that the joint distributions are symmetrical about the diagonal (the differences between initial and final weight is Gaussian with mean zero for both groups), and concludes that members of both groups are fluctuating in weight about a stable mean that does not change over time. Statistician 2 carries out an analysis of covariance (ANCOVA) obtaining the regression lines shown in the figure. Noting the different intercepts, statistician 2 concludes that men are gaining more weight than women (somehow adjusting for the initial weight differences of girls and boys).
I think most scientists, myself included, would find it puzzling that there is any controversy about the interpretation of the data shown by Lord, and would conclude that we are seeing nothing but random weight fluctuation. In fact it is clear that Lord did not mean this to be a serious ‘paradox’ but rather gave this example to show the inappropriateness of applying an ANCOVA without good reason [2]. Yet Holland and Rubin [3-7] and Pearl and Mackensie have found possible, plausible, or likely the conclusion that the boys and girls are both gaining weight with the boys gaining more than the girls. E.g. Pearl (2016) states: “..no assumption whatsoever would justify Statistician 1’s conclusion”. Senn (2018) states: “I consider that the first statistician is unambiguously wrong but that the second statistician is not unambiguously right.” The debates continue to the present [8,9]
I believe most scientists would find far superior the first statistician’s conclusion because there exists a simple, plausible and coherent model that would generate the observed data. To see this easily, consider a scenario in which no individual in either group gains or loses any weight at all between the two weighings, but that each weighing occurred on a scale that was imperfect: It produced a weight that was a sample from a Gaussian distribution with a mean equal to the actual weight, but with a considerable variance. That would produce the data Lord exhibited in Figure 1. That would also be true if instead the scales were accurate but the weight inaccurate. I.e. assume the two samples of weight for each individual are far enough apart in time that each is an independent sample from a Gaussian distribution with a mean at that individual’s stable long run weight, but with a considerable variance. According to this model the gains and losses for every individual fluctuate around a fixed value for each, so no gain or loss is seen on average.
Having supported this model, I would be remiss in failing to note that it also has some shortcomings (if one takes the data seriously-of course the data were invented by Lord to make a point). It is suspicious that the average weight gain for each group lies exactly on the main diagonal; the variance of the weight gains in each group seem suspiciously large compared with the variation within each group; weight probably ought to operate on a ratio scale, so the variances should have been larger for larger weights. Nonetheless, a scientist would conclude that the first statistician’s conclusion, and the proposed model, is far the best available. That conclusion is based on the difficulty of coming up with a decent alternative model. I have looked hard for such a model and have not been able to come up with one. The closest I have come to such an alternative model is one that has two opposing factors, one causing weight gain for both groups, more for the males, and the other causing the opposite, so that the factors cancel exactly. No scientist would consider such a model seriously. None of the writers about Lord’s paradox have published even one simple, plausible, and coherent model justifying the conclusion of statistician 2.
One statistic used to justify the second statistician’s conclusion is misleading: It is the case that a male of equal weight to a female will on average show a greater weight gain, as is clear from inspection of Figure 1. However, one would be comparing a heavier female to a lighter male, so as Galton [10,11] would have concluded and as Cox and McCullagh [12] affirmed, the result is a matter of regression to the mean: A second noisy measurement of the female would be closer to the female mean, and hence lighter, and a second noisy measurement of the male would be closer to the male mean and hence heavier.
Why then do various highly respected researchers and theorists consider other inferences as possible, or even to be preferred? Rather than presenting a model that could generate the data, they have used somewhat abstract models specifying the way that causality ought to be inferred in an ideal and hopefully general fashion, one applicable to all situations in which data are generated. I will not try to describe their methods, theories, and justifications - that would take a book rather than a brief commentary- but will assume for the purposes of this commentary that they all have good theoretical justification for their methods of inferring causality. However what seem to be universally correct assumptions in the abstract typically fail when dealing with the near infinite and messy complexities of the world we inhabit. This has been seen in numerous historical examples, such as the attempts to generate normative economic decision theory based on expected utility or subjective expected utility.
Using the methods they favor, what do those theorists conclude? Holland and Rubin [3] focus mainly on a version of the situation in which the two groups are not men and women but rather two groups of men eating in two different dining halls. In the case of gender they argue this variable cannot be manipulated, and in the case of dining halls, the choice of hall was not manipulated. Hence they argue that in both cases the conclusions from the data depend on untested or untestable assumptions and are therefore not suitable for conclusions drawn from causal modeling. Is this reasonable? Science always leaves many open ends, and that fact would not prevent a scientist from preferring a simple, plausible, and coherent model capable of generating the data. Wainer and Brown [4] consider the same situation, use the same general framework for applying causal modeling, but reach a slightly different conclusion that both statisticians are correct, but on the basis of different assumptions they are making. They caution that care is needed when trying to draw causal inferences, certainly true, but once again, they reach somewhat different conclusions than the scientist who would strongly favor statistician 1. Pearl [6] also carries out a formal causal analysis of the same situations. For the girls and boys scenario he points out that the two statisticians are estimating direct and indirect causes, and that the second statistician. “Rightly concluded that there is significant gender difference, as seen through the displaced ellipses.” When considering the scenario with two dining halls Pearl again reaches a strong conclusion: “....no assumption whatsoever would justify Statistician 1 conclusion.” Senn (2018) echoes the causal arguments of these other writers and confirms their conclusions with a formal statistical analysis based on the block structure of the ‘study’. The various conclusions reached by these theorists are based on abstract causal analyses. None have proposed a simple, plausible and coherent model incorporating the conclusions of statistician 2 that could generate the data in Figure 1.
There are lessons I draw from this example and its discussion. First, there are different means by which one might try to draw causal inferences from data, some abstract and theoretical and some rooted in a model capable of generating (most of and suitably well) the data patterns that have been observed: Using the first without the second can produce highly suspect conclusions. Second, the universe is infinitely complex and no model can capture it; in fact all models for any setting are at best approximate; the best we can do when modeling the data from any situation is finding a simple, plausible, and coherent model that captures the major processes operating in that situation approximately well. Such a model provides a decent guess concerning the primary causal factors that are operating to produce the data observed causal inference.


