Regression Varying Covariate Effects on the Survival Time of Heart Failure Patients in Amhara Region, Ethiopia
- 1. Department of Statistics, Department of Statistics, Injibara University, Ethiopia
Abstract
Background: Time to death predictors of heart failure not yet clear and the prevalence became increases time to time in the world. Even though there was an improvement in management of heart failure patients, still it needs more attention, especially in developing countries, particularly in the study area. As a result, different models had been conducted before to identify the possible determinants of heart failure, even though none of them tried to see the covariates change over time. Since models have a predictive power, having an advantage of allowing the effect of covariates change over time accelerated failure time models were used.
Method: A retrospective cohort study was conducted on patients who were on follow up at Wollo governmental Hospitals from January 1, 2010 to December 30, 2016. A random sample of 487 patients was selected using systematic random sampling from their medical registration book. Accelerated failure time models were used to identify the accelerating factors for death.
Result: Weibull accelerated failure time model explained the covariate effect well among other accelerated failure time models. Consequently, the accelerating factors related to death overtime were age(TR=0.962), had poor diet(TR=0.582), smoker(TR=0.774), diabetes(TR=0.49), hypertension (TR=0.079), stroke (TR=0.799), tuberculosis (TR=0.103) as a co-exist were significantly decelerating or shortening the survival time.
Conclusion: Special attention is required for patients with Congestive heart failure disease, tuberculosis, pneumonia, diabetes, hypertension, stroke, patients who smoke, patients who had poor diet and aged. In addition, frequent monitoring and follow up of Patients better to adopt.
Keywords
Congestive Heart Failure; Retrospective cohort study; AFT model; Mortality
CITATION
Dessie H (2020) Regression Varying Covariate Effects on the Survival Time of Heart Failure Patients in Amhara Region, Ethiopia. Ann Biom Biostat 5(1): 1035.
ABBREVIATIONS
TATA: Statistical Data Analysis; TR: Time Ratio; AIC: Akakian Information Criteria; BIC: Bayesian Information Criteria; HF: Heart Failure; CKD: Coronary Kidney Disease; CAD: Coronary Artery Disease; HTN: Hypertension; TB: Tuberculosis; HIV: Human Immune Virus; Sbp: Systolic Blood Pressure; Dm: Diabetes Mellitus; Nut: Nutritional status
BACKGROUND
Heart failure could be a major clinical challenge worldwide, reaching an epidemic level within the developed world with no notable cure at this time [1]. Approximately 26 million individuals worldwide lived with heart failure, and nearly 1 million new cases are diagnosed annually, creating it the foremost quickly growing cardiovascular disorder [1]. In economically developed countries, studies indicated that up to one person in five is predicted to develop coronary heart failure at some point in their life [2] and it affects 1% to 3% of the overall population [3,4].
The prevalence of heart failure has been shown to follow an exponential pattern, that rises with age [5] and affects 6-10% of individuals over age 65 [4]. Compared to studies from different parts of the planet, heart failure in Africa tends to occur at a much younger age and it is not a disease of the elderly in sub Saharan Africa [2] and it accounts prevalence of 76% major upset contributor in sub Saharan Africa [6]. However, still the burden of heart failure, as cardiovascular complication remains undiscovered mostly in Africa [7,8]. The long-term prognosis related to heart failure effects study is additionally poor [8-10].
In Ethiopia, Congestive heart failure is found to be the third cause of death following hypertension and stroke among the cardiovascular disease [11] and it caused 12.5% of deaths among all age groups [1]. Actually, there are limited studies in Ethiopia especially, in the study area, which made the situation more complicated. According to Amhara governmental hospitals 2018 report showed that heart failure is one of top five killer diseases in the study area. Despite enhancements in care over the past twenty years, the care attentions of patients remains weak and the mortality rate also high among several of the common malignancies [2,12]. One year mortality and 5-year mortality population-based studies in developed countries showed that approximately 20% and 50-65% were died with heart failure respectively [12]. Across the globe, 17 to 45% of patients admitted to hospital with heart failure were died at intervals one year of admission while the majority was died within 5 years of admission. Besides survival rates patients in follow up was treated better in clinics, which usually had less severe symptoms than those treated in hospital2. Indeed, about 2 to 17% of patients admitted to hospital with heart failure was died [13].
Even though, different models had been used before, on the survival of heart failure patients, all of these studies were not tried to see the covariates change over time. Since models have a power to identify the predictors. Thus, the limited work on the area and the appropriateness of the model used with the change in the effects of covariates over time in relation to the survival time of the patient accelerated failure time models were fitted, which allowed all regression coefficients to vary with time [14,15].
The effect size for the accelerated failure time model is measured using the Time Ratio (TR) which is a ratio of the survival time of an individual with an exposure to the survival time of an individual without the exposure for a given survival probability, where TR less than one indicates that shorten the survival time of patients and a TR of one is the covariate has no effect on the survival time of heart failure patients, while time ratio of above one accelerate the survival time.
Suppose, is a random variable representing the survival time for the,
patients. Then representation of the relationship between covariate values and survival time in the accelerated failure time model is the linear relationship between log time and the covariate values expressed as
, Where
vector of regression coefficients,
coefficients,
is scale parameter and
is a random variable used to model the deviation of values of
from the linear part of the model and its error distribution(Weibull, log-normal, and log-logistic) assumed to have a particular probability distribution supposed to be followed by the survival time under study. The effect of treatments and covariates is assumed to act additively on the log time scale and therefore, multiplicatively on the time scale itself. Furthermore, Parametric survival models possess some advantages such as utilization of full likelihood to estimate the parameters, providing estimates in terms of survival instead of hazards of the outcome. As a result, Weibull AFT survival models were provide a more suitable description of the data.
MATERIALS AND METHODS
Study area
This study carried at selected Amhara governmental hospitals, Ethiopia. These hospitals serves as a teaching and referral hospitals in wollo, Amhara region owned by government with a catchment of 7.5 million people [16]. The study conducted from January 1, 2010 to December 30, 2016G.C.
Study population
All heart failure patients on treatment from January 2012 to December 2016 at Wollo governmental hospitals.
Study design and Setting
Retrospective cohort study conducted on 487 heart failure patients by reviewing their medical records of who received treatment at Wollo governmental hospitals, from January 1/2012 to December 30/2016. All heart failure patients under follow up with these hospitals during the study period were included. Patients who have no complete history during document review were excluded. Sample size and sampling procedures Random samples of 487 patients were selected using Systematic random sampling technique. In calculating the sample size,12.5% prevalence of death [1], 95% CI and 3% margin of error were taken into account. Here each patient has a record with a distinctive identification number.
Data collection procedures
In this study, only secondary data was used. Data extraction check-list was designed and used to extract data. The classification of the aetiology of heart failure was adopted from the different literatures. As such, beginning of follow-up was defined as enrolment in the protocol. Last follow-up was evaluated in Dec.30, 2016. From the patient’s charts clinical information such as the length of treatment time from outward entry to event or censoring and the event of interest is death up to the defined study period and a predictor variables information such as a baseline age, sex, residence, marital status, educational status, religion, weight, baseline heart rate, systolic blood pressure, nutritional statues, smoking, alcoholism, and Presence of diabetes, hypertension, stroke, coronary artery disease, tuberculosis, HIV, Pneumonia and coronary kidney disease as a coexist were extracted from the patient card. The data were extracted by professional health care service providers after receiving adequate orientation about the variables to be included in the study.
Data quality controls
Supervisors and Data collectors were trained how they collect data from chart accordingly for 2 days. Also they were practiced how they review documents before the data collection. Then, the supervisors and investigators were closely followed the data collection process and ensure completeness and consistency of the collected information daily until data collection ends. During document review, any personal identifiers were not included. After that necessary amendments were made on the final data collection sheet.
Data structure, Compilation and analysis strategy
Secondary data were entered and analysed using STATA version 12 software. Accelerated failure time models with different error distribution were fitted, to identify factors associated with the survival time of outpatients with heart failure that elongates or shorten the event actually the event is death. The parameter was estimated by using fully maximum likelihood Estimation method. Since the baseline hazard is assumed to be of a parametric form, and the likelihood ratio test was used to assess the significance of the coefficients. The adequacy of the model was checked by using likelihood ratio test and goodness-of-fit test.
Model description, assumption and adequacy
In model selection procedure, all predictors in the model were considered, taking into account each product terms of predictor variables to be fitted one at a time. This was important to assess the interaction effects of predictors on the variable of interest. Accelerated failure time models with three different distributions, namely, Weibull, Log Logistic and Exponential were fitted.
Statistical method using Survival Analysis
Survivor Function and Hazard Function: The survival and hazard functions are key concepts in survival analysis for describing the distribution of survival times. The survivor function is the probability that the survival time of a randomly selected heart failure patients is greater than some specified time, t or the probability of an individual being event-free beyond time,
. In order to find the survival function a subject, suppose T be random variable associated with the survival times,
be the observed value of the random variable T and
be the underlying probability density function of the survival time
.The cumulative distribution function,
represents the probability that an individual selected at random will have a survival time less than or equal to the specified value,
. Thus, the cumulative distribution function and the survivor function are given by:
The relationship between and
is given as
Hazard function can be used to express the risk or hazard of death of a patient with a case at time t. Furthermore, it will be obtained from the probability that an individual dies in an infinite, simply small interval
given that the individual has survived up to time,
.
,Actually, there is a clearly defined relationship between
and
which is given by the formula
where the cumulative hazard function, which can be obtained from
The probability density function of can be written as
this study was focus on time to event (time to death by CHF) along with covariates which have effect the longevity of the survival time of the patient over time. Given understanding of these effects of covariates helps to set better management solution for heart failure disease. Therefore, the appropriate method for this particular study is accelerated failure time model.
Accelerated Failure Time Model
AFT models work to measure the effect of covariate to “accelerate” or to “decelerate” survival time meaning the effect of covariate is multiplicative on time scale it is indicating how a change in covariate values changes the time scale from the baseline time scale. Under AFT models the survival function of the th i individual with covariates 1 2 , ,..., p x x x at time, t is the same as the survival function of an individual with a baseline survival function at a time mathematically, it can be expressed with its corresponding hazard function as:
where is a vector of regression coefficients
and
are the baseline survival and hazard functions respectively. The effect size for the AFT model is measured using the Time Ratio (TR) which is a ratio of the survival time of an individual with an exposure to the survival time of an individual without the exposure for a given survival probability. Suppose,
is a random variable representing the survival time for the,
individual. Then representation of the relationship between covariate values and survival time in the AFT model is the linear relationship between log time and the covariate values expressed as follows:
where is intercept,
parameter and
is a random variable used to model the deviation of values of,
from the linear part of the model.
is random error distribution assumed to have a particular probability distribution supposed to be followed by the survival time under study.
Under the AFT formulation, the effect of treatments and covariates is assumed to act additively on the log time scale and therefore multiplicatively on the time scale itself. Three commonly adopted parametric AFT models are the Weibull, log-normal, and log-logistic in terms of the distribution of survival time. These models are fitted using the maximum likelihood estimation method. The likelihood function of n observed survival times, for the log-linear form of the AFT model is given by:
where and
are the density and survival functions for the th i individual at time i t and i δis the event indicator for the observation and has value zero for censored and one for uncensored individuals. If
and
are probability density function and survival function respectively of the random variable i εin such a way that
Comparison of AFT Models
Different models can be compared on the basis of the variables selected and their coefficients in each model, goodness of fit tests such as 2 R type statistic and Cox Snell residuals plot. The appropriate model was identified through the value of AIC and BIC whose value the smallest is the better the model fit.
Comparison of AFT Model Estimate
If the models being compared have a similar set of covariates that have entered in the respective final models, it can be interpreted as all models are equally good or bad as far as the identification of important covariates associated with the outcome. However, it is difficult to interpret either way if the selected variables in the models being compared are different, as there is no way of knowing the truth (Khanal, 2009). The precision of the regression coefficients is another criterion that can be used to compare different models. The smaller the standard error, the more precise an estimate is expected to be. A model with more precise coefficients can be considered as a more precise model.
Comparison of AFT Model by Type Statistic
type statistic is a relative measure for the improvement in log-likelihood value from the model without any covariate to the final model. Hence two or more relative measures can be compared irrespective of the type of log-likelihood estimated. The model with more
type is indicative of a better model than a model with a low,
.
Comparison Based on Cox-Snell Residuals Plots
The Cox-Snell residuals plot was explained. Broadly, all models require the plot to be a straight line, passing through the origin to qualify for a good fit. So the plots under each model was visually assessed as to which one of them is close to the requirements of a good fit. Plot of the Cox-Snell residuals was applied to test the overall fit of the model. In this method Cox-Snell residuals were plot against the cumulative hazard of Cox-Snell residuals. If we have a well-fitting Cox model because of the reduced effective sample size caused by prior failures and censoring. The type statistic was also calculated as follows:
Which conveys variation in the partial log-likelihood is explained by Cox PH model and AFT Model.
Selection of covariates
Hosmer and Lemeshow and Collette recommended that, at the first the procedure in variable selection step including all variables that will significant in the univariable analysis at 25 percent level and also any other variables which are presumed to be clinically important to fit the initial multivariable model. Also after the preminary main affect models at 5% level of significance. Finally we included the interaction effect terms in the multivariable preminary main effect models and we checked the importance of each interaction terms at 5% level of significance and considered as a final model.
Overall Goodness of Fit
To assess the overall goodness of fit of a Cox proportional hazards regression model (Aaronson , 1997) suggests plotting the cumulative observed versus the cumulative expected number of events for subjects with observed (not censored) survival times. If the model fit is adequate, then the points should follow a 45-degree line beginning at the origin. Similarly for a AFT model.
RESEARCH ETHICS APPROVAL
Ethics approval certificate had been obtained from both Woldia University, Ethiopia (Ref and medical directors of Wollo hospital
.
RESULTS
The medical cards of 487 patients have been reviewed of which 42.1% were death cases, while 57.9% were censored. A death proportion for females were (38.19%), while (47.74%) for males. 91.23% of sampled smoker patients were died, while 35.58%were non-smokers. Over 76.19% of the sampled heart failure patients had HIV as comorbidity was died. The Five Years study result showed that the median survival time of sampled rural heart failure patients were 16 months, while nearly 3 years for Urban summarized in Table1.
|
Stroke Negative Positive |
36.1 13 |
152 53 |
277 5 |
35.43 91.38 |
|
Tuberculosis Negative Positive |
36.2 13 |
116 89 |
272 10 |
29.90 89.90 |
|
HIV Negative Positive |
35 17.4 |
147 64 |
262 20 |
36.48 76.19 |
|
Note: Drunker= more than 14 ounce per week, non-drunker below or equal to 14 ounce Abbreviations: BMI: Body mass Index; CAD: Coronary Artery Disease; CKD: Coronary Kidney Disease; DM: Diabetes mellitus; HTN: Hyperten- sion; HIV: Human Immune syndrome |
||||
The mean baseline age of sampled heart failure patients were 50 years (Table 2).
|
Table 2: Numeric covariates characteristics of sampled patients (n=487). |
||||
|
Variable |
Mini- mum |
Maxi- mum |
Mean |
Std. Devia- tion |
|
Base line age of pa- tients |
16 |
86 |
49.81 |
18.984 |
|
Systolic blood pres- sure |
80 |
180 |
116.12 |
19.490 |
|
Heart rate of the pa- tients |
23 |
120 |
82.57 |
13.957 |
The Akakian information criteria and Bayesian information criteria results showed that Weibull yields better explains the covariate effect well among other parametric accelerated failure time models such as exponential and log-logistic summarized in Table 3.
|
Table 3: Model Comparison with different parametric distributions for heart failure data using AIC&BIC. |
||
|
Model |
AIC |
BIC |
|
Exponential AFT |
673.893 |
666.035 |
|
Weibull AFT |
532.187* |
628.517* |
|
Log logistic AFT |
542.722 |
639.052 |
|
* represents the better model that explain the effect of covariates on the survival time of patients AFT: Accelerated Failure Time; AFT: Akakian Information criteria; BIC: Bayesian information criteria |
||
Moreover, the overall goodness of models were assessed through Cox Snell residual, which were sketched for each distributions, where it resembles good in fit since the lines are approximately straight line presented in Figures 1-3.
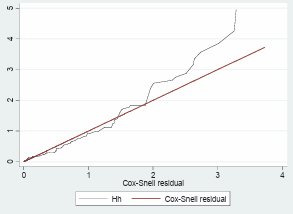
Figure 1: Cox Snell residual plots for Exponential AFT model plot.
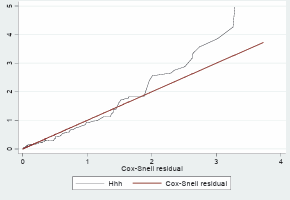
Figure 2: Cox Snell residual plots for log logistic AFT model plot..
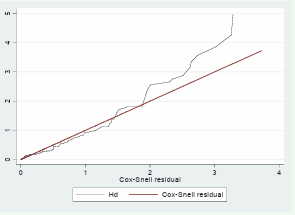
Figure 3: Cox Snell residual plots for Weibull AFT model plot.
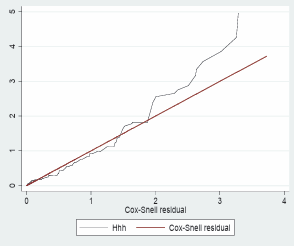
Figure 4: Cox Snell residual plot.
Weibull AFT model result showed that age, residence, nutritional statues, smoking, alcoholism, diabetes, hypertension, stroke, coronary artery disease, tuberculosis as a coexist and the interaction effects of being aged and had tuberculosis , coronary artery disease and diabetes with hypertension have regression varying effect over time and its effect accelerates time to mortality.
As the age of the patient increases in a year, the survival time of the Patients more likely shorter than Younger (TR=0.962, 95% CI:(0.954,0.969) and p-value=0.000). Urban patients had longer survival time (TR=1.237, 95% CI:(1.035,1.478) and p-value=0.019) than rural patients and Smoker patients had shorter survival time(TR=0.772, 95% CI:(0.646,0.927) and p-value=0.005) than non smokers. Indeed, the coexistent of Diabetes and heart failure had to decrease the survival time of patients (TR=0.49, 95% CI:(0.367,0.653) and p-value=0.000) than absence of diabetes and the interaction effect of being aged and time had worse survival rate (TR=0.001, 95% CI:(0.001,0.002) and p-value=0.000 ). The model explained by 69.58% by the covariates summarized in Table 4.
|
Table 4: Time ratio of the parametric estimation and standard error for heart failure data using weibull accelerated failure time model. |
||||||
|
Effects |
TR |
S.E |
Z |
P_value |
95% CI |
|
|
Lower |
Upper |
|||||
|
Sex(Ref.=Male) |
||||||
|
Female |
1.137 |
0.111 |
1.31 |
0.190 |
0.938 |
1.377 |
|
Age |
0.962 |
0.004 |
-9.71 |
0.000** |
0.954 |
0.969 |
|
Residence(Ref.=Rural) |
||||||
|
Urban |
1.237 |
0.112 |
2.34 |
0.019* |
1.035 |
1.478 |
|
Nutritional Status (Ref.=Good) |
||||||
|
Poor |
0.582 |
0.073 |
-4.33 |
0.000** |
0.456 |
0.744 |
|
Smoking status (Ref.=No) |
||||||
|
Yes |
0.774 |
0.071 |
-2.78 |
0.005** |
0.646 |
0.927 |
|
Alcoholism (Ref.=drunker) |
||||||
|
Non Drunker |
1.394 |
0.179 |
2.59 |
0.010** |
1.084 |
1.793 |
|
Diabetes mellitus(Ref.=Negative) |
||||||
|
Positive |
0.490 |
0.072 |
-4.85 |
0.000** |
0.367 |
0.653 |
|
Baseline Heart rate |
0.999 |
0.003 |
-0.33 |
0.745 |
0.992 |
1.006 |
|
SBP |
0.999 |
0.002 |
-0.37 |
0.709 |
0.995 |
1.003 |
|
Coronary Artery Disease(Ref.=Negative) |
||||||
|
Positive |
0.276 |
0.141 |
-2.52 |
0.012* |
0.101 |
0.752 |
|
Coronary kidney disease ( Ref.=Negative) |
||||||
|
Positive |
0.81 |
0.095 |
-1.79 |
0.074 |
0.64 |
1.02 |
|
HIV (Ref.=Negative) |
||||||
|
Positive |
1.014 |
0.101 |
0.14 |
0.891 |
0.834 |
1.233 |
|
HTN (Ref.=Negative) |
||||||
|
Positive |
0.789 |
0.079 |
-2.35 |
0.019* |
0.648 |
0.962 |
|
Stoke(Ref.=Negative) |
||||||
|
Positive |
0.799 |
0.073 |
-2.45 |
0.014 * |
0.668 |
0.956 |
|
Pneumonia (Ref.=Negative) |
||||||
|
Positive |
1.250 |
0.144 |
1.95 |
0.052 |
0.98 |
1.566 |
|
Tuberculosis (Ref.=Negative) |
||||||
|
Yes |
0.103 |
0.036 |
-6.52 |
0.000** |
0.052 |
0.204 |
|
Tb*Age(Ref.=Negative) |
||||||
|
Positive*Age |
1.021 |
0.0055 |
3.83 |
0.000** |
1.010 |
1.032 |
|
CAD*Age(Ref.=Negative) |
||||||
|
Positive*Age |
1.018 |
0.009 |
2.05 |
0.041* |
1.001 |
1.036 |
|
Nut(Ref.=Negative)*Tb(Ref.=Negative) |
||||||
|
Positive |
2.05 |
0.365 |
4.04 |
0.000** |
1.448 |
2.908 |
|
Dm (Ref.=Negative)*HTN(Ref.=Negative) |
||||||
|
Positive |
2.18 |
0.45 |
3.78 |
0.000** |
1.455 |
3.268 |
|
Time*Age |
0.001 |
.00007 |
-6.49 |
0.000** |
0.001 |
0.002 |
|
Constant term |
125.078 |
43.931 |
13.75 |
0.000** |
62.836 |
248.97 |
|
/ln_p |
0.824 |
0.06 |
13.8 |
0.000** |
0.707 |
0.941 |
|
P |
2.279 |
0.136 |
|
|
2.028 |
2.562 |
|
1/p |
0.439 |
0.026 |
|
|
0.390 |
0.493 |
|
AIC |
532.1867 |
|||||
|
BIC |
628.5167 |
|||||
|
Note :*( P-value <0.05) and ** (P-value<0.01), Log likelihood= -243.09333, LR chi2 (21) = 478.38, Prob > chi2 = 0.000. |
||||||
DISCUSSION
The total number of patients covered in the present study was 487 of which 42.1% were death cases, while 57.9% were censored and 288 were female and 199 were males. Since accelerated failure time models allow us all regression coefficients to vary with time, however, the effect of some of the covariates may change with time while others not [14] were fitted. Models were compared with akakian and Bayesian information criteria with the minimum was the better model. Thus, among different accelerated failure time models, Weibull accelerated failure time model yields better explains the covariate effect with time.
Therefore, based on the weibull accelerated failure time model results showed that age, residence, nutrition, smoking, alcoholism, diabetes, hypertension, stroke, coronary artery disease, tuberculosis as a coexist and the interaction effects of being aged and had tuberculosis, coronary artery disease and diabetes with hypertension were found possible source of driving force of mortality. But sex, religion, educational status, baseline systolic blood pressure, heart rate and presence of coronary kidney disease, HIV/AIDs, and pneumonia as a coexist were not accelerating mortality through time.
Age is an important demographic variable that affects the patients survival time. As the age of the patient increases in a year, more likely the Patients survival time decelerating by 0.962. This finding is confirmed by most of previous studies [1-5] and those studies sugest that age has a significant association with the patients survival time. Hence, the chance of being treatend with ACF- inhibitor become decreases with increases of age as a result, older patients more likeliy to die than younger patients. However,this result also cotradicts with the findings of other studies [15], in this study the weibull accelerated failure time model as compared to the previous studies might have contributed for the driving force of mortality with significant probability value of 0.000.
Even though, there is no study on the role of residence in connection with survival time these Weibull Accelerated failure time model result showed the presence of associations. Urban patients had longer survival time than rural patients. Reasons for the difference might include that rural patients likely to come to hospital after they were seriously ill as a result the disease became complex, a situation that was disappointing, forcing them to lose hope and eventually ignore treatments. In addition, rural patients might not have regular access to check-up or heart failure diagnosis.
Nutrition is an important factor for accelerating the survival time of patients. This study result showed that Patients who had poor diet more likely to have shorter survival time than who had good diet and whose survival time decelerated by 0.582. This result confirmed with a study on nutrition using Cox Proportional hazards model by10 suggests that heart failure patients had poor diet was fastening mortality. This indicates intake of good food prolong the life of heart failure patients.
For this study smoking also had an association with survival time of heart failure patients. Smoker patients had shorter survival time than non-smokers. As patients being smoker, the hazard of death were accelerated by 0.772 as compared to non-smokers. This result contradicts with a study [17], hence, in this study weibull accelerated failure time model might explain the cousations well as compared to the previous studies.
Alcohol is another important factor for accelerating the survival time of patients. Non drunker patients had 0.394 times higher survival time than drunker patients. Being non drunker This result also confirmed with a study [18,19] suggests that excessive drinking lead to alcoholic cardiomyopathy and light-to moderate drinking may confer some cardiovascular benefits. Hence, light to moderate alcohol drinking might have prolong the survival of patients with heart failure at a p value of 0.01.
The presence of other disease as a coexist were worsen the survival rate of heart failure patients
Presence of diabetes was decreasing the survival time of patients than diabetes negative. This result confirmed a study with [6], which suggests that patients had hypertension and diabetes as a coexist substantially added the complexity of heart failure care, as a result patients had short survival time.
Similarly, Patients had coronary artery disease as a co-exist had shorter survival time than coronary artery disease negative. This study also confirmed with the previous study [9,20] suggests that the complication of heart failure was complex when patients had coronary artery disease as a coexist. Hence, patients with heart failure had coronary artery disease as a coexistent had a worse survival rate.
Likewise Patients with Stroke as a coexist have shorter survival time than negative patients. This study also consistent with [6]. Hence, patients with heart failure have stroke as a coexistent have a worse survival rate and complex the burden.
Tuberculosis is also another important clinical variable which decelerates the survival time of patients. The result of this study indicated that Patients with tuberculosis as a coexist had shorter survival rate than tuberculosis negative patients. This study consistent with the previous studies on the complications of heart failure complexity as the number of coexistence disease presence [6]. Hence, patients with heart failure have tuberculosis as a coexistent have a worse survival rate
Interaction effects between age and visiting time had an effect of the survival time of patients
It is know that as visiting time (follow up time) of patients increased, majority of patients were more likely to be died. Also older patients were more likely to be died than younger. But, younger patients were also died as the follow up time increases. Furthermore, the interaction effect between patients had tuberculosis as a coexist and had poor diet were worsen the survival rate and it accelerating the mortality of heart failure patients by 105%. Hence, the interaction effect between regression varying covariate was decelerating survival time.
CONCLUSION
The results of this study indicated that weibull accelerated failure time model yield improved fit and best explain regression varying effect covariates on the survival time of heart failure patients than Exponential and log logistic models. The result of this five years retrospective cohort study indicated that the average survival time of sampled patients were 3.5 years. The results of this study indicated that some covariates including the interaction effect between variables had effects over time on the survival time of patients. In addition, the coexistence of other disease like, diabetes, corollary artery disease, stroke and tuberculosis as a coexist were accelerated mortality.
However, the survival time of patients was not depending on sex and coronary kidney disease, Pneumonia, HIV and Hypertension as coexistence. The reason, for this result was the applications of Weibull accelerated failure model.
RECOMMENDATIONS
Attention is better given for covariates that had effects over time on time to death of patients with heart failure. In addition, strategies for those contributing factors by frequent follow up of a patient is important to predict treatment outcome of patients and Clinicians give attention to potential coexistence while prescribing treatments. Furthermore, Medicare coverage for home testing better to explained.
LIMITATIONS OF THE STUDY
One of the limitations of this study could be the interaction effects observed during data analysis. They are not considered during data collection. It was thus difficult to answer whether these interactions affected the survival time of patients in this investigation. Another limitation could be that the data were taken at two treatment site. Considering more than two sites in the investigation would have made a difference in giving additional information about the findings. Further study on time to death predictors of heart failure infected patients and regression varying effect covariate models is thus recommended. Moreover, the study design for the current investigation shows that survival time of the patient was measured retrospectively, but some important covariates were missed and discard. This needs further investigation and can be considered as potential research gap for future investigators.
DECLARATIONS
Ethics Approval and Consent to Participate Ethics approval certificate had been obtained from both Woldia University, Ethiopia and medical directors of Dessie referral hospital
, As the study was based on secondary data, informed consent was not needed.
FUNDING
This study was funded by Woldia University which were not involved in design of study, data collection, analysis and interpretation and there is no financial conflict between the authors and individual or institution.
AUTHORS’ CONTRIBUTIONS
HDM conceived and designed the study. The Author done study validation, formal analysis, investigation resources, data curation, writing (original draft preparation), writing (review and editing), Visualization, funding acquisition.
ACKNOWLEDGEMENT
The authors have special gratitude for data collectors and supervisors for their dedicated work. Also I would like to thank woldia university for funding this study and the university does not involved in this study.


