Blood Pressure, Oxygen Consumption and Superoxide Dismutase in Young Men in the Annual Cycle
- 1. Institute of Physiology, Komi Science Center, Russia
Abstract
A group of healthy men (12 to 33 subjects) aged 18-22 years was surveyed monthly for one year. Men worked up to 8-10 hours outdoors every day (European North of Russia: 62° N and 51° W). Systolic and diastolic blood pressures (BP), oxygen consumption (V`O2), superoxide dismutase (SOD) activity, and their dependence on the ambient temperature and atmospheric pressure were studied throughout the annual cycle. The maximum systolic BP values were revealed in November and May; the minimum systolic BP values were in June and March. The highest diastolic BP values were registered in February and March, while the lowest diastolic BP values were in May and June. The highest correlation coefficients were found in the annual cycle between systolic BP and V`O2 (r=0.310, p<0.001) and between SOD and the ambient temperature (r=0.360, p<0.001). Annual dynamics of the studied parameters indicate a shift in priorities for monitoring BP at different times of the year among the residents of the North that must be considered when designing antihypertensive therapy schemes.
Keywords
Blood pressure, Oxygen consumption , Superoxide dismutase ,Healthy men, Annual cycles.
Citation
Varlamova N, Evdokimov V, Shadrina V, Kaneva A, Bojko E (2015) Blood Pressure, Oxygen Consumption and Superoxide Dismutase in Young Men in the Annual Cycle. Ann Clin Exp Hypertension 3(1): 1019.
INTRODUCTION
The study of the influence of climatic factors on human health and the development of preventive protection measures is one of the activities of the World Health Organization. There are complex interactions between the season, temperature and blood pressure (BP) [1-4]. Seasonal fluctuations in BP may increase the risk of cardiovascular events during the cold season and affect the results of clinical trials and epidemiological studies [4]. Hypertensive heart disease among Caucasians in the North is one of the most frequent and typical diseases of adaptation to extreme natural and work conditions [5]. Multiple repetitions and consolidation of seasonal adaptive responses in residents of cold climates may lead to increases in BP at an earlier age. In the pathogenesis of cardiovascular diseases, including hypertension, the reactive oxygen species, especially the superoxide radical anion, play an important role. The superoxide radical anion level in the cell is maintained by superoxide dismutase (SOD), one of the major antioxidant enzymes. Inhibiting the oxidation of nitric oxide, which has a vasodilating effect, SOD prevents the formation of the strong oxidant peroxynitrite, thereby preventing dysfunction of the endothelial cells [6]. Decreased synthesis or decreased SOD activity in vasomotor center cells of the medulla oblongata may be the cause of hypertension [7]. The annual cycles of BP were studied in several scientific papers [2-4]. However, we have not found any studies in the available literature that compare the annual dynamics of oxygen consumption (V`O2 ) and SOD activity; therefore, the aim of our work is to study the dynamics of BP in men in the annual cycle and to determine its dependence on V`O2 , SOD activity, ambient temperature and atmospheric pressure.
OBJECTS AND METHODS
Throughout the year, the same group of healthy young men (12 to 33 subjects) aged 18- 22 years was surveyed monthly. The group consisted of residents the European North of Russia (62o N and 51o W) that were busy with physical outdoor work (moderate severity) up to 8-10 hours every day. 39% of studied subjects were nonsmokers, 61% of men smoked on average up to 10 cigarettes per day. Each subject gave written informed consent for participating in the study, which was approved by the ethics committee of Institute of Physiology, Komi Science Center, and Ural Branch of Russian Academy of Sciences.
A total of 316 surveys were performed where the annual cycles of BP, V`O2 and SOD activity were studied. The survey was carried out on an outpatient basis in the middle of each month from October 2004 to September 2005, inclusive. A doctor measured an office BP level three times on the left arm (interval between the measurements was about three minutes) at rest, sitting, by the Korotkoff method, using the Micro life model BR AG- 1-30(Switzerland) mechanical device. Measurements of BP were performed in the morning (between 9:00 and 12:00). In the statistical processing of the results, the minimum BP value was taken into account. The percentage of oxygen uptake was determined using the Holden Exhaled Breath Gas Analyzer-2-10 (Russia), and the respiratory minute volume (V`E) was determined using the Volumeter 45084 (Germany). V`O2 was measured using the formula: V`O2 =V`E*percentage of oxygen uptake.
SOD activity was measured by a method based on the inhibition of the reduction reaction of nitroblue tetrazolium to formazan (hydrazine tetrazolium) by superoxide anion radicals of oxygen O2 ¯, generated by the «NADH - phenazine methosulfate» system [8,9]. The values of the ambient air temperature at 10 meters above ground level and atmospheric pressure on the day of the survey were obtained from the Centre for Hydrometeorology and Environmental Monitoring of the Republic of Komi.
The statistical analysis was performed using Statistica 6.0 (Statsoft, Tulsa, USA). Data are presented as means (M) and standard deviations (SD). Differences in the annual dynamics of each parameter were tested by one-way analysis of variance (ANOVA) followed by the post hoc Newman-Keuls test. Correlation analysis was used to assess the associations between indices. The accepted level of significance was p<0.05.
RESULTS
General characteristics of the contingent are presented in Table 1. Systolic and diastolic BP, V`O2 and SOD activity in the annual cycle in men are presented in Table 2, and the meteorological parameters measured during the survey (mean daily temperature and average atmospheric pressure) are presented in Table 3.
Systolic blood pressure
Systolic BP values in men in the annual cycle differed significantly (p<0.05, ANOVA) (Table 2). The average annual systolic BP was 119.9±8.6 mmHg. The highest systolic BP values were registered in November (123.3±7.3 mmHg) and May (123.0±9.2 mmHg). The minimum systolic BP values were observed in June (116.1±9.7 mmHg) and March (116.3±10.5 mmHg). The difference between the maximum and minimum systolic BP values in the annual cycle was 7.2 mmHg.
Table 1: General characteristics of the surveyed contingent.
| Indicators | Χ± SD | Min-max |
| Age, years | 19.0±0.9* | 18.0-22.0* |
| Height, sm | 175.7±5.6 | 161.5-193.0 |
| Body weight, kg | 69.9±5.8 | 54.8-87.5 |
There were no significant differences in the height and body weight of men throughout the annual cycle. The age in men had increased: *(p<0.05, ANOVA).
Comparing the adjacent months (Newman-Keuls criterion), there were no significant differences in systolic BP values. In the annual cycle, systolic BP had the highest correlation coefficient with V`O2 (r=0.310, p<0.001) (Figure 1), and as for the meteorological factors, systolic BP had the highest correlation coefficient with the atmospheric pressure value (r =-0.116, p<0.05).
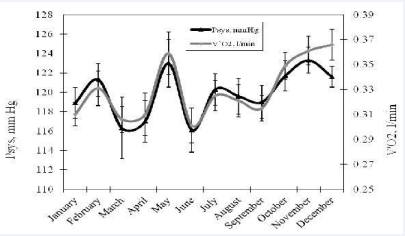
Figure 1 Systolic blood pressure (p<0.05) and oxygen consumption (p<0.001) in men in the annual cycle.
Diastolic blood pressure
There were no statistically significant differences between diastolic BP values in the annual cycle and between months. The average annual diastolic BP was 71.9±7.7 mmHg. The highest diastolic BP values were revealed in February (74.3±8.7 mmHg) and March (74.0±8.9 mmHg) (Table 2), and the lowest diastolic BP values were measured in May (69.0±6.0 mmHg) and June (69.2±6.1 mmHg). The difference between the average monthly minimum and maximum diastolic BP levels was 5.3 mmHg. Diastolic BP had no significant correlations with the physiological and meteorological parameters reviewed in the article.
Table 2: Arterial blood pressure, oxygen consumption and superoxide dismutase activity in men in the annual cycle.
| Months(number of month) | Arterial blood pressure, mm Hg | Oxygen Consumption,1/ min | Superoxide dismutase activity, U/ml of rythrocytes | ||
| Systolic | Diastolic | ||||
| January (1) | M | 118.9 |
73 .2 |
0.310 | 20.3*5,7-9 |
| SD | 9.0 | 7.7 | 0.053 | 8.3 | |
| n | 33 | 33 | 33 | 23 | |
| February (2) | M | 121.3 | 74.3 | 0.331 | 15.7*7-10 |
| SD | 8.8 | 8.7 | 0.073 | 6.5 | |
| n | 28 | 28 | 28 | 25 | |
| March (3) | M | 116.3 | 74.0 | 0.306 | 18.1*7-9 |
| SD | 10.5 | 8.9 | 0.035 | 3.0 | |
| n | 12 | 12 | 12 | 6 | |
| April (4) | M | 117.0 | 72.1 | 0.310 | 15.7*7-10 |
| SD | 10.3 | 10.1 | 0.081 | 2.8 | |
| n | 24 | 24 | 24 | 18 | |
| May (5) | M | 123.0 | 69.0 | 0.359 | 10.0*1,6-10,12 |
| SD | 9.2 | 6.0 | 0.063 | 5.4 | |
| n | 15 | 15 | 15 | 12 | |
| June (6) | M | 116.1 | 69.2 | 0.301*11-12 | 18.8*5,7-9 |
| SD | 9.7 | 6.1 | 0.060 | 5.0 | |
| n | 19 | 19 | 19 | 16 | |
| July (7) | M | 120.3 | 72.5 | 0.325 | 26.9*1-6,8-9,11 |
| SD | 7.2 | 8.5 | 0.053 | 8.1 | |
| n | 20 | 20 | 20 | 18 | |
| August (8) | M | 119.6 | 72.5 | 0.321 | 39.9*1-7,9-12 |
| SD | 8.8 | 7.1 | 0.062 | 3.4 | |
| n | 24 | 24 | 24 | 22 | |
| September (9) | M | 119.0 | 73.5 | 0.315 | 32.3*1-8,10-12 |
| SD | 8.2 | 5.0 | 0.049 | 6.5 | |
| n | 24 | 24 | 24 | 23 | |
| October (10) | M | 121.7 | 70.6 | 0.349 | 25.6*2,4-5,8-9,11 |
| SD | 8.5 | 7.5 | 0.058 | 9.1 | |
| n | 30 | 31 | 31 | 18 | |
| November (11) | M | 123.3 | 72.0 | 0.361*6 | 14.6*7-10 |
| SD | 7.3 | 8.8 | 0.064 | 4.5 | |
| n | 32 | 33 | 33 | 31 | |
| December (12) | M | 121.6 | 69.8 | 0.366*6 | 21.4*5,8-9 |
| SD | 5.9 | 7.9 | 0.069 | 6.0 | |
| n | 32 | 32 | 32 | 10 | |
| P value | p<0.05 | p>0.05 | p<0.001 | p<0.001 | |
Note: Data are means (M) and standard deviations (SD). P value –statistically significant difference in the annual cycle (ANOVA). * – differences between months are statistically significant at p<0.05 (Newman-Keuls test).
Oxygen consumption
V`O2 in men differed significantly throughout the annual cycle (p<0.001, ANOVA) (Table 2). The average annual V`O2 value was 0.330±0.057 l/min. The highest V`O2 levels were observed in December (0.366±0.069 l/min) and November (0.361±0.064 l/min). The minimum V`O2 levels in men were reported in June (0.301±0.060 l/min) and March (0.306±0.035 l/min.). The V`O2 values in November and December were statistically significantly different (p<0.05, Newman-Keuls criterion) from the values in June. The difference between the maximum and the minimum V`O2 values in the annual cycle was 0.065 l/min. V`O2 values had the highest correlation coefficient with systolic BP (r=0.310, p<0.001).
Superoxide dismutase
SOD activity was significantly different throughout the annual cycle (p<0.001, ANOVA) (Table 2). The average annual SOD activity corresponded to 21.6±5.7 U/ml erythrocytes. The highest SOD value was recorded in August (39.9±3.4 U/ml erythrocytes), and the lowest SOD value was observed in May (10.0±5.4 U/ml erythrocytes). The difference between the maximum and the minimum SOD activity was 29.9 U/ml erythrocytes. In August and September, the SOD activity was higher (p<0.05) than in the other months. SOD activity was lower (p<0.05) in May than in January, the period of July through October, and December. The SOD activity had the highest correlation coefficient with the ambient air temperature on the test day (r=0.360, p<0.001).
Table 3: Air temperature at a height of 10 meters above ground level and atmospheric pressure in the annual cycle.
| Months (number of month) | Temperature °C | Pressure, kPa | |
| January (1) | M | 18.9*2-10,12 | 103.1*2-12 |
| SD | 2.5 | c | |
| n | 4 | 4 | |
| February (2) | M | -12.1*1,4-11 | 99.4*1 |
| SD | 1.4 | 1.0 | |
| n | 3 | 3& | |
| March (3) | M | -13.6*1,4-11 | 99.1*1 |
| SD | 1.0 | 1.0 | |
| n | 2 | 2 | |
| April (4) | M | -0.5*1-3,5-9,11- 12 | 99.4*1 |
| SD | 2.6 | 0.7 | |
| n | 4 | 4 | |
| May (5) | M | 14.7*1-4,7,9-12 | 99.0*1 |
| SD | 6.3 | 1.1 | |
| n | 3 | 3 | |
| June (6) | M | 10.5*1-4,10-12 | 99.2*1 |
| SD | 1.1 | 0.1 | |
| n | 3 | 3 | |
| July (7) | M | 6.9*1-5,8,10-12 | 99.7*1 |
| SD | 0.7 | 0.2 | |
| n | 3 | 3 | |
| August (8) | M | 14.6*1-4,7,9-12 | 100.3*1 |
| SD | 0.6 | 0.6 | |
| n | 3 | 3 | |
| September (9) | M | 7.1*1-5,8,10-12 | 99.3*1 |
| SD | 1.1 | 0.2 | |
| n | 3 | 3 | |
| October (10) | M | 0.7*1-3,5-9,11- 12 | 99.5*1 |
| SD | 2.1 | 1.0 | |
| n | 5 | 5 | |
| November (11) | M | -19.4* 2-10,12 | 99.1*1 |
| SD | 2.1 | 1.31 | |
| n | 4 | 4 | |
| December (12) | M | -9.4* 1,4-11 | 99.6*1 |
| SD | 4.2 | 0.1 | |
| n | 3 | 3 | |
| P value | p>0.001 |
Note: Data are means (M) and standard deviations (SD). P value – statistically significant difference in the annual cycle (ANOVA). * – differences between months are statistically significant at p<0.05 (Newman-Keuls test).
DISCUSSION
The seasonal dynamics of BP were described by numerous authors [4, 10-15]; however, there are no studies comparing annual dynamics of BP with V`O2 and SOD activity. In annual dynamics of BP, the maximum systolic BP values were observed in autumn (November, 123.3±7.3 mmHg) and spring (May, 123.0±9.2 mmHg), and the minimum systolic BP values were registered in summer (June, 116.1±9.7 mmHg). The highest diastolic BP values were revealed in winter (February, 74.3±8.7 mmHg), and the lowest diastolic BP values were measured in spring (May, 69.0±6.0 mmHg). The highest and lowest values of the ambient air temperature at the time of registration of BP were observed in May and November, respectively. The minimum values of atmospheric pressure and SOD activity were registered in May. Our data on systolic BP are consistent with data from other study M. Modesti with the colleagues [4] have studied influence of seasonality on ambulatory BP monitoring (n=1897) and have revealed that the highest systolic BP in subjects was in spring (130.9±13.9mmHg) and the lowest systolic BP was in summer (126.8±12.8 mmHg). However, annual dynamics of diastolic BP were different from our data. M. Modesti with the colleagues [4] have shown that the maximum diastolic BP was in spring, and the minimum diastolic BP was in winter, whereas in our research, the maximum and minimum diastolic BP values were in winter (February, 74.3±8.7 mmHg) and spring (May, 69.0±6.0 mmHg), respectively. This difference is probably due to the more severe climatic conditions in our region. The low level of vaso relaxant nitric oxide against the background of the high values of vasoconstrictiveendothelin-1 was observed in February [16], which could be a cause of the maximum diastolic BP values revealed by us in February. The spring and summer systolic BP peaks were described in the study by G.Y. Nicolau with the colleagues [2], and the winter peaks of systolic BP were described in the studies by P.J. Brennan with the colleagues [1] and F. Halberg with the colleagues [17]. The autumn systolic BP peak and the summer minimum of diastolic BP were typical for healthy inhabitants of Tyumen [18]. According to the data of L.I. Gapon with the colleagues [18], the chronostructure restructuring was observed in healthy individuals living in the North in the spring period; the reverse changes occurred in the summer. In our opinion, the multidirectional systolic and diastolic BP changes periods in the annual cycle are the most interesting. Systolic BP values in men increase in the spring, and diastolic BP values decrease from March to May and in the autumn from September to October. In the winter, the opposite trends are observed. Systolic BP values decrease from December to January, and diastolic BP values increase in this period. Seasonal changes of systolic and diastolic BP values are most likely connected with hormonal changes [19]. In the literature BP is dependent on melatonin and aldosterone [3], renin and nor epinephrine [19]. The specific melatonin receptors are located in the smooth muscle cells and in the endothelium of the blood vessels. Currently, the violation of the temporal organization of the hemodynamic system is an indisputable fact, manifested by the phenomenon of internal and external desynchronosis of the circadian and circaseptan rhythms of the hemodynamic parameters in patients with arterial hypertension [20]. Aldosterone antagonists are effective substances for decrease of BP in humans [21]. Norepinephrine, renin, and aldosterone have a function in mediating the changes in haemodynamics [19]. In our opinion, the systolic BP decrease from December to January is associated with the manifestation of the discharge reflex [22], which occurs when the pressure in the systemic circulation is reduced in response to the increased pressure in the pulmonary circulation due to the airway constrictor reactions in cold weather conditions. A decrease of diastolic BP in the spring can be attributed to a decrease in peripheral vascular resistance (PVR) in response to an increase in air temperature both indoors and outdoors. The autumn decrease in diastolic BP can be explained by a decrease in PVR in response to the actuation of heating when the outdoor temperature is still somewhat temperate. An increase of diastolic BP in January can be attributed to PVR growth due to the frosty weather in this time of the year. Systolic BP level in the annual cycle in men almost mirrored the V`O2 dynamics, except for December (Table 2, Figure 1). This finding is confirmed by our data obtained in a survey of five healthy male volunteers aged 24.2±8.3 who were examined at room temperature (20.1±0.7ºC) and in a climate chamber at -11.4±4.2ºC. During the transition from the heat to the cold and staying in the cold for 15 minutes, systolic BP value increased from 114.2±13.3 mmHg to 120.4±7.9 mmHg (5.4% ), and the V`O2 value increased from 0.437±0.210 l/min to 0.597±0.384 l/ min (36.6%). According to the previously published data [23], V`O2 increases in cold temperatures. In the experiments [24] have demonstrated that an increase in blood flow in rats’ skeletal muscle in the cold combined with increased utilization of oxygen in them. The high V`O2 levels at low temperatures are caused by the inclusion of the chemical thermoregulation mechanisms and heat gain processes. The maximum systolic BP levels in May and November combined with the minimum values of SOD activity in these months (Table 2). Free radical oxidation is activated by the increased catecholamine release of the adrenal cortex, which inhibit the antioxidant system, and in particular SOD [25]. However, [26], adrenaline increases SOD activity of the endothelial cells in the human coronary artery with regular physical exercise. According to O. Jung with the colleagues [27], BP in the SOD-activity deficient mice was higher than in the mice without SOD activity deficiency. The application of recombinant SOD in hypertensive mice lowered BP [27]. J. Redon with the colleagues [28] have studied oxidative status in 606 hypertensive patients and 16 normotensive volunteers, and have shown that SOD activity was significantly lower in hypertensive patients when compared with normal subjects. This fact confirms the annual dynamics of BP and SOD revealed by us. One of the mechanisms of hypertension may be related to the stay of northern residents in a cold climate for most of the year. Cold temperatures may cause the implementation and consolidation of adaptive factors which contribute to the maintenance of higher BP levels, and this is confirmed by our results obtained previously. A. Guyton with the colleagues [29] substantiated the concept of BP regulation, implying the consolidation of various control mechanisms of BP. In general, BP is regulated by chemo- and baro receptors, which are concentrated in the aortic arch and the area of the carotid arteries bifurcation (carotid sinus). There is evidence that in the plasmatic cell membrane of the lung neuro epithelial corpuscles and the carotid sinus, there are systems that monitor hydrogen peroxide levels (H2 O2 ) [30,31]. The systems consist of NADPH oxidase and K+-channels, which are activated by H2 O2 . The NADPH oxidase oxidizes the intracellular NADPH, transferring electrons to the outside of the membrane where there is a one-electron reduction of oxygen (O2 ) to the superoxide radical anion O2 ¯. Two molecules of O2 ¯ dismutate forming O2 and H2 O2 . The dismutation reaction of O2 ¯ is catalyzed by SOD [32]. Cu-Zn SOD, as well as other enzyme isoforms, has been shown to play an important role in the functioning of the macro- and micro vascular endothelium, preventing the formation of peroxynitrite [6]. The speed of reactive oxygen species formation and the antioxidant system action depend on tissue oxygen saturation. The intensive V`O2 leads to increased formation of active oxygen forms, which in turn act as the antioxidant system modulators [30,33]. The minimum SOD activity in the observed annual cycle was revealed in the spring (May), and the maximum value of SOD activity was in the summer (August). In comparing SOD activity and V`O2 , it was revealed that the enzyme activity increases with increasing V`O2 (in July and December) and decreases with V`O2 level reduction (in January and September). In patients with hypertension, it has also been shown that SOD activity in the blood is significantly reduced when compared to healthy individuals [6,28,34]. In the annual cycle, the negative dependence between BP and SOD values was confirmed for systolic BP in most months (except January, July and September). The same dependence for diastolic BP was found in September and from November to March. Factorial structure analysis of the environment shows that the day length, atmospheric pressure, temperature and relative air humidity are significant abiotic factors for the human body and have a sinusoidal character and regular annual rhythm [35]. At daily observations in two Moscow clinics for 7 and 13 years, an influence of terrestrial weather factors (atmospheric pressure, air temperature and geomagnetic activity) on the development of acute cardiac pathologies was noted. It appeared that the temperature effects were the most significant [36,37], and these results are confirmed by our data. SOD activity had the highest correlation with the outdoor temperature, and systolic BP had the highest correlation with the atmospheric pressure. Dependence of BP on ambient temperatures is discussed in many studies [1,4,12- 14]. Ambient temperature is an important factor in determining BP [14], however, T. Fujiwara with the colleagues [10] have observed a seasonal variation in BP in 25 hypertensive patients who live almost entirely indoors in a stable environmental temperature; BP was also higher in winter than in summer. This indicates probably a multi-component regulation of BP (by both internal and external factors) where ambient temperature plays an important but not the only decisive role. The circadian BP structure depends on hormonal factors, such as the hypothalamicadrenal system, the hypothalamic-pituitary-thyroid system, the renin- aldosterone system and also on the various vaso active peptides. The same can be said with regard to the annual rhythm of BP. Only a complex combination of different endogenous interactions and exogenous factors results in specific BP levels. The highest systolic BP correlation coefficient with ambient temperatures and atmospheric pressure (r=-0.590, p<0.05) was typical for May, while the lowest coefficient was typical for November. Most significantly, diastolic BP correlated with temperatures in December (r=-0.334, p<0.05), and with atmospheric pressure in May (r=-0.305, p<0.05). It is likely that during the seasonal adaptation, there is a change of priorities for monitoring level indicators that is expressed in the redistribution of the connection force between them. The results obtained within the framework of biorhythmological research are not only fundamental but also have great practical value [25]. The seasonal changes in BP level require personal control of antihypertensive drugs in patients [4]. Ignoring the chronomedicine regularities may significantly reduce the effectiveness of treatment [25]. Early diagnosis and optimal treatment of cardiovascular diseases help to reduce morbidity and mortality in the working age population and can have a significant economic effect.
CONCLUSION
1. The maximum systolic BP values in men were found in November and May. The maximum diastolic BP values were in February and March. The minimum systolic BP values were typical for June and March, and the minimum diastolic BP values were typical for May and June.
2. Maximum correlation coefficients were found between systolic BP and V`O2 , as well as between SOD activity and the ambient temperature.
3. The dynamics of systolic and diastolic BP, V`O2 and SOD activity in the annual cycle in men indicate a shift in priorities for monitoring BP at different times of the year, which requires the development of criteria for antihypertensive therapy based on the annual trend of indicators.
REFERENCES
3. Portela A, Northrup G, Halberg F, Cornélissen G, Wendt H, Melby JC. Changes in human blood pressure with season, age and solar cycles: a 26 year record. Int J Biometeorol. 1996; 39: 176-181.
23.Jessen R. An assessment of human regulatory mechanisms of noshivering thermogenesis. Acta anaesthesiol. 1980; 24: 138-143.


